Races in Gulf Breeze, Florida (FL) Detailed Stats
Data:
Races - White alone (%)
Races - White alone (% change since 2000)
Races - Black alone (%)
Races - Black alone (% change since 2000)
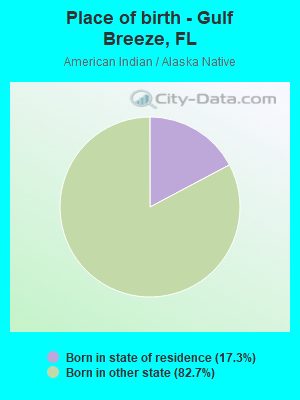
Races - American Indian alone (%)
Races - American Indian alone (% change since 2000)
Races - Asian alone (%)
Races - Asian alone (% change since 2000)
Races - Hispanic (%)
Races - Hispanic (% change since 2000)
Races - Native Hawaiian and Other Pacific Islander alone (%)
Races - Native Hawaiian and Other Pacific Islander alone (% change since 2000)
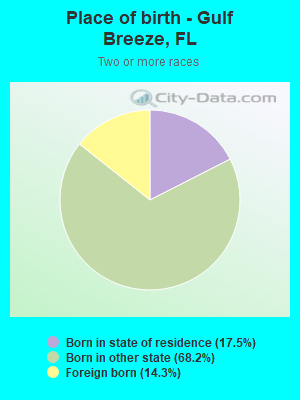
Races - Two or more races(%)
Races - Two or more races(% change since 2000)
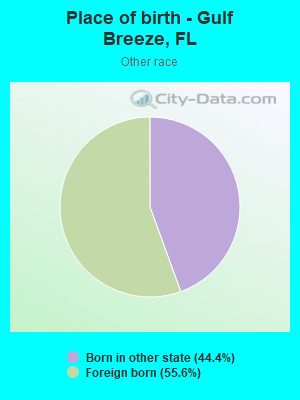
Races - Other race alone (%)
Races - Other race alone (% change since 2000)
Racial diversity
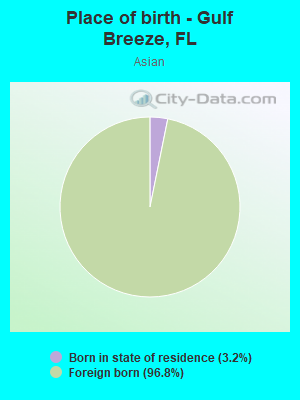
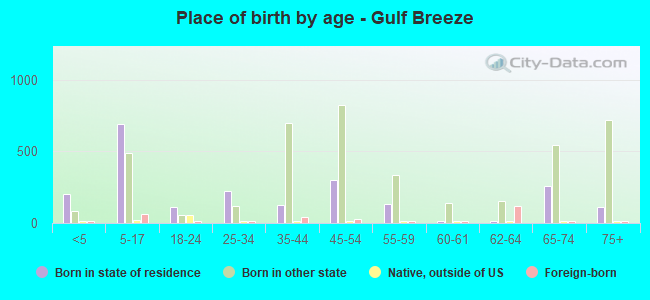
Place of birth - Born in state of residence (%)
Place of birth - Born in state of residence (%) - White
Place of birth - Born in state of residence (%) - Black or African American
Place of birth - Born in state of residence (%) - Asian
Place of birth - Born in state of residence (%) - Hispanic or Latino
Place of birth - Born in state of residence (%) - American Indian and Alaska Native
Place of birth - Born in state of residence (%) - Multirace
Place of birth - Born in state of residence (%) - Other Race
Place of birth - Born in other state (%)
Place of birth - Born in other state (%) - White
Place of birth - Born in other state (%) - Black or African American
Place of birth - Born in other state (%) - Asian
Place of birth - Born in other state (%) - Hispanic or Latino
Place of birth - Born in other state (%) - American Indian and Alaska Native
Place of birth - Born in other state (%) - Multirace
Place of birth - Born in other state (%) - Other Race
Place of birth - Native, outside of US (%)
Place of birth - Native, outside of US (%) - White
Place of birth - Native, outside of US (%) - Black or African American
Place of birth - Native, outside of US (%) - Asian
Place of birth - Native, outside of US (%) - Hispanic or Latino
Place of birth - Native, outside of US (%) - American Indian and Alaska Native
Place of birth - Native, outside of US (%) - Multirace
Place of birth - Native, outside of US (%) - Other Race
Place of birth - Foreign born (%)
Place of birth - Foreign born (%) - White
Place of birth - Foreign born (%) - Black or African American
Place of birth - Foreign born (%) - Asian
Place of birth - Foreign born (%) - Hispanic or Latino
Place of birth - Foreign born (%) - American Indian and Alaska Native
Place of birth - Foreign born (%) - Multirace
Place of birth - Foreign born (%) - Other Race
Residents speaking English at home (%)
Residents speaking English at home - Born in the United States (%)
Residents speaking English at home - Native, born elsewhere (%)
Residents speaking English at home - Foreign born (%)
Residents speaking Spanish at home (%)
Residents speaking Spanish at home - Born in the United States (%)
Residents speaking Spanish at home - Native, born elsewhere (%)
Residents speaking Spanish at home - Foreign born (%)
Residents speaking other language at home (%)
Residents speaking other language at home - Born in the United States (%)
Residents speaking other language at home - Native, born elsewhere (%)
Residents speaking other language at home - Foreign born (%)
Marital status - Never married (%)
Marital status - Now married (%)
Marital status - Separated (%)
Marital status - Widowed (%)
Marital status - Divorced (%)
Ancestries Reported - Arab (%)
Ancestries Reported - Czech (%)
Ancestries Reported - Danish (%)
Ancestries Reported - Dutch (%)
Ancestries Reported - English (%)
Ancestries Reported - French (%)
Ancestries Reported - French Canadian (%)
Ancestries Reported - German (%)
Ancestries Reported - Greek (%)
Ancestries Reported - Hungarian (%)
Ancestries Reported - Irish (%)
Ancestries Reported - Italian (%)
Ancestries Reported - Lithuanian (%)
Ancestries Reported - Norwegian (%)
Ancestries Reported - Polish (%)
Ancestries Reported - Portuguese (%)
Ancestries Reported - Russian (%)
Ancestries Reported - Scotch-Irish (%)
Ancestries Reported - Scottish (%)
Ancestries Reported - Slovak (%)
Ancestries Reported - Subsaharan African (%)
Ancestries Reported - Swedish (%)
Ancestries Reported - Swiss (%)
Ancestries Reported - Ukrainian (%)
Ancestries Reported - United States (%)
Ancestries Reported - Welsh (%)
Ancestries Reported - West Indian (%)
Ancestries Reported - Other (%)
Geographical mobility - Same house 1 year ago (%)
Geographical mobility - Same house 1 year ago (%) - White
Geographical mobility - Same house 1 year ago (%) - Black or African American
Geographical mobility - Same house 1 year ago (%) - Asian
Geographical mobility - Same house 1 year ago (%) - Hispanic or Latino
Geographical mobility - Same house 1 year ago (%) - American Indian and Alaska Native
Geographical mobility - Same house 1 year ago (%) - Multirace
Geographical mobility - Same house 1 year ago (%) - Other Race
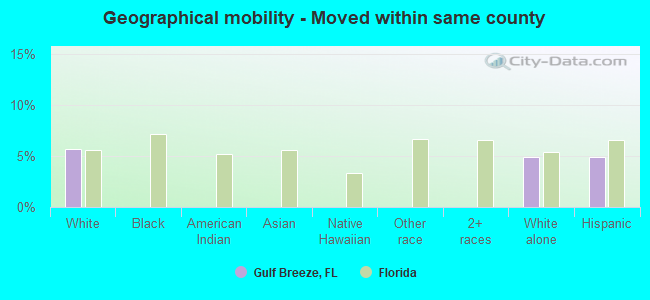
Geographical mobility - Moved within same county (%)
Geographical mobility - Moved within same county (%) - White
Geographical mobility - Moved within same county (%) - Black or African American
Geographical mobility - Moved within same county (%) - Asian
Geographical mobility - Moved within same county (%) - Hispanic or Latino
Geographical mobility - Moved within same county (%) - American Indian and Alaska Native
Geographical mobility - Moved within same county (%) - Multirace
Geographical mobility - Moved within same county (%) - Other Race
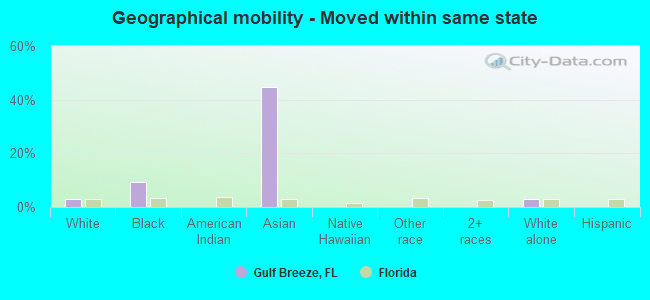
Geographical mobility - Moved from different county within same state (%)
Geographical mobility - Moved from different county within same state (%) - White
Geographical mobility - Moved from different county within same state (%) - Black or African American
Geographical mobility - Moved from different county within same state (%) - Asian
Geographical mobility - Moved from different county within same state (%) - Hispanic or Latino
Geographical mobility - Moved from different county within same state (%) - American Indian and Alaska Native
Geographical mobility - Moved from different county within same state (%) - Multirace
Geographical mobility - Moved from different county within same state (%) - Other Race
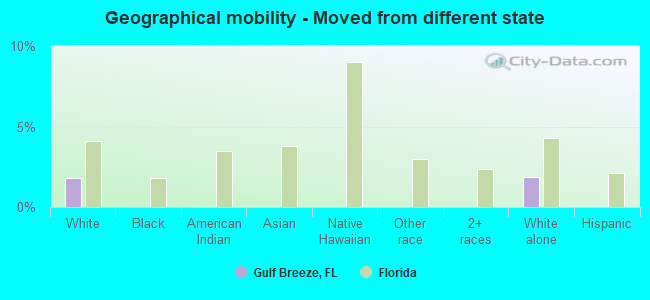
Geographical mobility - Moved from different state (%)
Geographical mobility - Moved from different state (%) - White
Geographical mobility - Moved from different state (%) - Black or African American
Geographical mobility - Moved from different state (%) - Asian
Geographical mobility - Moved from different state (%) - Hispanic or Latino
Geographical mobility - Moved from different state (%) - American Indian and Alaska Native
Geographical mobility - Moved from different state (%) - Multirace
Geographical mobility - Moved from different state (%) - Other Race
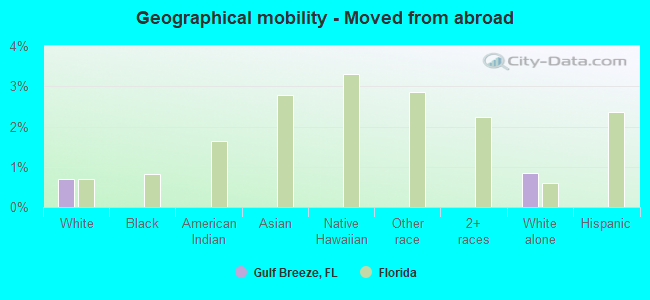
Geographical mobility - Moved from abroad (%)
Geographical mobility - Moved from abroad (%) - White
Geographical mobility - Moved from abroad (%) - Black or African American
Geographical mobility - Moved from abroad (%) - Asian
Geographical mobility - Moved from abroad (%) - Hispanic or Latino
Geographical mobility - Moved from abroad (%) - American Indian and Alaska Native
Geographical mobility - Moved from abroad (%) - Multirace
Geographical mobility - Moved from abroad (%) - Other Race
Place of birth for the foreign-born population - Ireland (%)
Place of birth for the foreign-born population - Denmark (%)
Place of birth for the foreign-born population - Norway (%)
Place of birth for the foreign-born population - Sweden (%)
Place of birth for the foreign-born population - United Kingdom (%)
Place of birth for the foreign-born population - England (%)
Place of birth for the foreign-born population - Scotland (%)
Place of birth for the foreign-born population - Other Northern Europe (%)
Place of birth for the foreign-born population - Austria (%)
Place of birth for the foreign-born population - Belgium (%)
Place of birth for the foreign-born population - France (%)
Place of birth for the foreign-born population - Germany (%)
Place of birth for the foreign-born population - Netherlands (%)
Place of birth for the foreign-born population - Switzerland (%)
Place of birth for the foreign-born population - Other Western Europe (%)
Place of birth for the foreign-born population - Greece (%)
Place of birth for the foreign-born population - Italy (%)
Place of birth for the foreign-born population - Portugal (%)
Place of birth for the foreign-born population - Spain (%)
Place of birth for the foreign-born population - Other Southern Europe (%)
Place of birth for the foreign-born population - Albania (%)
Place of birth for the foreign-born population - Belarus (%)
Place of birth for the foreign-born population - Bosnia and Herzegovina (%)
Place of birth for the foreign-born population - Bulgaria (%)
Place of birth for the foreign-born population - Croatia (%)
Place of birth for the foreign-born population - Czechoslovakia (%)
Place of birth for the foreign-born population - Hungary (%)
Place of birth for the foreign-born population - Latvia (%)
Place of birth for the foreign-born population - Lithuania (%)
Place of birth for the foreign-born population - North Macedonia (Macedonia) (%)
Place of birth for the foreign-born population - Moldova (%)
Place of birth for the foreign-born population - Poland (%)
Place of birth for the foreign-born population - Romania (%)
Place of birth for the foreign-born population - Russia (%)
Place of birth for the foreign-born population - Serbia (%)
Place of birth for the foreign-born population - Ukraine (%)
Place of birth for the foreign-born population - Other Eastern Europe (%)
Place of birth for the foreign-born population - China (%)
Place of birth for the foreign-born population - Hong Kong (%)
Place of birth for the foreign-born population - Taiwan (%)
Place of birth for the foreign-born population - Japan (%)
Place of birth for the foreign-born population - Korea (%)
Place of birth for the foreign-born population - Other Eastern Asia (%)
Place of birth for the foreign-born population - Afghanistan (%)
Place of birth for the foreign-born population - Bangladesh (%)
Place of birth for the foreign-born population - India (%)
Place of birth for the foreign-born population - Iran (%)
Place of birth for the foreign-born population - Kazakhstan (%)
Place of birth for the foreign-born population - Nepal (%)
Place of birth for the foreign-born population - Pakistan (%)
Place of birth for the foreign-born population - Sri Lanka (%)
Place of birth for the foreign-born population - Uzbekistan (%)
Place of birth for the foreign-born population - Other South Central Asia (%)
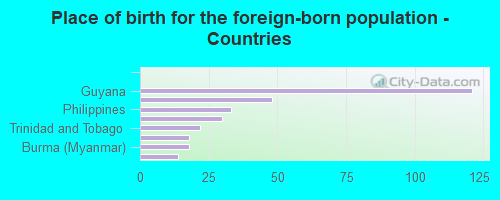
Place of birth for the foreign-born population - Burma (%)
Place of birth for the foreign-born population - Cambodia (%)
Place of birth for the foreign-born population - Indonesia (%)
Place of birth for the foreign-born population - Laos (%)
Place of birth for the foreign-born population - Malaysia (%)
Place of birth for the foreign-born population - Philippines (%)
Place of birth for the foreign-born population - Singapore (%)
Place of birth for the foreign-born population - Thailand (%)
Place of birth for the foreign-born population - Vietnam (%)
Place of birth for the foreign-born population - Other South Eastern Asia (%)
Place of birth for the foreign-born population - Armenia (%)
Place of birth for the foreign-born population - Iraq (%)
Place of birth for the foreign-born population - Israel (%)
Place of birth for the foreign-born population - Jordan (%)
Place of birth for the foreign-born population - Kuwait (%)
Place of birth for the foreign-born population - Lebanon (%)
Place of birth for the foreign-born population - Saudi Arabia (%)
Place of birth for the foreign-born population - Syria (%)
Place of birth for the foreign-born population - Turkey (%)
Place of birth for the foreign-born population - Yemen (%)
Place of birth for the foreign-born population - Other Western Asia (%)
Place of birth for the foreign-born population - Eritrea (%)
Place of birth for the foreign-born population - Ethiopia (%)
Place of birth for the foreign-born population - Kenya (%)
Place of birth for the foreign-born population - Somalia (%)
Place of birth for the foreign-born population - Uganda (%)
Place of birth for the foreign-born population - Zimbabwe (%)
Place of birth for the foreign-born population - Other Eastern Africa (%)
Place of birth for the foreign-born population - Cameroon (%)
Place of birth for the foreign-born population - Congo (%)
Place of birth for the foreign-born population - Democratic Republic of Congo (Zaire) (%)
Place of birth for the foreign-born population - Other Middle Africa (%)
Place of birth for the foreign-born population - Egypt (%)
Place of birth for the foreign-born population - Morocco (%)
Place of birth for the foreign-born population - Sudan (%)
Place of birth for the foreign-born population - Other Northern Africa (%)
Place of birth for the foreign-born population - South Africa (%)
Place of birth for the foreign-born population - Other Southern Africa (%)
Place of birth for the foreign-born population - Cabo Verde (%)
Place of birth for the foreign-born population - Ghana (%)
Place of birth for the foreign-born population - Liberia (%)
Place of birth for the foreign-born population - Nigeria (%)
Place of birth for the foreign-born population - Senegal (%)
Place of birth for the foreign-born population - Sierra Leone (%)
Place of birth for the foreign-born population - Other Western Africa (%)
Place of birth for the foreign-born population - Australia (%)
Place of birth for the foreign-born population - New Zealand (%)
Place of birth for the foreign-born population - Fiji (%)
Place of birth for the foreign-born population - Micronesia (%)
Place of birth for the foreign-born population - Bahamas (%)
Place of birth for the foreign-born population - Barbados (%)
Place of birth for the foreign-born population - Cuba (%)
Place of birth for the foreign-born population - Dominica (%)
Place of birth for the foreign-born population - Dominican Republic (%)
Place of birth for the foreign-born population - Grenada (%)
Place of birth for the foreign-born population - Haiti (%)
Place of birth for the foreign-born population - Jamaica (%)
Place of birth for the foreign-born population - St. Vincent and the Grenadines (%)
Place of birth for the foreign-born population - Trinidad and Tobago (%)
Place of birth for the foreign-born population - West Indies (%)
Place of birth for the foreign-born population - Other Caribbean (%)
Place of birth for the foreign-born population - Belize (%)
Place of birth for the foreign-born population - Costa Rica (%)
Place of birth for the foreign-born population - El Salvador (%)
Place of birth for the foreign-born population - Guatemala (%)
Place of birth for the foreign-born population - Honduras (%)
Place of birth for the foreign-born population - Mexico (%)
Place of birth for the foreign-born population - Nicaragua (%)
Place of birth for the foreign-born population - Panama (%)
Place of birth for the foreign-born population - Other Central America (%)
Place of birth for the foreign-born population - Argentina (%)
Place of birth for the foreign-born population - Bolivia (%)
Place of birth for the foreign-born population - Brazil (%)
Place of birth for the foreign-born population - Chile (%)
Place of birth for the foreign-born population - Colombia (%)
Place of birth for the foreign-born population - Ecuador (%)
Place of birth for the foreign-born population - Guyana (%)
Place of birth for the foreign-born population - Peru (%)
Place of birth for the foreign-born population - Uruguay (%)
Place of birth for the foreign-born population - Venezuela (%)
Place of birth for the foreign-born population - Other South America (%)
Place of birth for the foreign-born population - Canada (%)
Place of birth for the foreign-born population - Other Northern America (%)
Place of birth for the foreign-born population - Other (%)
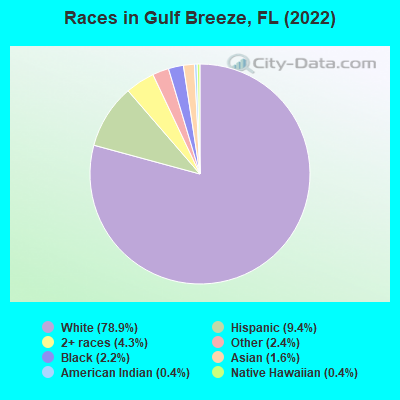
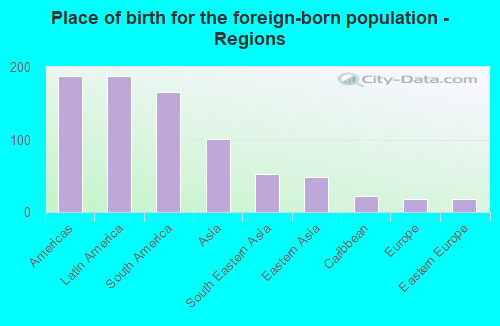
According to 2022 data, the most numerous races in Gulf Breeze, FL are White alone (5,273 residents), Hispanic (628 residents), and Black alone (145 residents). 97.6% of Gulf Breeze residents speak English at home. 4.6% of Gulf Breeze, FL residents are foreign-born (2.8% born in Latin America, 1.5% born in Asia), which is 355.8% less than the foreign-born rate of 21.0% across the entire state of Florida.
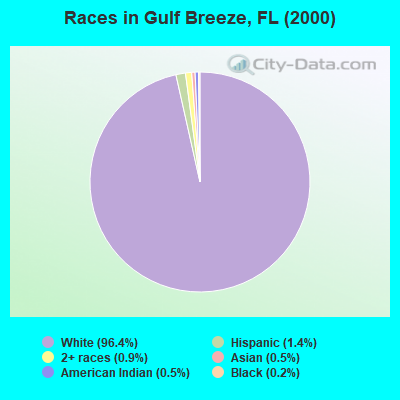
Race distribution in Gulf Breeze
2000 2022
10,458,509 65.4% White alone 2,682,715 16.8% Hispanic 2,264,268 14.2% Black alone 261,693 1.6% Asian alone 236,954 1.5% Two or more races 42,358 0.3% American Indian alone 28,994 0.2% Other race alone 6,887 0.04% Native Hawaiian and Other
11,309,403 50.8% White alone 6,025,039 27.1% Hispanic 3,241,015 14.6% Black alone 861,630 3.9% Two or more races 623,692 2.8% Asian alone 152,054 0.7% Other race alone 22,504 0.1% American Indian alone 9,486 0.04% Native Hawaiian and Other
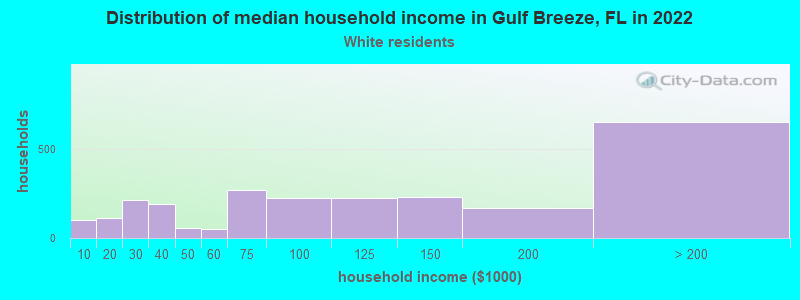
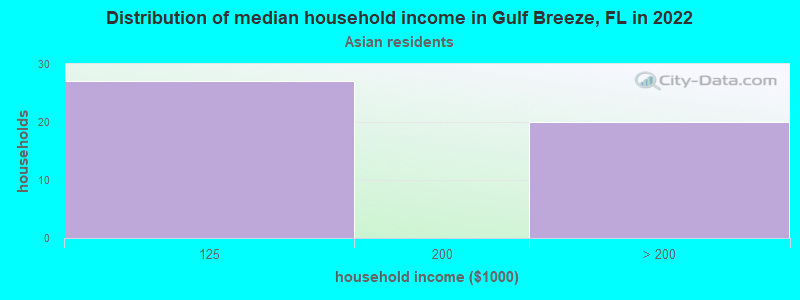
Income and house value in Gulf Breeze Median household income in 2022 $97,825 White non-Hispanic householdersMedian 2022 house value $571,182 White Non-Hispanic householders$621,266 American Indian or Alaska Native householdersover $1,000,000 Native Hawaiian and other Pacific Islander householders$786,044 Two or more races householders$430,107 Hispanic or Latino householders
Median age by race in Gulf Breeze
49.6 Median age for White residents47.3 50.1 12.3 Median age for Black or African American residents5.9 58.7 17.4 Median age for American Indian / Alaska Native residents22.5 -859,386,151.9 58.6 Median age for Asian residents-569,668,975.6 69.5 -679,849,340.2 Median age for Native Hawaiian / Pacific Islander residents-858,307,848.3 -443,298,968.6 44.3 Median age for Other race residents-841,163,310.1 36.8 46.4 Median age for Two or more races residents53.0 33.1 50.2 Median age for White alone residents47.8 51.2 39.3 Median age for Hispanic or Latino residents60.9 16.0
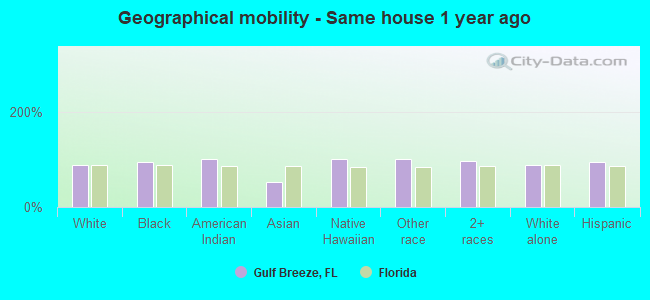
Owner/renter occupied households by race in Gulf Breeze
House owners and renters - White residents 1,805 75.4% Owner occupied588 24.6% Renter occupiedHouse owners and renters - Black or African American residents 18 100.0% Owner occupiedHouse owners and renters - American Indian / Alaska Native residents 10 100.0% Owner occupiedHouse owners and renters - Asian residents 48 100.0% Owner occupiedHouse owners and renters - Native Hawaiian / Pacific Islander residents 17 100.0% Owner occupiedHouse owners and renters - Two or more races residents 382 100.0% Owner occupiedHouse owners and renters - White alone residents 1,790 75.7% Owner occupied575 24.3% Renter occupiedHouse owners and renters - Hispanic or Latino residents 239 100.0% Owner occupied
Language usage in Gulf Breeze
English speakers - Total 97.6% of residents of Gulf Breeze speak English at home.
0.6% of residents speak Spanish at home 18 48.6% Speak English very well19 51.4% Speak English less than very well2.2% of residents speak other language at home 53 38.4% Speak English very well85 61.6% Speak English less than very well
English speakers - Born in the United States 99.6% of residents of Gulf Breeze speak English at home.
0.8% of residents speak Spanish at home 19 61.3% Speak English very well12 38.7% Speak English less than very well
English speakers - Native, born elsewhere 47.1% of residents of Gulf Breeze speak English at home.
92.2% of residents speak other language at home 47 100.0% Speak English very well
English speakers - Foreign-born 56.4% of residents of Gulf Breeze speak English at home.
7.9% of residents speak Spanish at home 21 100.0% Speak English less than very well35.3% of residents speak other language at home 20 21.3% Speak English very well74 78.7% Speak English less than very well
White (Caucasian) - Speak only English Native:
99.3% (5,183)Foreign-born:
100.0% (9)
Asian - Speak another language Native:
97.5% (3)Foreign-born:
80.4% (76)
Other race - Speak only English Native:
100.0% (64)Foreign-born:
98.4% (160)
Two or more races - Speak only English Native:
96.4% (649)Foreign-born:
54.0% (64)
Two or more races - Speak another language Native:
3.0% (20)Foreign-born:
44.8% (53)
White alone - Speak only English Native:
98.6% (5,070)Foreign-born:
99.0% (11)
Hispanic or Latino - Speak only English Native:
100.0% (494)Foreign-born:
67.2% (28)
Hispanic or Latino - Speak another language Native:
1.1% (6)Foreign-born:
50.1% (21)
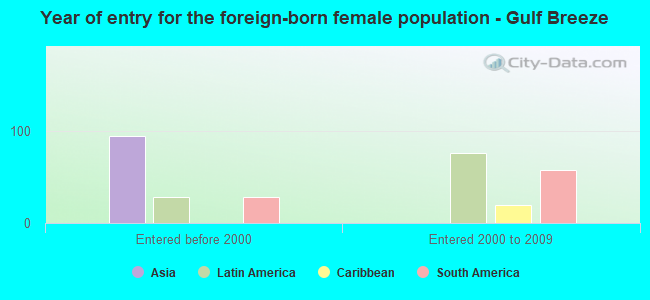
Foreign-born residents in Gulf Breeze 308 residents are foreign born (2.8% Latin America , 1.5% Asia ).
This city:
4.6%Florida:
21.1%
Marital status for residents in Gulf Breeze Marital status - White (Caucasian) population 15 years and over
Males 18.7% Never married69.0% Now married0.0% Separated4.8% Widowed7.5% DivorcedFemales 19.5% Never married48.5% Now married3.1% Separated9.9% Widowed18.9% DivorcedWomen who gave birth in the past 12 months Now married:
100.0% (60)Unmarried:
0.0% (0)
Women who did not give birth in the past 12 months Now married:
53.4% (572)Unmarried:
46.6% (500)
Marital status - Native Hawaiian / Pacific Islander population 15 years and over
Males 0.0% Never married100.0% Now married0.0% Separated0.0% Widowed0.0% DivorcedFemales 0.0% Never married0.0% Now married0.0% Separated0.0% Widowed100.0% DivorcedMarital status - Other race population 15 years and over
Males 76.7% Never married23.3% Now married0.0% Separated0.0% Widowed0.0% DivorcedFemales 0.0% Never married0.0% Now married0.0% Separated0.0% Widowed100.0% DivorcedWomen who did not give birth in the past 12 months Now married:
0.0% (0)Unmarried:
100.0% (85)
Marital status - Two or more races population 15 years and over
Males 14.6% Never married44.5% Now married0.0% Separated0.0% Widowed40.9% DivorcedFemales 18.1% Never married52.8% Now married0.0% Separated20.6% Widowed8.5% DivorcedWomen who did not give birth in the past 12 months Now married:
63.9% (118)Unmarried:
36.1% (66)
Marital status - White alone, not Hispanic / Latino population 15 years and over
Males 18.8% Never married69.3% Now married0.0% Separated4.4% Widowed7.5% DivorcedFemales 19.3% Never married48.1% Now married3.2% Separated10.1% Widowed19.3% DivorcedWomen who gave birth in the past 12 months Now married:
100.0% (45)Unmarried:
0.0% (0)
Women who did not give birth in the past 12 months Now married:
53.4% (552)Unmarried:
46.6% (482)
Marital status - Hispanic or Latino population 15 years and over
Males 0.0% Never married41.3% Now married0.0% Separated7.3% Widowed51.4% DivorcedFemales 6.7% Never married59.8% Now married0.0% Separated19.6% Widowed13.9% DivorcedWomen who gave birth in the past 12 months Now married:
100.0% (16)Unmarried:
0.0% (0)
Women who did not give birth in the past 12 months Now married:
88.8% (126)Unmarried:
11.2% (16)
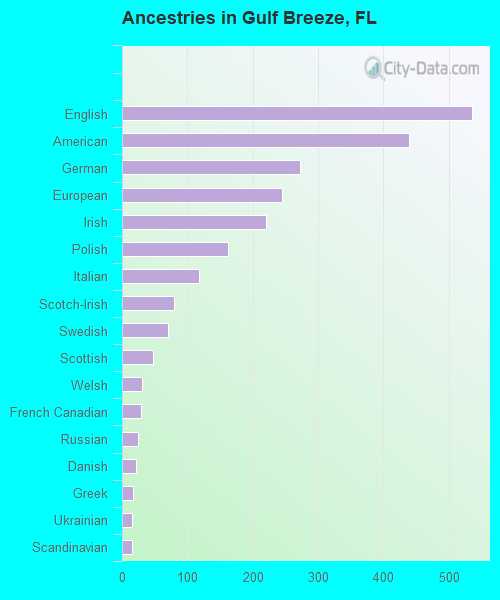
Ancestries in Gulf Breeze
535 17.6% English440 14.5% American272 9.0% German245 8.1% European221 7.3% Irish162 5.3% Polish118 3.9% Italian79 2.6% Scotch-Irish71 2.3% Swedish47 1.5% Scottish31 1.0% Welsh29 1.0% French Canadian24 0.8% Russian21 0.7% Danish17 0.6% Greek16 0.5% Ukrainian15 0.5% Scandinavian
Children Nativity (place of birth) in Gulf Breeze
Children under 6 years - Living with two parents Both parents native 312 100.0% NativeChildren under 6 years - Living with one parent Native parent 62 100.0% Native
Children 6 to 17 years - Living with two parents Both parents native 862 100.0% NativeChildren 6 to 17 years - Living with one parent Native parent 177 100.0% Native
Grandparents responsible for own grandchildren in Gulf Breeze
Grandparents (30 to 59 years) White / Caucasian 15 100.0% Not responsible for grandchildrenWhite alone, not Hispanic / Latino 15 100.0% Not responsible for grandchildren
Grandparents (60 years and over) White / Caucasian 21 100.0% Not responsible for grandchildrenWhite alone, not Hispanic / Latino 22 100.0% Not responsible for grandchildren