Races in Gulf Gate-Osprey, Florida (FL) Detailed Stats
Ancestries, Foreign-born residents, place of birth
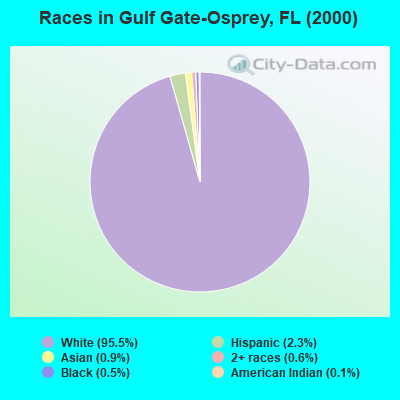
Race distribution in Gulf Gate-Osprey

- 25,98295.5%White alone
- 6192.3%Hispanic
- 2530.9%Asian alone
- 1680.6%Two or more races
- 1390.5%Black alone
- 380.1%American Indian alone
- 100.04%Other race alone
- 80.03%Native Hawaiian and Other
Pacific Islander alone
2000
2022
-
- 10,458,50965.4%White alone
- 2,682,71516.8%Hispanic
- 2,264,26814.2%Black alone
- 261,6931.6%Asian alone
- 236,9541.5%Two or more races
- 42,3580.3%American Indian alone
- 28,9940.2%Other race alone
- 6,8870.04%Native Hawaiian and Other
Pacific Islander alone

-
- 11,309,40350.8%White alone
- 6,025,03927.1%Hispanic
- 3,241,01514.6%Black alone
- 861,6303.9%Two or more races
- 623,6922.8%Asian alone
- 152,0540.7%Other race alone
- 22,5040.1%American Indian alone
- 9,4860.04%Native Hawaiian and Other
Pacific Islander alone

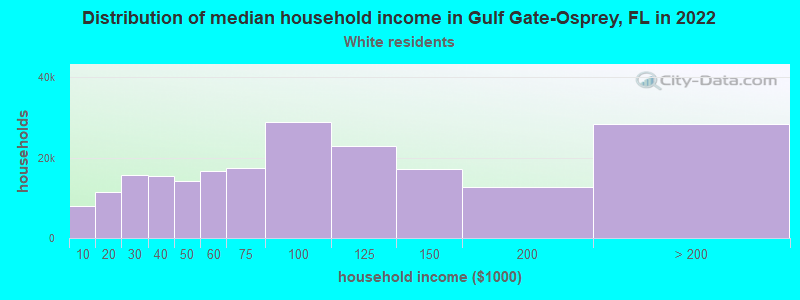
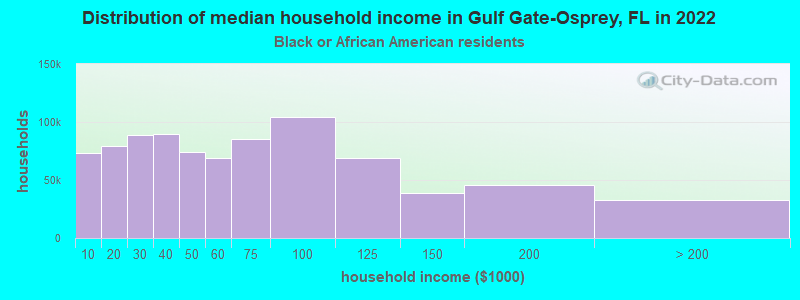
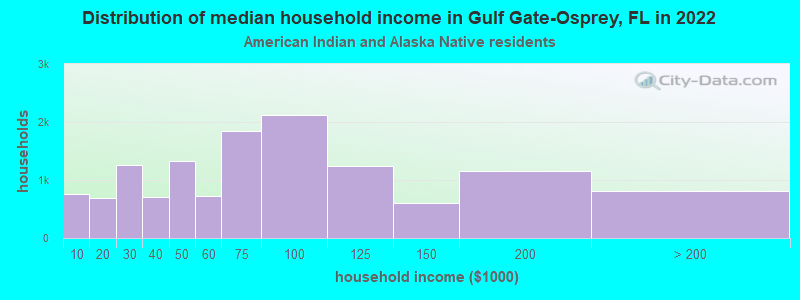
Income and house value in Gulf Gate-Osprey
- Median household income in 2022
- $87,811White non-Hispanic householders
- $103,915Black householders
- $116,672Asian householders
- $49,250Some other race householders
- $46,992Two or more races householders
- $89,592Hispanic or Latino race householders
- Median 2022 house value
- $614,407White Non-Hispanic householders
- $820,662Black or African American householders
- $519,631American Indian or Alaska Native householders
- $779,992Asian householders
- $344,968Some other race householders
- $885,298Two or more races householders
- $438,655Hispanic or Latino householders
Household income for White non-Hispanic householders
Household income for Black householders
Household income for American Indian and Alaska Native householders
Household income for Asian householders

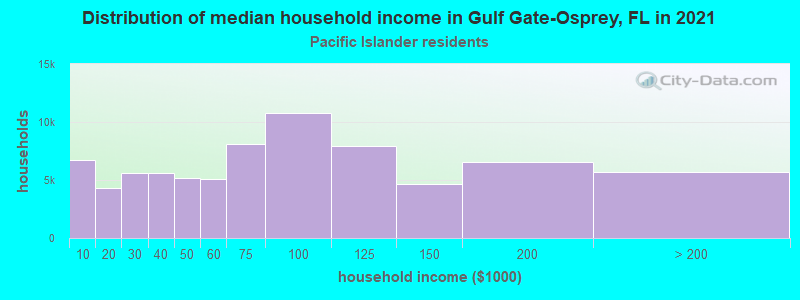
Household income for Native Hawaiian and other Pacific Islander householders
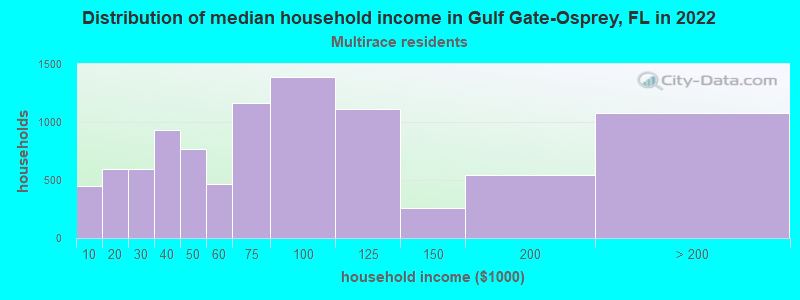
Household income for Two or more races householders
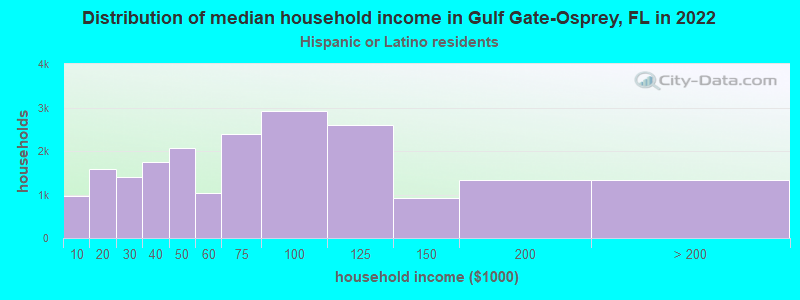
Household income for Hispanic or Latino race householders
Zip code: 34231