Races in Haledon, New Jersey (NJ) Detailed Stats
Data:
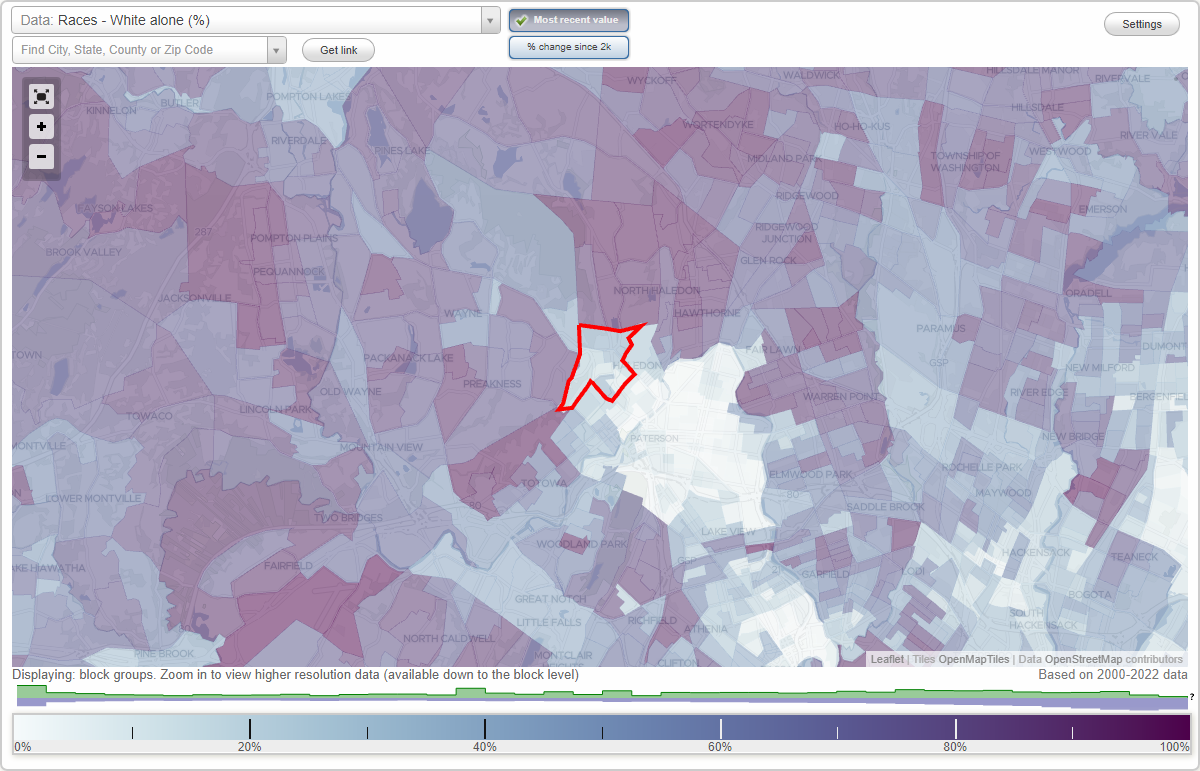
Races - White alone (%)
Races - White alone (% change since 2000)
Races - Black alone (%)
Races - Black alone (% change since 2000)
Races - American Indian alone (%)
Races - American Indian alone (% change since 2000)
Races - Asian alone (%)
Races - Asian alone (% change since 2000)
Races - Hispanic (%)
Races - Hispanic (% change since 2000)
Races - Native Hawaiian and Other Pacific Islander alone (%)
Races - Native Hawaiian and Other Pacific Islander alone (% change since 2000)
Races - Two or more races(%)
Races - Two or more races(% change since 2000)
Races - Other race alone (%)
Races - Other race alone (% change since 2000)
Racial diversity
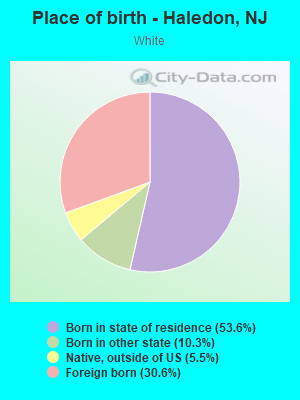
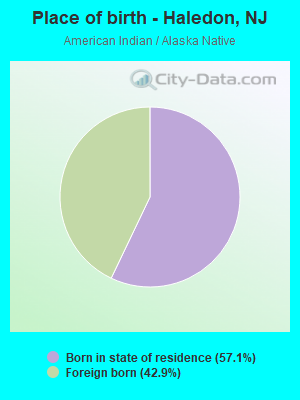
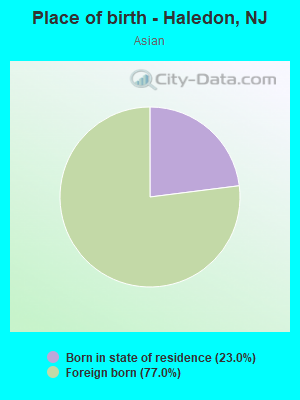
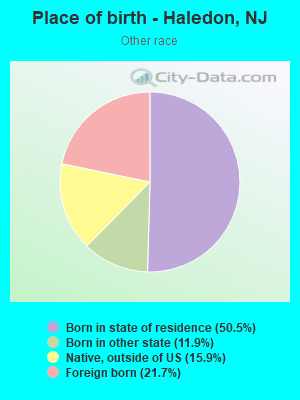
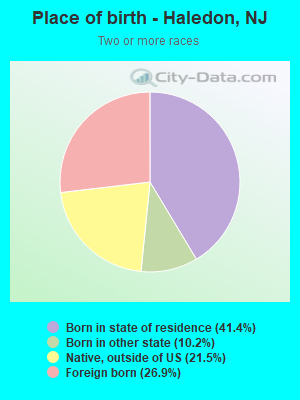
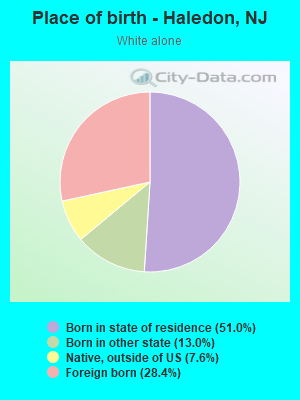
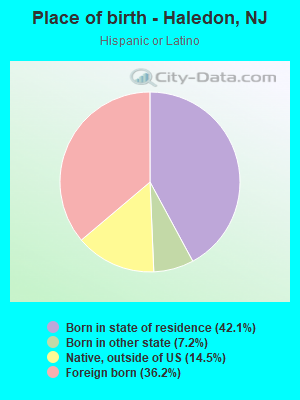
Place of birth - Born in state of residence (%)
Place of birth - Born in state of residence (%) - White
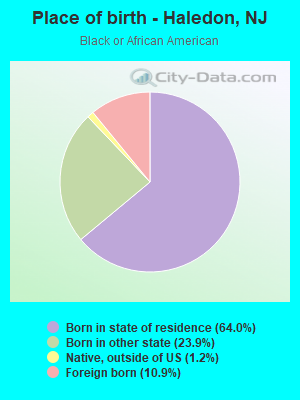
Place of birth - Born in state of residence (%) - Black or African American
Place of birth - Born in state of residence (%) - Asian
Place of birth - Born in state of residence (%) - Hispanic or Latino
Place of birth - Born in state of residence (%) - American Indian and Alaska Native
Place of birth - Born in state of residence (%) - Multirace
Place of birth - Born in state of residence (%) - Other Race
Place of birth - Born in other state (%)
Place of birth - Born in other state (%) - White
Place of birth - Born in other state (%) - Black or African American
Place of birth - Born in other state (%) - Asian
Place of birth - Born in other state (%) - Hispanic or Latino
Place of birth - Born in other state (%) - American Indian and Alaska Native
Place of birth - Born in other state (%) - Multirace
Place of birth - Born in other state (%) - Other Race
Place of birth - Native, outside of US (%)
Place of birth - Native, outside of US (%) - White
Place of birth - Native, outside of US (%) - Black or African American
Place of birth - Native, outside of US (%) - Asian
Place of birth - Native, outside of US (%) - Hispanic or Latino
Place of birth - Native, outside of US (%) - American Indian and Alaska Native
Place of birth - Native, outside of US (%) - Multirace
Place of birth - Native, outside of US (%) - Other Race
Place of birth - Foreign born (%)
Place of birth - Foreign born (%) - White
Place of birth - Foreign born (%) - Black or African American
Place of birth - Foreign born (%) - Asian
Place of birth - Foreign born (%) - Hispanic or Latino
Place of birth - Foreign born (%) - American Indian and Alaska Native
Place of birth - Foreign born (%) - Multirace
Place of birth - Foreign born (%) - Other Race
Residents speaking English at home (%)
Residents speaking English at home - Born in the United States (%)
Residents speaking English at home - Native, born elsewhere (%)
Residents speaking English at home - Foreign born (%)
Residents speaking Spanish at home (%)
Residents speaking Spanish at home - Born in the United States (%)
Residents speaking Spanish at home - Native, born elsewhere (%)
Residents speaking Spanish at home - Foreign born (%)
Residents speaking other language at home (%)
Residents speaking other language at home - Born in the United States (%)
Residents speaking other language at home - Native, born elsewhere (%)
Residents speaking other language at home - Foreign born (%)
Marital status - Never married (%)
Marital status - Now married (%)
Marital status - Separated (%)
Marital status - Widowed (%)
Marital status - Divorced (%)
Ancestries Reported - Arab (%)
Ancestries Reported - Czech (%)
Ancestries Reported - Danish (%)
Ancestries Reported - Dutch (%)
Ancestries Reported - English (%)
Ancestries Reported - French (%)
Ancestries Reported - French Canadian (%)
Ancestries Reported - German (%)
Ancestries Reported - Greek (%)
Ancestries Reported - Hungarian (%)
Ancestries Reported - Irish (%)
Ancestries Reported - Italian (%)
Ancestries Reported - Lithuanian (%)
Ancestries Reported - Norwegian (%)
Ancestries Reported - Polish (%)
Ancestries Reported - Portuguese (%)
Ancestries Reported - Russian (%)
Ancestries Reported - Scotch-Irish (%)
Ancestries Reported - Scottish (%)
Ancestries Reported - Slovak (%)
Ancestries Reported - Subsaharan African (%)
Ancestries Reported - Swedish (%)
Ancestries Reported - Swiss (%)
Ancestries Reported - Ukrainian (%)
Ancestries Reported - United States (%)
Ancestries Reported - Welsh (%)
Ancestries Reported - West Indian (%)
Ancestries Reported - Other (%)
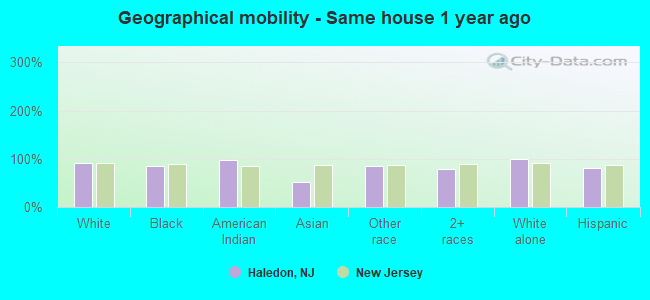
Geographical mobility - Same house 1 year ago (%)
Geographical mobility - Same house 1 year ago (%) - White
Geographical mobility - Same house 1 year ago (%) - Black or African American
Geographical mobility - Same house 1 year ago (%) - Asian
Geographical mobility - Same house 1 year ago (%) - Hispanic or Latino
Geographical mobility - Same house 1 year ago (%) - American Indian and Alaska Native
Geographical mobility - Same house 1 year ago (%) - Multirace
Geographical mobility - Same house 1 year ago (%) - Other Race
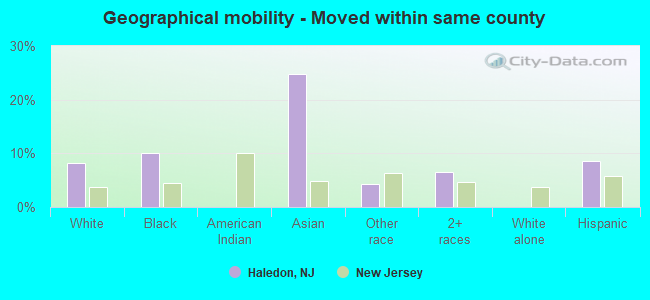
Geographical mobility - Moved within same county (%)
Geographical mobility - Moved within same county (%) - White
Geographical mobility - Moved within same county (%) - Black or African American
Geographical mobility - Moved within same county (%) - Asian
Geographical mobility - Moved within same county (%) - Hispanic or Latino
Geographical mobility - Moved within same county (%) - American Indian and Alaska Native
Geographical mobility - Moved within same county (%) - Multirace
Geographical mobility - Moved within same county (%) - Other Race
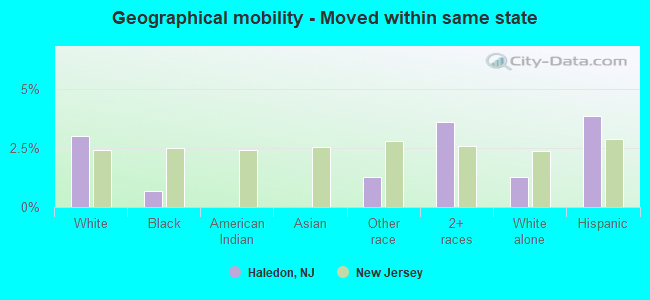
Geographical mobility - Moved from different county within same state (%)
Geographical mobility - Moved from different county within same state (%) - White
Geographical mobility - Moved from different county within same state (%) - Black or African American
Geographical mobility - Moved from different county within same state (%) - Asian
Geographical mobility - Moved from different county within same state (%) - Hispanic or Latino
Geographical mobility - Moved from different county within same state (%) - American Indian and Alaska Native
Geographical mobility - Moved from different county within same state (%) - Multirace
Geographical mobility - Moved from different county within same state (%) - Other Race
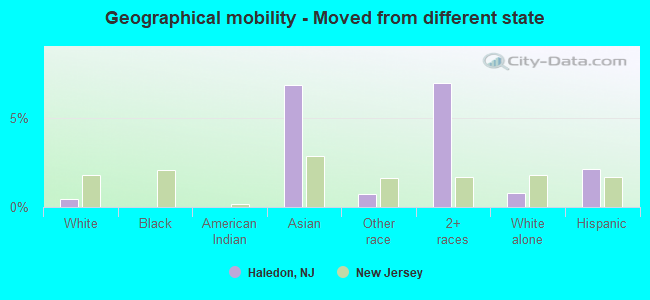
Geographical mobility - Moved from different state (%)
Geographical mobility - Moved from different state (%) - White
Geographical mobility - Moved from different state (%) - Black or African American
Geographical mobility - Moved from different state (%) - Asian
Geographical mobility - Moved from different state (%) - Hispanic or Latino
Geographical mobility - Moved from different state (%) - American Indian and Alaska Native
Geographical mobility - Moved from different state (%) - Multirace
Geographical mobility - Moved from different state (%) - Other Race
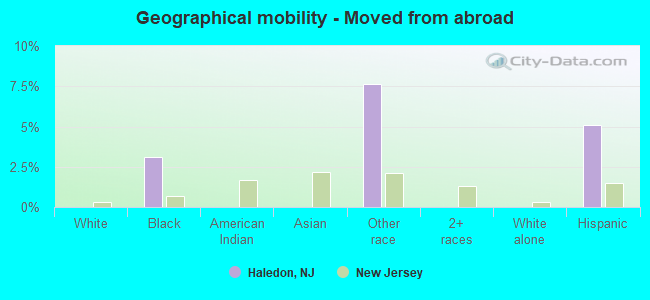
Geographical mobility - Moved from abroad (%)
Geographical mobility - Moved from abroad (%) - White
Geographical mobility - Moved from abroad (%) - Black or African American
Geographical mobility - Moved from abroad (%) - Asian
Geographical mobility - Moved from abroad (%) - Hispanic or Latino
Geographical mobility - Moved from abroad (%) - American Indian and Alaska Native
Geographical mobility - Moved from abroad (%) - Multirace
Geographical mobility - Moved from abroad (%) - Other Race
Place of birth for the foreign-born population - Ireland (%)
Place of birth for the foreign-born population - Denmark (%)
Place of birth for the foreign-born population - Norway (%)
Place of birth for the foreign-born population - Sweden (%)
Place of birth for the foreign-born population - United Kingdom (%)
Place of birth for the foreign-born population - England (%)
Place of birth for the foreign-born population - Scotland (%)
Place of birth for the foreign-born population - Other Northern Europe (%)
Place of birth for the foreign-born population - Austria (%)
Place of birth for the foreign-born population - Belgium (%)
Place of birth for the foreign-born population - France (%)
Place of birth for the foreign-born population - Germany (%)
Place of birth for the foreign-born population - Netherlands (%)
Place of birth for the foreign-born population - Switzerland (%)
Place of birth for the foreign-born population - Other Western Europe (%)
Place of birth for the foreign-born population - Greece (%)
Place of birth for the foreign-born population - Italy (%)
Place of birth for the foreign-born population - Portugal (%)
Place of birth for the foreign-born population - Spain (%)
Place of birth for the foreign-born population - Other Southern Europe (%)
Place of birth for the foreign-born population - Albania (%)
Place of birth for the foreign-born population - Belarus (%)
Place of birth for the foreign-born population - Bosnia and Herzegovina (%)
Place of birth for the foreign-born population - Bulgaria (%)
Place of birth for the foreign-born population - Croatia (%)
Place of birth for the foreign-born population - Czechoslovakia (%)
Place of birth for the foreign-born population - Hungary (%)
Place of birth for the foreign-born population - Latvia (%)
Place of birth for the foreign-born population - Lithuania (%)
Place of birth for the foreign-born population - North Macedonia (Macedonia) (%)
Place of birth for the foreign-born population - Moldova (%)
Place of birth for the foreign-born population - Poland (%)
Place of birth for the foreign-born population - Romania (%)
Place of birth for the foreign-born population - Russia (%)
Place of birth for the foreign-born population - Serbia (%)
Place of birth for the foreign-born population - Ukraine (%)
Place of birth for the foreign-born population - Other Eastern Europe (%)
Place of birth for the foreign-born population - China (%)
Place of birth for the foreign-born population - Hong Kong (%)
Place of birth for the foreign-born population - Taiwan (%)
Place of birth for the foreign-born population - Japan (%)
Place of birth for the foreign-born population - Korea (%)
Place of birth for the foreign-born population - Other Eastern Asia (%)
Place of birth for the foreign-born population - Afghanistan (%)
Place of birth for the foreign-born population - Bangladesh (%)
Place of birth for the foreign-born population - India (%)
Place of birth for the foreign-born population - Iran (%)
Place of birth for the foreign-born population - Kazakhstan (%)
Place of birth for the foreign-born population - Nepal (%)
Place of birth for the foreign-born population - Pakistan (%)
Place of birth for the foreign-born population - Sri Lanka (%)
Place of birth for the foreign-born population - Uzbekistan (%)
Place of birth for the foreign-born population - Other South Central Asia (%)
Place of birth for the foreign-born population - Burma (%)
Place of birth for the foreign-born population - Cambodia (%)
Place of birth for the foreign-born population - Indonesia (%)
Place of birth for the foreign-born population - Laos (%)
Place of birth for the foreign-born population - Malaysia (%)
Place of birth for the foreign-born population - Philippines (%)
Place of birth for the foreign-born population - Singapore (%)
Place of birth for the foreign-born population - Thailand (%)
Place of birth for the foreign-born population - Vietnam (%)
Place of birth for the foreign-born population - Other South Eastern Asia (%)
Place of birth for the foreign-born population - Armenia (%)
Place of birth for the foreign-born population - Iraq (%)
Place of birth for the foreign-born population - Israel (%)
Place of birth for the foreign-born population - Jordan (%)
Place of birth for the foreign-born population - Kuwait (%)
Place of birth for the foreign-born population - Lebanon (%)
Place of birth for the foreign-born population - Saudi Arabia (%)
Place of birth for the foreign-born population - Syria (%)
Place of birth for the foreign-born population - Turkey (%)
Place of birth for the foreign-born population - Yemen (%)
Place of birth for the foreign-born population - Other Western Asia (%)
Place of birth for the foreign-born population - Eritrea (%)
Place of birth for the foreign-born population - Ethiopia (%)
Place of birth for the foreign-born population - Kenya (%)
Place of birth for the foreign-born population - Somalia (%)
Place of birth for the foreign-born population - Uganda (%)
Place of birth for the foreign-born population - Zimbabwe (%)
Place of birth for the foreign-born population - Other Eastern Africa (%)
Place of birth for the foreign-born population - Cameroon (%)
Place of birth for the foreign-born population - Congo (%)
Place of birth for the foreign-born population - Democratic Republic of Congo (Zaire) (%)
Place of birth for the foreign-born population - Other Middle Africa (%)
Place of birth for the foreign-born population - Egypt (%)
Place of birth for the foreign-born population - Morocco (%)
Place of birth for the foreign-born population - Sudan (%)
Place of birth for the foreign-born population - Other Northern Africa (%)
Place of birth for the foreign-born population - South Africa (%)
Place of birth for the foreign-born population - Other Southern Africa (%)
Place of birth for the foreign-born population - Cabo Verde (%)
Place of birth for the foreign-born population - Ghana (%)
Place of birth for the foreign-born population - Liberia (%)
Place of birth for the foreign-born population - Nigeria (%)
Place of birth for the foreign-born population - Senegal (%)
Place of birth for the foreign-born population - Sierra Leone (%)
Place of birth for the foreign-born population - Other Western Africa (%)
Place of birth for the foreign-born population - Australia (%)
Place of birth for the foreign-born population - New Zealand (%)
Place of birth for the foreign-born population - Fiji (%)
Place of birth for the foreign-born population - Micronesia (%)
Place of birth for the foreign-born population - Bahamas (%)
Place of birth for the foreign-born population - Barbados (%)
Place of birth for the foreign-born population - Cuba (%)
Place of birth for the foreign-born population - Dominica (%)
Place of birth for the foreign-born population - Dominican Republic (%)
Place of birth for the foreign-born population - Grenada (%)
Place of birth for the foreign-born population - Haiti (%)
Place of birth for the foreign-born population - Jamaica (%)
Place of birth for the foreign-born population - St. Vincent and the Grenadines (%)
Place of birth for the foreign-born population - Trinidad and Tobago (%)
Place of birth for the foreign-born population - West Indies (%)
Place of birth for the foreign-born population - Other Caribbean (%)
Place of birth for the foreign-born population - Belize (%)
Place of birth for the foreign-born population - Costa Rica (%)
Place of birth for the foreign-born population - El Salvador (%)
Place of birth for the foreign-born population - Guatemala (%)
Place of birth for the foreign-born population - Honduras (%)
Place of birth for the foreign-born population - Mexico (%)
Place of birth for the foreign-born population - Nicaragua (%)
Place of birth for the foreign-born population - Panama (%)
Place of birth for the foreign-born population - Other Central America (%)
Place of birth for the foreign-born population - Argentina (%)
Place of birth for the foreign-born population - Bolivia (%)
Place of birth for the foreign-born population - Brazil (%)
Place of birth for the foreign-born population - Chile (%)
Place of birth for the foreign-born population - Colombia (%)
Place of birth for the foreign-born population - Ecuador (%)
Place of birth for the foreign-born population - Guyana (%)
Place of birth for the foreign-born population - Peru (%)
Place of birth for the foreign-born population - Uruguay (%)
Place of birth for the foreign-born population - Venezuela (%)
Place of birth for the foreign-born population - Other South America (%)
Place of birth for the foreign-born population - Canada (%)
Place of birth for the foreign-born population - Other Northern America (%)
Place of birth for the foreign-born population - Other (%)
Latest news about races in Haledon, NJ collected exclusively by city-data.com from local newspapers, TV, and radio stations
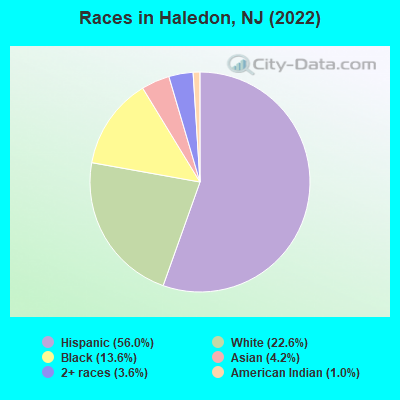
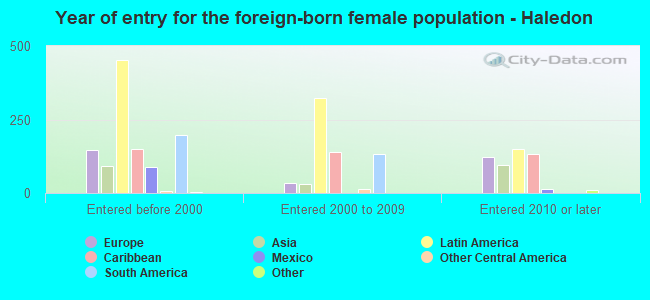
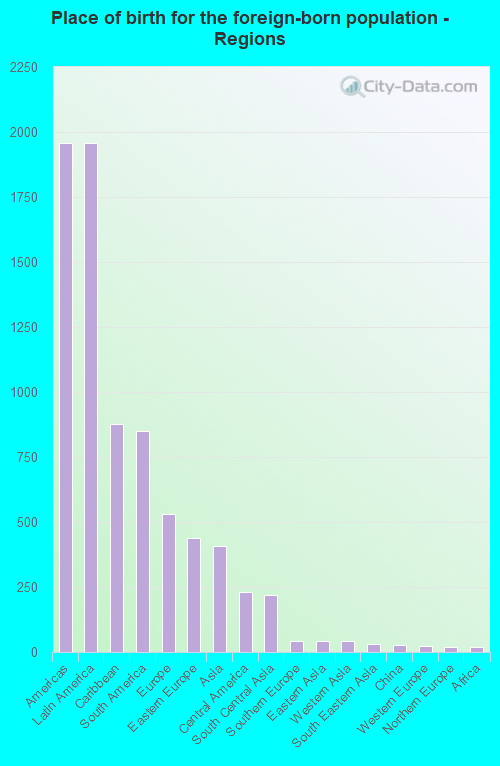
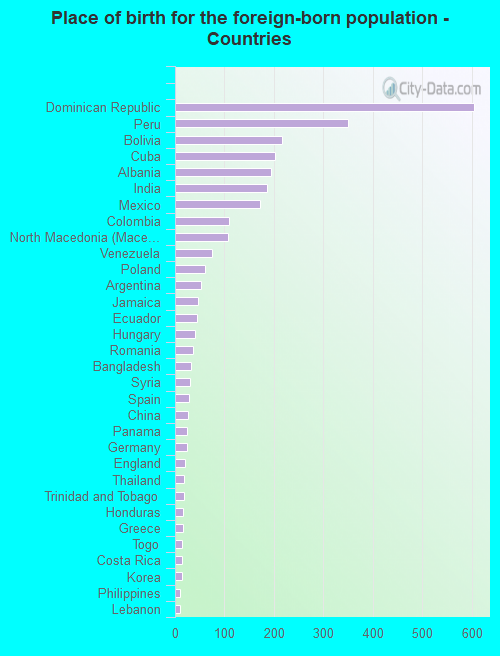
According to 2022 data, the most numerous races in Haledon, NJ are White alone (1,994 residents), Hispanic (4,946 residents), and Black alone (1,200 residents). 45.0% of Haledon residents speak English at home. 33.0% of Haledon, NJ residents are foreign-born (21.5% born in Latin America, 5.8% born in Europe, 4.5% born in Asia), which is 30.2% greater than the foreign-born rate of 23.0% across the entire state of New Jersey.
Race distribution in Haledon
2000 2022
5,557,209 66.0% White alone 1,117,191 13.3% Hispanic 1,096,171 13.0% Black alone 477,012 5.7% Asian alone 133,689 1.6% Two or more races 19,565 0.2% Other race alone 11,338 0.1% American Indian alone 2,175 0.03% Native Hawaiian and Other
4,766,476 51.5% White alone 2,028,470 21.9% Hispanic 1,111,632 12.0% Black alone 923,546 10.0% Asian alone 332,237 3.6% Two or more races 89,847 1.0% Other race alone 8,557 0.09% American Indian alone 934 0.01% Native Hawaiian and Other
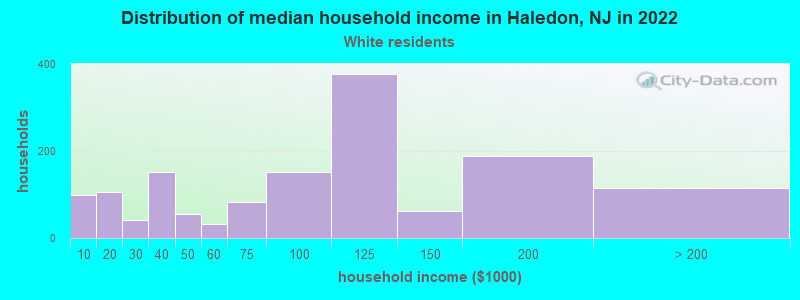
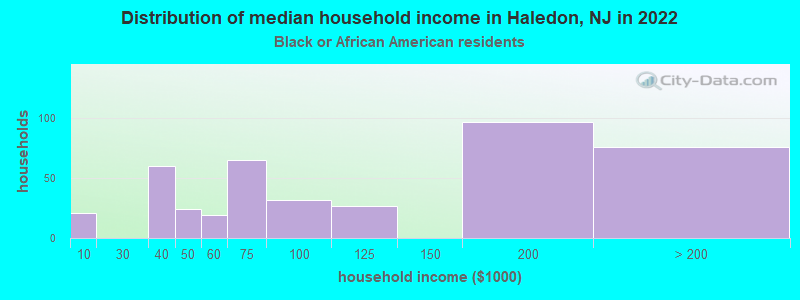
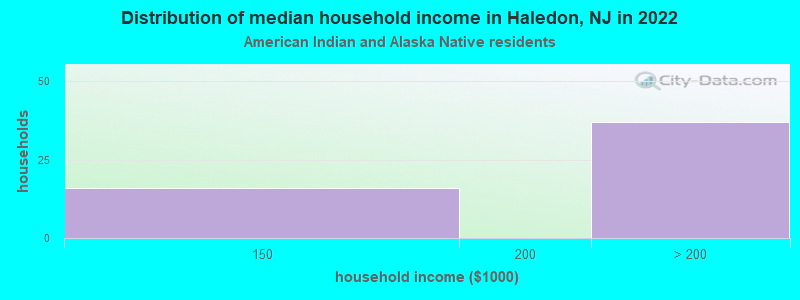
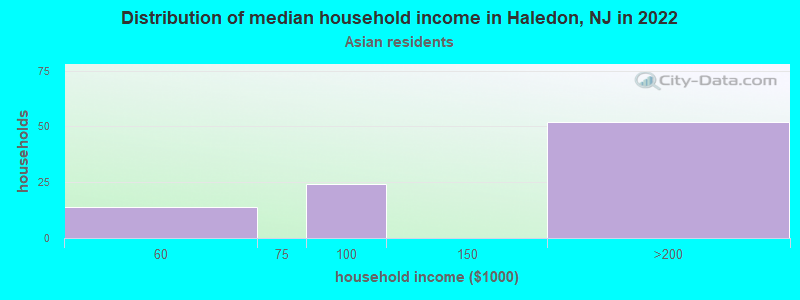
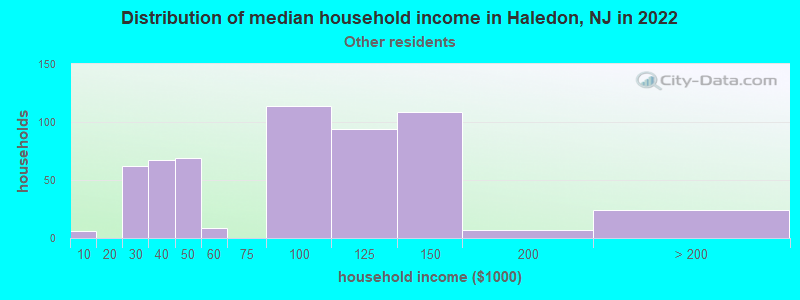
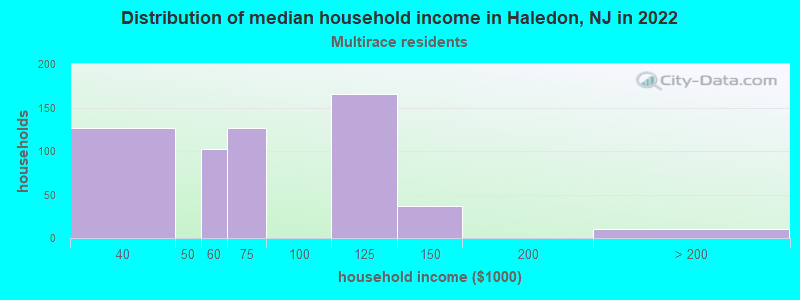
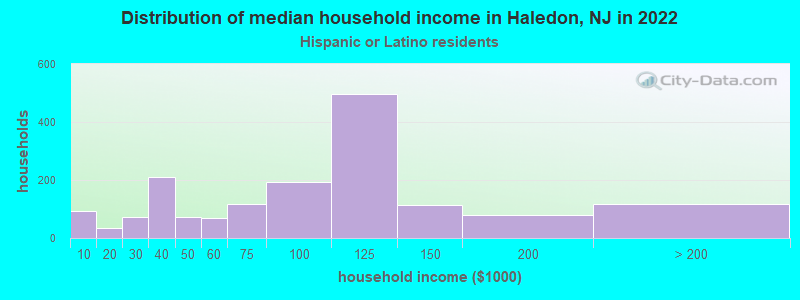
Income and house value in Haledon Median household income in 2022 $79,255 White non-Hispanic householders$190,695 Asian householders$87,256 Some other race householders$59,951 Two or more races householders$94,045 Hispanic or Latino race householdersMedian 2022 house value $329,815 White Non-Hispanic householders$344,899 Black or African American householders $382,202 Asian householders$331,242 Native Hawaiian and other Pacific Islander householders$295,977 Some other race householders$331,242 Two or more races householders$334,299 Hispanic or Latino householders
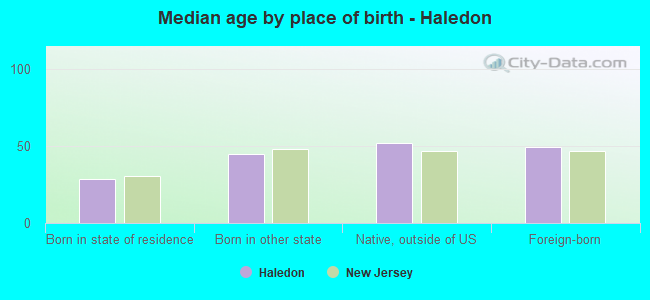
Median age by race in Haledon
51.6 Median age for White residents48.7 55.2 43.5 Median age for Black or African American residents40.5 45.7 39.0 Median age for American Indian / Alaska Native residents53.4 36.7 34.0 Median age for Asian residents34.2 35.5 -804,177,544.9 Median age for Native Hawaiian / Pacific Islander residents-860,335,194.7 -713,070,378.3 28.5 Median age for Other race residents26.6 39.9 28.8 Median age for Two or more races residents30.0 25.2 57.2 Median age for White alone residents53.8 63.5 33.3 Median age for Hispanic or Latino residents33.0 34.8
Owner/renter occupied households by race in Haledon
House owners and renters - White residents 796 57.8% Owner occupied581 42.2% Renter occupiedHouse owners and renters - Black or African American residents 219 48.1% Owner occupied236 51.9% Renter occupiedHouse owners and renters - American Indian / Alaska Native residents 65 100.0% Owner occupiedHouse owners and renters - Asian residents 96 100.0% Owner occupiedHouse owners and renters - Other race residents 343 60.4% Owner occupied225 39.6% Renter occupiedHouse owners and renters - Two or more races residents 143 27.0% Owner occupied386 73.0% Renter occupiedHouse owners and renters - White alone residents 516 54.2% Owner occupied436 45.8% Renter occupiedHouse owners and renters - Hispanic or Latino residents 797 46.9% Owner occupied904 53.1% Renter occupied
Language usage in Haledon
English speakers - Total 45.0% of residents of Haledon speak English at home.
37.9% of residents speak Spanish at home 2,078 65.9% Speak English very well1,075 34.1% Speak English less than very well16.6% of residents speak other language at home 770 56.0% Speak English very well606 44.0% Speak English less than very well
English speakers - Born in the United States 72.3% of residents of Haledon speak English at home.
27.6% of residents speak Spanish at home 138 54.8% Speak English very well114 45.2% Speak English less than very well3.7% of residents speak other language at home 34 100.0% Speak English less than very well
English speakers - Native, born elsewhere 2.4% of residents of Haledon speak English at home.
80.3% of residents speak Spanish at home 468 71.1% Speak English very well190 28.9% Speak English less than very well21.0% of residents speak other language at home 62 36.0% Speak English very well110 64.0% Speak English less than very well
English speakers - Foreign-born 8.4% of residents of Haledon speak English at home.
50.0% of residents speak Spanish at home 721 52.7% Speak English very well647 47.3% Speak English less than very well39.4% of residents speak other language at home 590 54.7% Speak English very well488 45.3% Speak English less than very well
White (Caucasian) - Speak only English Native:
71.0% (1,437)Foreign-born:
0.8% (8)
White (Caucasian) - Speak another language Native:
23.6% (479)Foreign-born:
98.1% (918)
Black or African American - Speak only English Native:
97.2% (1,109)Foreign-born:
81.3% (118)
Black or African American - Speak another language Native:
2.7% (31)Foreign-born:
11.6% (17)
Asian - Speak only English Native:
38.5% (26)Foreign-born:
4.0% (11)
Asian - Speak another language Native:
55.6% (38)Foreign-born:
97.1% (264)
Other race - Speak only English Native:
60.6% (945)Foreign-born:
1.7% (7)
Other race - Speak another language Native:
49.2% (767)Foreign-born:
97.1% (430)
Two or more races - Speak only English Native:
22.5% (201)Foreign-born:
33.1% (127)
Two or more races - Speak another language Native:
79.6% (710)Foreign-born:
65.5% (252)
White alone - Speak only English Native:
84.4% (1,153)Foreign-born:
1.4% (8)
White alone - Speak another language Native:
16.2% (221)Foreign-born:
100.0% (567)
Hispanic or Latino - Speak only English Native:
38.9% (1,133)Foreign-born:
11.0% (194)
Hispanic or Latino - Speak another language Native:
61.8% (1,799)Foreign-born:
89.7% (1,587)
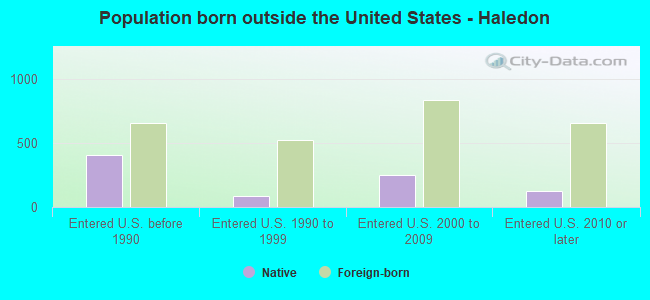
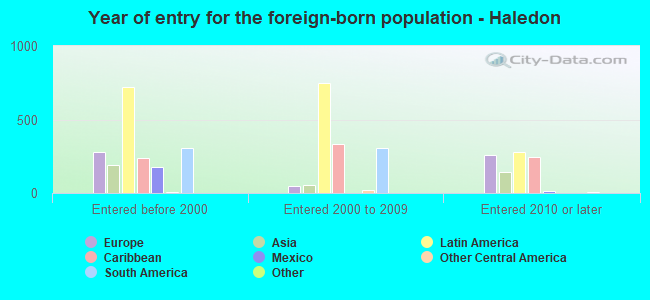
Foreign-born residents in Haledon 2,914 residents are foreign born (21.5% Latin America , 5.8% Europe , 4.5% Asia ).
This city:
33.0%New Jersey:
23.2%
Marital status for residents in Haledon Marital status - White (Caucasian) population 15 years and over
Males 30.4% Never married48.7% Now married3.5% Separated3.5% Widowed13.9% DivorcedFemales 23.1% Never married40.0% Now married7.0% Separated6.6% Widowed23.4% DivorcedWomen who gave birth in the past 12 months Now married:
0.0% (0)Unmarried:
100.0% (20)
Women who did not give birth in the past 12 months Now married:
53.7% (304)Unmarried:
46.3% (262)
Marital status - Black or African American population 15 years and over
Males 39.1% Never married46.2% Now married0.0% Separated4.4% Widowed10.3% DivorcedFemales 25.5% Never married58.2% Now married0.0% Separated10.3% Widowed6.0% DivorcedWomen who did not give birth in the past 12 months Now married:
50.1% (161)Unmarried:
49.9% (161)
Marital status - American Indian / Alaska Native population 15 years and over
Males 0.0% Never married66.1% Now married0.0% Separated0.0% Widowed33.9% DivorcedFemales 0.0% Never married75.4% Now married0.0% Separated0.0% Widowed24.6% DivorcedWomen who did not give birth in the past 12 months Now married:
100.0% (71)Unmarried:
0.0% (0)
Marital status - Asian population 15 years and over
Males 30.4% Never married69.6% Now married0.0% Separated0.0% Widowed0.0% DivorcedFemales 7.5% Never married56.9% Now married0.0% Separated35.6% Widowed0.0% DivorcedWomen who gave birth in the past 12 months Now married:
100.0% (15)Unmarried:
0.0% (0)
Women who did not give birth in the past 12 months Now married:
82.1% (58)Unmarried:
17.9% (13)
Marital status - Other race population 15 years and over
Males 58.7% Never married29.3% Now married1.0% Separated4.5% Widowed6.5% DivorcedFemales 55.6% Never married26.9% Now married0.0% Separated11.7% Widowed5.8% DivorcedWomen who did not give birth in the past 12 months Now married:
23.0% (123)Unmarried:
77.0% (411)
Marital status - Two or more races population 15 years and over
Males 69.2% Never married30.8% Now married0.0% Separated0.0% Widowed0.0% DivorcedFemales 53.6% Never married4.8% Now married0.0% Separated0.0% Widowed41.6% DivorcedWomen who did not give birth in the past 12 months Now married:
5.5% (24)Unmarried:
94.5% (420)
Marital status - White alone, not Hispanic / Latino population 15 years and over
Males 36.6% Never married49.0% Now married1.5% Separated3.2% Widowed9.8% DivorcedFemales 19.6% Never married42.0% Now married0.0% Separated8.1% Widowed30.4% DivorcedWomen who did not give birth in the past 12 months Now married:
59.1% (174)Unmarried:
40.9% (121)
Marital status - Hispanic or Latino population 15 years and over
Males 47.8% Never married34.6% Now married2.8% Separated3.3% Widowed11.5% DivorcedFemales 42.3% Never married29.7% Now married6.5% Separated6.7% Widowed14.8% DivorcedWomen who gave birth in the past 12 months Now married:
0.0% (0)Unmarried:
100.0% (26)
Women who did not give birth in the past 12 months Now married:
31.3% (394)Unmarried:
68.7% (866)
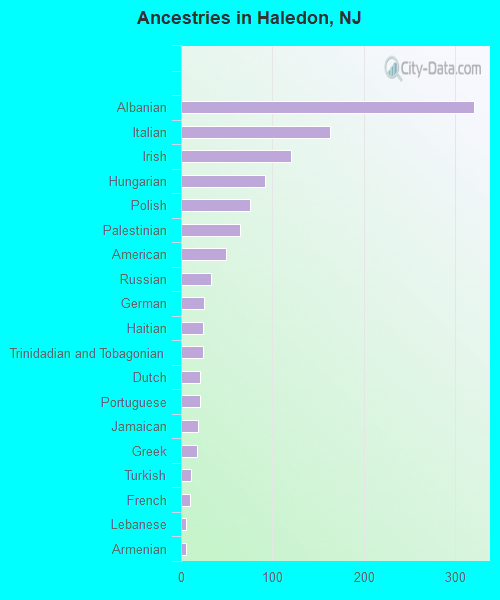
Ancestries in Haledon
321 5.6% Albanian163 2.9% Italian120 2.1% Irish92 1.6% Hungarian75 1.3% Polish65 1.1% Palestinian49 0.9% American33 0.6% Russian25 0.4% German24 0.4% Haitian24 0.4% Trinidadian and Tobagonian21 0.4% Dutch21 0.4% Portuguese19 0.3% Jamaican18 0.3% Greek11 0.2% Turkish10 0.2% French5 0.09% Lebanese5 0.09% Armenian2 0.04% Syrian
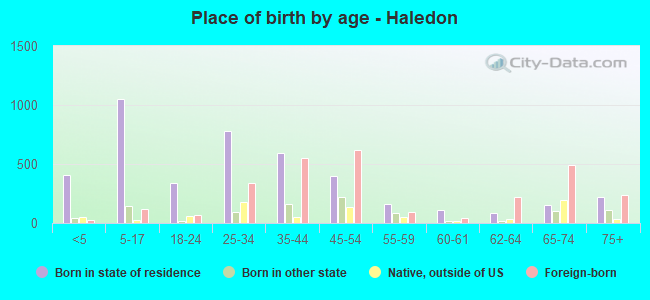
Children Nativity (place of birth) in Haledon
Children under 6 years - Living with two parents Both parents native 176 100.0% NativeBoth parents foreign-born 109 77.1% Native32 22.9% Foreign-bornOne native, one foreign-born parent 141 100.0% NativeChildren under 6 years - Living with one parent Native parent 123 100.0% NativeForeign-born parent 89 100.0% NativeChildren 6 to 17 years - Living with two parents Both parents native 245 100.0% NativeBoth parents foreign-born 165 74.4% Native57 25.6% Foreign-bornOne native, one foreign-born parent 79 100.0% NativeChildren 6 to 17 years - Living with one parent Native parent 393 100.0% NativeForeign-born parent 211 55.8% Native167 44.2% Foreign-born
Grandparents responsible for own grandchildren in Haledon
Grandparents (30 to 59 years) White / Caucasian 13 100.0% Not responsible for grandchildrenBlack or African American 19 100.0% Not responsible for grandchildrenHispanic or Latino 37 100.0% Not responsible for grandchildrenGrandparents (60 years and over) White / Caucasian 48 47.6% Responsible for grandchildren53 52.4% Not responsible for grandchildrenHispanic or Latino 43 16.1% Responsible for grandchildren223 83.9% Not responsible for grandchildren