Races in Hardwick, Vermont (VT) Detailed Stats
Ancestries, Foreign-born residents, place of birth
Data:
1.4% of Hardwick, VT residents are foreign-born , which is 176.0% less than the foreign-born rate of 4.0% across the entire state of Vermont.
Race distribution in Hardwick

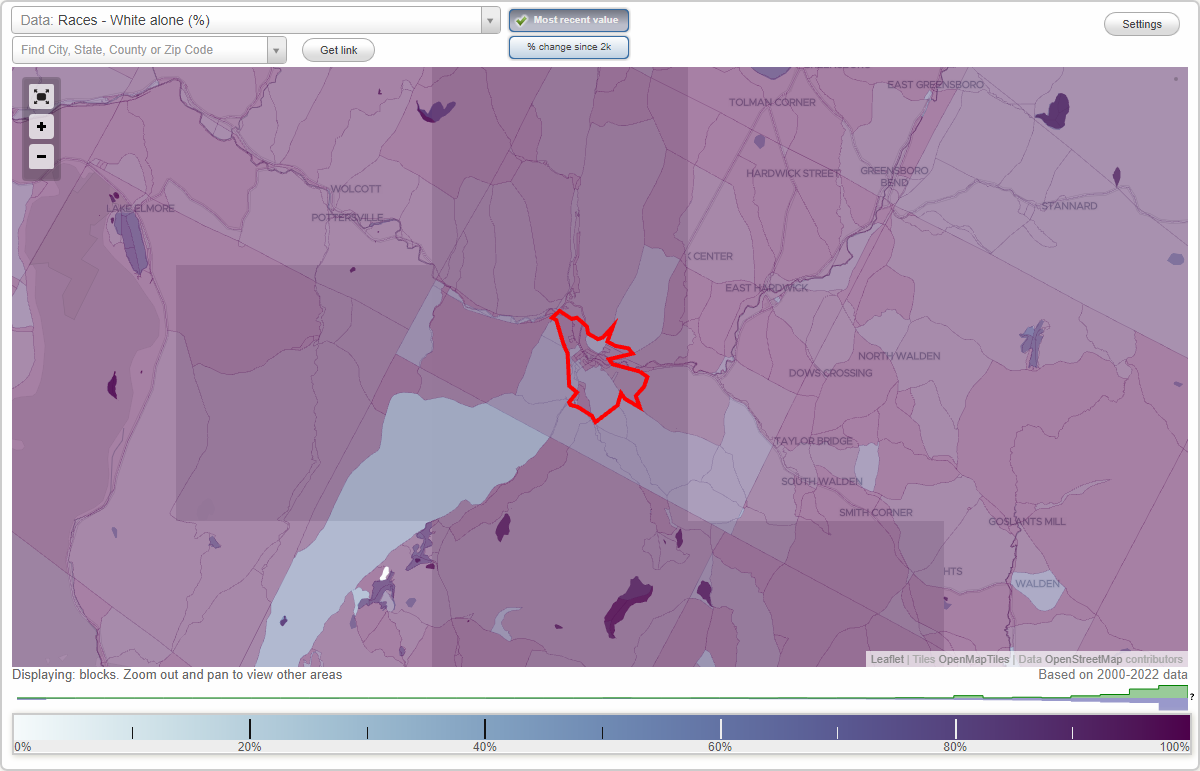
- 3,09997.6%White alone
- 280.9%Two or more races
- 260.8%American Indian alone
- 130.4%Hispanic
- 30.09%Asian alone
- 30.09%Other race alone
- 20.06%Black alone
2000
2022
-
- 585,43196.2%White alone
- 6,8091.1%Two or more races
- 5,5040.9%Hispanic
- 5,1600.8%Asian alone
- 2,9210.5%Black alone
- 2,3250.4%American Indian alone
- 5570.09%Other race alone
- 1200.02%Native Hawaiian and Other
Pacific Islander alone
-
- 583,54690.2%White alone
- 27,3404.2%Two or more races
- 14,7702.3%Hispanic
- 11,5121.8%Asian alone
- 6,2641.0%Black alone
- 2,5210.4%Other race alone
- 1,0520.2%American Indian alone
- 590.01%Native Hawaiian and Other
Pacific Islander alone
Income and house value in Hardwick
- Median household income in 2022
- $61,017White non-Hispanic householders
- $43,336American Indian and Alaska Native householders
- $4,465Asian householders
- $75,805Two or more races householders
- $40,018Hispanic or Latino race householders
- Median 2022 house value
- $184,585White Non-Hispanic householders
- $167,337American Indian or Alaska Native householders
- $193,081Hispanic or Latino householders
Foreign-born residents in Hardwick
46 residents are foreign born
| This city: | 1.4% |
| Vermont: | 3.8% |
Ancestries in Hardwick

- 90823.5%French
- 71018.4%English
- 57214.8%Irish
- 41110.7%Other
- 3328.6%United States
- 2205.7%French Canadian
- 1744.5%Scottish
- 1704.4%German
- 862.2%Italian
- 601.6%Polish
- 541.4%Scotch-Irish
- 401.0%Dutch
- 391.0%Swedish
- 260.7%Portuguese
- 120.3%Greek
- 120.3%Hungarian
- 120.3%Norwegian
- 90.2%Russian
- 70.2%Welsh
- 20.05%Danish
- 20.05%Swiss


