Races in Hawley-Noodle, Texas (TX) Detailed Stats
Ancestries, Foreign-born residents, place of birth
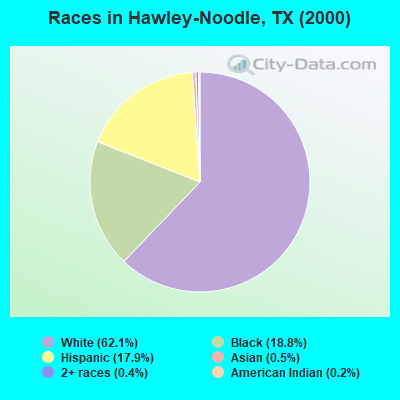
Race distribution in Hawley-Noodle

- 6,05962.1%White alone
- 1,83618.8%Black alone
- 1,75217.9%Hispanic
- 490.5%Asian alone
- 430.4%Two or more races
- 240.2%American Indian alone
2000
2022
-
- 10,933,31352.4%White alone
- 6,669,66632.0%Hispanic
- 2,364,25511.3%Black alone
- 554,4452.7%Asian alone
- 230,5671.1%Two or more races
- 68,8590.3%American Indian alone
- 19,9580.10%Other race alone
- 10,7570.05%Native Hawaiian and Other
Pacific Islander alone

-
- 12,070,64240.2%Hispanic
- 11,683,43038.9%White alone
- 3,508,70611.7%Black alone
- 1,608,1735.4%Asian alone
- 956,5603.2%Two or more races
- 125,7630.4%Other race alone
- 47,0230.2%American Indian alone
- 29,2750.10%Native Hawaiian and Other
Pacific Islander alone

Income and house value in Hawley-Noodle
- Median household income in 2022
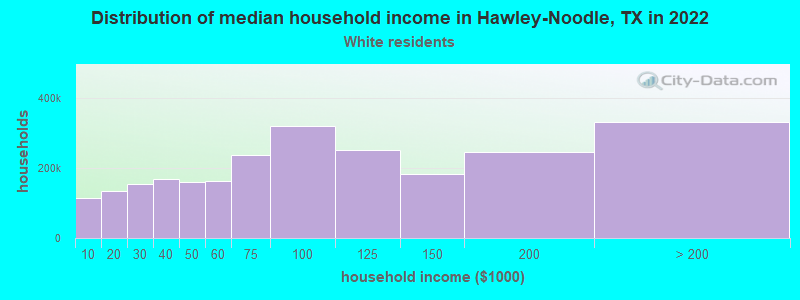
- $67,751White non-Hispanic householders
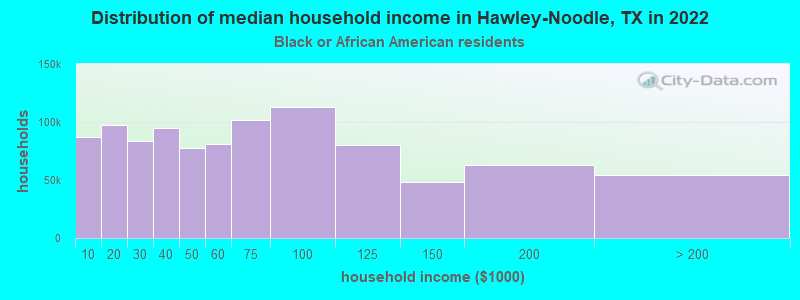
- $97,614Black householders
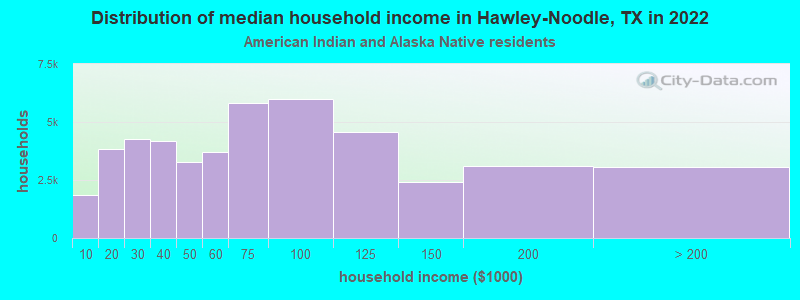
- $77,991American Indian and Alaska Native householders
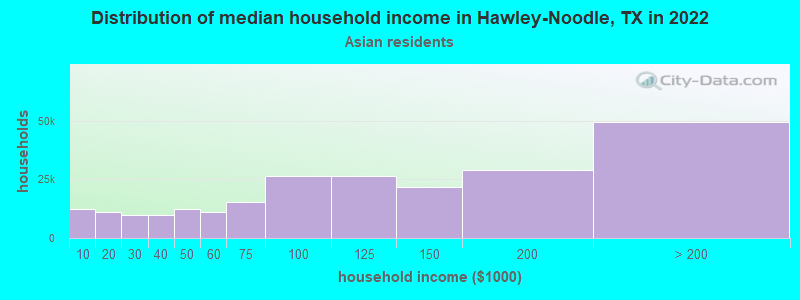
- $80,968Asian householders
- $79,637Native Hawaiian and other Pacific Islander householders
- $82,973Some other race householders
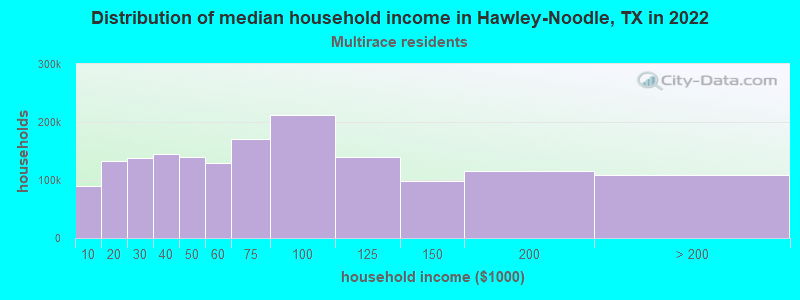
- $98,264Two or more races householders
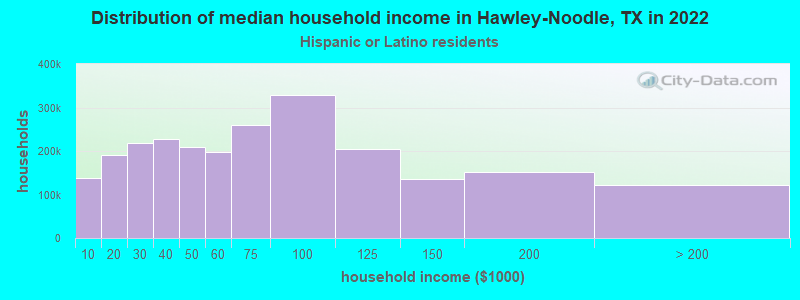
- $86,282Hispanic or Latino race householders
- Median 2022 house value
- $131,320White Non-Hispanic householders
- $103,673Black or African American householders
- $103,673American Indian or Alaska Native householders
- $71,327Some other race householders
- $103,673Two or more races householders
- $82,938Hispanic or Latino householders
Household income for White non-Hispanic householders
Household income for Black householders
Household income for American Indian and Alaska Native householders
Household income for Asian householders
Household income for Native Hawaiian and other Pacific Islander householders

Household income for Two or more races householders
Household income for Hispanic or Latino race householders
Zip code: 79525