Races in Heavener, Oklahoma (OK) Detailed Stats
Data:
Races - White alone (%)
Races - White alone (% change since 2000)
Races - Black alone (%)
Races - Black alone (% change since 2000)
Races - American Indian alone (%)
Races - American Indian alone (% change since 2000)
Races - Asian alone (%)
Races - Asian alone (% change since 2000)
Races - Hispanic (%)
Races - Hispanic (% change since 2000)
Races - Native Hawaiian and Other Pacific Islander alone (%)
Races - Native Hawaiian and Other Pacific Islander alone (% change since 2000)
Races - Two or more races(%)
Races - Two or more races(% change since 2000)
Races - Other race alone (%)
Races - Other race alone (% change since 2000)
Racial diversity
Place of birth - Born in state of residence (%)
Place of birth - Born in state of residence (%) - White
Place of birth - Born in state of residence (%) - Black or African American
Place of birth - Born in state of residence (%) - Asian
Place of birth - Born in state of residence (%) - Hispanic or Latino
Place of birth - Born in state of residence (%) - American Indian and Alaska Native
Place of birth - Born in state of residence (%) - Multirace
Place of birth - Born in state of residence (%) - Other Race
Place of birth - Born in other state (%)
Place of birth - Born in other state (%) - White
Place of birth - Born in other state (%) - Black or African American
Place of birth - Born in other state (%) - Asian
Place of birth - Born in other state (%) - Hispanic or Latino
Place of birth - Born in other state (%) - American Indian and Alaska Native
Place of birth - Born in other state (%) - Multirace
Place of birth - Born in other state (%) - Other Race
Place of birth - Native, outside of US (%)
Place of birth - Native, outside of US (%) - White
Place of birth - Native, outside of US (%) - Black or African American
Place of birth - Native, outside of US (%) - Asian
Place of birth - Native, outside of US (%) - Hispanic or Latino
Place of birth - Native, outside of US (%) - American Indian and Alaska Native
Place of birth - Native, outside of US (%) - Multirace
Place of birth - Native, outside of US (%) - Other Race
Place of birth - Foreign born (%)
Place of birth - Foreign born (%) - White
Place of birth - Foreign born (%) - Black or African American
Place of birth - Foreign born (%) - Asian
Place of birth - Foreign born (%) - Hispanic or Latino
Place of birth - Foreign born (%) - American Indian and Alaska Native
Place of birth - Foreign born (%) - Multirace
Place of birth - Foreign born (%) - Other Race
Residents speaking English at home (%)
Residents speaking English at home - Born in the United States (%)
Residents speaking English at home - Native, born elsewhere (%)
Residents speaking English at home - Foreign born (%)
Residents speaking Spanish at home (%)
Residents speaking Spanish at home - Born in the United States (%)
Residents speaking Spanish at home - Native, born elsewhere (%)
Residents speaking Spanish at home - Foreign born (%)
Residents speaking other language at home (%)
Residents speaking other language at home - Born in the United States (%)
Residents speaking other language at home - Native, born elsewhere (%)
Residents speaking other language at home - Foreign born (%)
Marital status - Never married (%)
Marital status - Now married (%)
Marital status - Separated (%)
Marital status - Widowed (%)
Marital status - Divorced (%)
Ancestries Reported - Arab (%)
Ancestries Reported - Czech (%)
Ancestries Reported - Danish (%)
Ancestries Reported - Dutch (%)
Ancestries Reported - English (%)
Ancestries Reported - French (%)
Ancestries Reported - French Canadian (%)
Ancestries Reported - German (%)
Ancestries Reported - Greek (%)
Ancestries Reported - Hungarian (%)
Ancestries Reported - Irish (%)
Ancestries Reported - Italian (%)
Ancestries Reported - Lithuanian (%)
Ancestries Reported - Norwegian (%)
Ancestries Reported - Polish (%)
Ancestries Reported - Portuguese (%)
Ancestries Reported - Russian (%)
Ancestries Reported - Scotch-Irish (%)
Ancestries Reported - Scottish (%)
Ancestries Reported - Slovak (%)
Ancestries Reported - Subsaharan African (%)
Ancestries Reported - Swedish (%)
Ancestries Reported - Swiss (%)
Ancestries Reported - Ukrainian (%)
Ancestries Reported - United States (%)
Ancestries Reported - Welsh (%)
Ancestries Reported - West Indian (%)
Ancestries Reported - Other (%)
Geographical mobility - Same house 1 year ago (%)
Geographical mobility - Same house 1 year ago (%) - White
Geographical mobility - Same house 1 year ago (%) - Black or African American
Geographical mobility - Same house 1 year ago (%) - Asian
Geographical mobility - Same house 1 year ago (%) - Hispanic or Latino
Geographical mobility - Same house 1 year ago (%) - American Indian and Alaska Native
Geographical mobility - Same house 1 year ago (%) - Multirace
Geographical mobility - Same house 1 year ago (%) - Other Race
Geographical mobility - Moved within same county (%)
Geographical mobility - Moved within same county (%) - White
Geographical mobility - Moved within same county (%) - Black or African American
Geographical mobility - Moved within same county (%) - Asian
Geographical mobility - Moved within same county (%) - Hispanic or Latino
Geographical mobility - Moved within same county (%) - American Indian and Alaska Native
Geographical mobility - Moved within same county (%) - Multirace
Geographical mobility - Moved within same county (%) - Other Race
Geographical mobility - Moved from different county within same state (%)
Geographical mobility - Moved from different county within same state (%) - White
Geographical mobility - Moved from different county within same state (%) - Black or African American
Geographical mobility - Moved from different county within same state (%) - Asian
Geographical mobility - Moved from different county within same state (%) - Hispanic or Latino
Geographical mobility - Moved from different county within same state (%) - American Indian and Alaska Native
Geographical mobility - Moved from different county within same state (%) - Multirace
Geographical mobility - Moved from different county within same state (%) - Other Race
Geographical mobility - Moved from different state (%)
Geographical mobility - Moved from different state (%) - White
Geographical mobility - Moved from different state (%) - Black or African American
Geographical mobility - Moved from different state (%) - Asian
Geographical mobility - Moved from different state (%) - Hispanic or Latino
Geographical mobility - Moved from different state (%) - American Indian and Alaska Native
Geographical mobility - Moved from different state (%) - Multirace
Geographical mobility - Moved from different state (%) - Other Race
Geographical mobility - Moved from abroad (%)
Geographical mobility - Moved from abroad (%) - White
Geographical mobility - Moved from abroad (%) - Black or African American
Geographical mobility - Moved from abroad (%) - Asian
Geographical mobility - Moved from abroad (%) - Hispanic or Latino
Geographical mobility - Moved from abroad (%) - American Indian and Alaska Native
Geographical mobility - Moved from abroad (%) - Multirace
Geographical mobility - Moved from abroad (%) - Other Race
Place of birth for the foreign-born population - Ireland (%)
Place of birth for the foreign-born population - Denmark (%)
Place of birth for the foreign-born population - Norway (%)
Place of birth for the foreign-born population - Sweden (%)
Place of birth for the foreign-born population - United Kingdom (%)
Place of birth for the foreign-born population - England (%)
Place of birth for the foreign-born population - Scotland (%)
Place of birth for the foreign-born population - Other Northern Europe (%)
Place of birth for the foreign-born population - Austria (%)
Place of birth for the foreign-born population - Belgium (%)
Place of birth for the foreign-born population - France (%)
Place of birth for the foreign-born population - Germany (%)
Place of birth for the foreign-born population - Netherlands (%)
Place of birth for the foreign-born population - Switzerland (%)
Place of birth for the foreign-born population - Other Western Europe (%)
Place of birth for the foreign-born population - Greece (%)
Place of birth for the foreign-born population - Italy (%)
Place of birth for the foreign-born population - Portugal (%)
Place of birth for the foreign-born population - Spain (%)
Place of birth for the foreign-born population - Other Southern Europe (%)
Place of birth for the foreign-born population - Albania (%)
Place of birth for the foreign-born population - Belarus (%)
Place of birth for the foreign-born population - Bosnia and Herzegovina (%)
Place of birth for the foreign-born population - Bulgaria (%)
Place of birth for the foreign-born population - Croatia (%)
Place of birth for the foreign-born population - Czechoslovakia (%)
Place of birth for the foreign-born population - Hungary (%)
Place of birth for the foreign-born population - Latvia (%)
Place of birth for the foreign-born population - Lithuania (%)
Place of birth for the foreign-born population - North Macedonia (Macedonia) (%)
Place of birth for the foreign-born population - Moldova (%)
Place of birth for the foreign-born population - Poland (%)
Place of birth for the foreign-born population - Romania (%)
Place of birth for the foreign-born population - Russia (%)
Place of birth for the foreign-born population - Serbia (%)
Place of birth for the foreign-born population - Ukraine (%)
Place of birth for the foreign-born population - Other Eastern Europe (%)
Place of birth for the foreign-born population - China (%)
Place of birth for the foreign-born population - Hong Kong (%)
Place of birth for the foreign-born population - Taiwan (%)
Place of birth for the foreign-born population - Japan (%)
Place of birth for the foreign-born population - Korea (%)
Place of birth for the foreign-born population - Other Eastern Asia (%)
Place of birth for the foreign-born population - Afghanistan (%)
Place of birth for the foreign-born population - Bangladesh (%)
Place of birth for the foreign-born population - India (%)
Place of birth for the foreign-born population - Iran (%)
Place of birth for the foreign-born population - Kazakhstan (%)
Place of birth for the foreign-born population - Nepal (%)
Place of birth for the foreign-born population - Pakistan (%)
Place of birth for the foreign-born population - Sri Lanka (%)
Place of birth for the foreign-born population - Uzbekistan (%)
Place of birth for the foreign-born population - Other South Central Asia (%)
Place of birth for the foreign-born population - Burma (%)
Place of birth for the foreign-born population - Cambodia (%)
Place of birth for the foreign-born population - Indonesia (%)
Place of birth for the foreign-born population - Laos (%)
Place of birth for the foreign-born population - Malaysia (%)
Place of birth for the foreign-born population - Philippines (%)
Place of birth for the foreign-born population - Singapore (%)
Place of birth for the foreign-born population - Thailand (%)
Place of birth for the foreign-born population - Vietnam (%)
Place of birth for the foreign-born population - Other South Eastern Asia (%)
Place of birth for the foreign-born population - Armenia (%)
Place of birth for the foreign-born population - Iraq (%)
Place of birth for the foreign-born population - Israel (%)
Place of birth for the foreign-born population - Jordan (%)
Place of birth for the foreign-born population - Kuwait (%)
Place of birth for the foreign-born population - Lebanon (%)
Place of birth for the foreign-born population - Saudi Arabia (%)
Place of birth for the foreign-born population - Syria (%)
Place of birth for the foreign-born population - Turkey (%)
Place of birth for the foreign-born population - Yemen (%)
Place of birth for the foreign-born population - Other Western Asia (%)
Place of birth for the foreign-born population - Eritrea (%)
Place of birth for the foreign-born population - Ethiopia (%)
Place of birth for the foreign-born population - Kenya (%)
Place of birth for the foreign-born population - Somalia (%)
Place of birth for the foreign-born population - Uganda (%)
Place of birth for the foreign-born population - Zimbabwe (%)
Place of birth for the foreign-born population - Other Eastern Africa (%)
Place of birth for the foreign-born population - Cameroon (%)
Place of birth for the foreign-born population - Congo (%)
Place of birth for the foreign-born population - Democratic Republic of Congo (Zaire) (%)
Place of birth for the foreign-born population - Other Middle Africa (%)
Place of birth for the foreign-born population - Egypt (%)
Place of birth for the foreign-born population - Morocco (%)
Place of birth for the foreign-born population - Sudan (%)
Place of birth for the foreign-born population - Other Northern Africa (%)
Place of birth for the foreign-born population - South Africa (%)
Place of birth for the foreign-born population - Other Southern Africa (%)
Place of birth for the foreign-born population - Cabo Verde (%)
Place of birth for the foreign-born population - Ghana (%)
Place of birth for the foreign-born population - Liberia (%)
Place of birth for the foreign-born population - Nigeria (%)
Place of birth for the foreign-born population - Senegal (%)
Place of birth for the foreign-born population - Sierra Leone (%)
Place of birth for the foreign-born population - Other Western Africa (%)
Place of birth for the foreign-born population - Australia (%)
Place of birth for the foreign-born population - New Zealand (%)
Place of birth for the foreign-born population - Fiji (%)
Place of birth for the foreign-born population - Micronesia (%)
Place of birth for the foreign-born population - Bahamas (%)
Place of birth for the foreign-born population - Barbados (%)
Place of birth for the foreign-born population - Cuba (%)
Place of birth for the foreign-born population - Dominica (%)
Place of birth for the foreign-born population - Dominican Republic (%)
Place of birth for the foreign-born population - Grenada (%)
Place of birth for the foreign-born population - Haiti (%)
Place of birth for the foreign-born population - Jamaica (%)
Place of birth for the foreign-born population - St. Vincent and the Grenadines (%)
Place of birth for the foreign-born population - Trinidad and Tobago (%)
Place of birth for the foreign-born population - West Indies (%)
Place of birth for the foreign-born population - Other Caribbean (%)
Place of birth for the foreign-born population - Belize (%)
Place of birth for the foreign-born population - Costa Rica (%)
Place of birth for the foreign-born population - El Salvador (%)
Place of birth for the foreign-born population - Guatemala (%)
Place of birth for the foreign-born population - Honduras (%)
Place of birth for the foreign-born population - Mexico (%)
Place of birth for the foreign-born population - Nicaragua (%)
Place of birth for the foreign-born population - Panama (%)
Place of birth for the foreign-born population - Other Central America (%)
Place of birth for the foreign-born population - Argentina (%)
Place of birth for the foreign-born population - Bolivia (%)
Place of birth for the foreign-born population - Brazil (%)
Place of birth for the foreign-born population - Chile (%)
Place of birth for the foreign-born population - Colombia (%)
Place of birth for the foreign-born population - Ecuador (%)
Place of birth for the foreign-born population - Guyana (%)
Place of birth for the foreign-born population - Peru (%)
Place of birth for the foreign-born population - Uruguay (%)
Place of birth for the foreign-born population - Venezuela (%)
Place of birth for the foreign-born population - Other South America (%)
Place of birth for the foreign-born population - Canada (%)
Place of birth for the foreign-born population - Other Northern America (%)
Place of birth for the foreign-born population - Other (%)
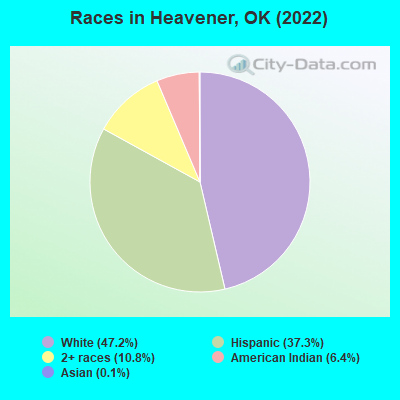
According to 2022 data, the most numerous races in Heavener, OK are White alone (1,438 residents), Hispanic (1,137 residents), and Two or more races (330 residents). 69.8% of Heavener residents speak English at home. 14.3% of Heavener, OK residents are foreign-born (14.5% born in Latin America), which is 58.1% greater than the foreign-born rate of 6.0% across the entire state of Oklahoma.
Race distribution in Heavener
2000 2022
2,556,368 74.1% White alone 266,158 7.7% American Indian alone 257,981 7.5% Black alone 179,304 5.2% Hispanic 140,249 4.1% Two or more races 46,172 1.3% Asian alone 2,322 0.07% Other race alone 2,100 0.06% Native Hawaiian and Other
2,517,403 62.6% White alone 486,692 12.1% Hispanic 364,453 9.1% Two or more races 273,650 6.8% American Indian alone 268,543 6.7% Black alone 92,672 2.3% Asian alone 10,786 0.3% Other race alone 5,601 0.1% Native Hawaiian and Other
Income and house value in Heavener Median household income in 2022 $39,722 White non-Hispanic householders$28,806 American Indian and Alaska Native householders$46,881 Some other race householders$35,276 Two or more races householders$35,432 Hispanic or Latino race householdersMedian 2022 house value $67,369 White Non-Hispanic householders$69,558 American Indian or Alaska Native householders$50,800 Some other race householders$40,328 Two or more races householders$54,708 Hispanic or Latino householders
Median age by race in Heavener
40.4 Median age for White residents34.6 44.1 5.0 Median age for Black or African American residents-700,315,456.7 4.6 40.6 Median age for American Indian / Alaska Native residents50.0 34.4 -662,745,097.4 Median age for Asian residents-662,601,625.4 -666,666,666.0 -725,225,224.5 Median age for Native Hawaiian / Pacific Islander residents-675,324,674.6 -767,251,461.2 22.0 Median age for Other race residents23.7 20.6 30.3 Median age for Two or more races residents28.1 36.1 43.0 Median age for White alone residents40.9 49.9 22.0 Median age for Hispanic or Latino residents23.5 19.8
Owner/renter occupied households by race in Heavener
House owners and renters - White residents 404 72.0% Owner occupied157 28.0% Renter occupiedHouse owners and renters - Black or African American residents 6 100.0% Renter occupiedHouse owners and renters - American Indian / Alaska Native residents 26 29.2% Owner occupied63 70.8% Renter occupiedHouse owners and renters - Other race residents 105 59.3% Owner occupied72 40.7% Renter occupiedHouse owners and renters - Two or more races residents 95 53.2% Owner occupied84 46.8% Renter occupiedHouse owners and renters - White alone residents 391 73.3% Owner occupied142 26.7% Renter occupiedHouse owners and renters - Hispanic or Latino residents 135 51.1% Owner occupied129 48.9% Renter occupied
Language usage in Heavener
English speakers - Total 69.8% of residents of Heavener speak English at home.
30.6% of residents speak Spanish at home 359 42.6% Speak English very well484 57.4% Speak English less than very well0.3% of residents speak other language at home 9 100.0% Speak English less than very well
English speakers - Born in the United States 85.1% of residents of Heavener speak English at home.
16.0% of residents speak Spanish at home 105 56.5% Speak English very well81 43.5% Speak English less than very well
English speakers - Native, born elsewhere 16.1% of residents of Heavener speak English at home.
93.5% of residents speak Spanish at home 7 24.1% Speak English very well22 75.9% Speak English less than very well
English speakers - Foreign-born 4.3% of residents of Heavener speak English at home.
95.0% of residents speak Spanish at home 85 20.5% Speak English very well330 79.5% Speak English less than very well2.1% of residents speak other language at home 9 100.0% Speak English less than very well
White (Caucasian) - Speak another language Native:
4.4% (62)Foreign-born:
83.5% (44)
Other race - Speak only English Native:
20.1% (68)Foreign-born:
7.2% (24)
Other race - Speak another language Native:
81.6% (278)Foreign-born:
92.8% (308)
Two or more races - Speak another language Native:
25.5% (111)Foreign-born:
100.0% (113)
Hispanic or Latino - Speak only English Native:
27.1% (146)Foreign-born:
5.0% (23)
Hispanic or Latino - Speak another language Native:
72.1% (388)Foreign-born:
94.8% (429)
Foreign-born residents in Heavener 437 residents are foreign born (14.5% Latin America ).
This city:
14.3%Oklahoma:
6.1%
Marital status for residents in Heavener Marital status - White (Caucasian) population 15 years and over
Males 40.3% Never married41.6% Now married1.3% Separated4.6% Widowed12.2% DivorcedFemales 23.9% Never married35.2% Now married3.6% Separated19.3% Widowed17.9% DivorcedWomen who gave birth in the past 12 months Now married:
73.7% (27)Unmarried:
26.3% (10)
Women who did not give birth in the past 12 months Now married:
42.0% (115)Unmarried:
58.0% (158)
Marital status - Black or African American population 15 years and over
Males 0.0% Never married0.0% Now married0.0% Separated0.0% Widowed100.0% DivorcedFemales 0.0% Never married100.0% Now married0.0% Separated0.0% Widowed0.0% DivorcedWomen who did not give birth in the past 12 months Now married:
93.9% (1)Unmarried:
0.0% (0)
Marital status - American Indian / Alaska Native population 15 years and over
Males 16.7% Never married43.1% Now married5.6% Separated0.0% Widowed34.7% DivorcedFemales 31.9% Never married37.4% Now married0.0% Separated15.4% Widowed15.4% DivorcedWomen who did not give birth in the past 12 months Now married:
37.7% (27)Unmarried:
62.3% (44)
Marital status - Other race population 15 years and over
Males 49.0% Never married45.1% Now married0.0% Separated0.0% Widowed5.8% DivorcedFemales 42.5% Never married51.4% Now married1.7% Separated0.0% Widowed4.5% DivorcedWomen who did not give birth in the past 12 months Now married:
45.8% (77)Unmarried:
54.2% (91)
Marital status - Two or more races population 15 years and over
Males 50.0% Never married34.7% Now married0.0% Separated0.0% Widowed15.3% DivorcedFemales 28.0% Never married37.8% Now married5.5% Separated4.9% Widowed23.8% DivorcedWomen who did not give birth in the past 12 months Now married:
35.1% (61)Unmarried:
64.9% (113)
Marital status - White alone, not Hispanic / Latino population 15 years and over
Males 32.7% Never married45.2% Now married1.5% Separated5.6% Widowed15.0% DivorcedFemales 24.0% Never married33.3% Now married3.8% Separated20.5% Widowed18.3% DivorcedWomen who gave birth in the past 12 months Now married:
66.7% (20)Unmarried:
33.3% (10)
Women who did not give birth in the past 12 months Now married:
40.0% (100)Unmarried:
60.0% (150)
Marital status - Hispanic or Latino population 15 years and over
Males 54.3% Never married39.3% Now married0.0% Separated0.0% Widowed6.4% DivorcedFemales 37.7% Never married52.7% Now married4.6% Separated0.0% Widowed5.0% DivorcedWomen who gave birth in the past 12 months Now married:
100.0% (9)Unmarried:
0.0% (0)
Women who did not give birth in the past 12 months Now married:
49.5% (113)Unmarried:
50.5% (115)
Ancestries in Heavener
514 26.7% English101 5.2% German89 4.6% Irish45 2.3% American35 1.8% Scottish7 0.4% Italian5 0.3% French4 0.2% Eastern European
Children Nativity (place of birth) in Heavener
Children under 6 years - Living with two parents Both parents native 89 100.0% NativeBoth parents foreign-born 48 100.0% NativeOne native, one foreign-born parent 17 100.0% NativeChildren under 6 years - Living with one parent Native parent 112 100.0% NativeForeign-born parent 51 100.0% NativeChildren 6 to 17 years - Living with two parents Both parents native 194 99.9% Native0 0.1% Foreign-bornBoth parents foreign-born 91 95.0% Native5 5.0% Foreign-bornOne native, one foreign-born parent 38 100.0% NativeChildren 6 to 17 years - Living with one parent Native parent 99 100.0% NativeForeign-born parent 116 49.9% Native117 50.1% Foreign-born
Grandparents responsible for own grandchildren in Heavener
Grandparents (30 to 59 years) White / Caucasian 6 100.0% Responsible for grandchildrenTwo or more races 6 25.2% Responsible for grandchildren19 74.8% Not responsible for grandchildrenWhite alone, not Hispanic / Latino 6 100.0% Responsible for grandchildrenHispanic or Latino 9 100.0% Not responsible for grandchildren
Grandparents (60 years and over) White / Caucasian 8 100.0% Responsible for grandchildrenTwo or more races 15 100.0% Not responsible for grandchildrenWhite alone, not Hispanic / Latino 8 100.0% Responsible for grandchildrenHispanic or Latino 23 100.0% Not responsible for grandchildren