Races in Hempstead, New York (NY) Detailed Stats
Data:
Races - White alone (%)
Races - White alone (% change since 2000)
Races - Black alone (%)
Races - Black alone (% change since 2000)
Races - American Indian alone (%)
Races - American Indian alone (% change since 2000)
Races - Asian alone (%)
Races - Asian alone (% change since 2000)
Races - Hispanic (%)
Races - Hispanic (% change since 2000)
Races - Native Hawaiian and Other Pacific Islander alone (%)
Races - Native Hawaiian and Other Pacific Islander alone (% change since 2000)
Races - Two or more races(%)
Races - Two or more races(% change since 2000)
Races - Other race alone (%)
Races - Other race alone (% change since 2000)
Racial diversity
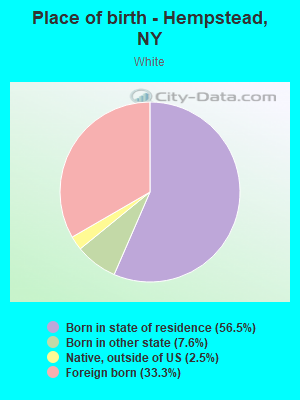
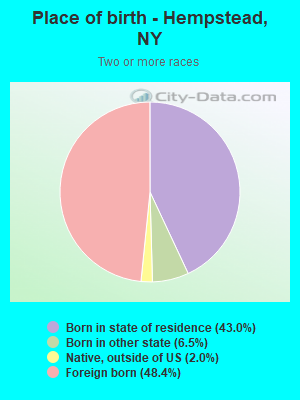
Place of birth - Born in state of residence (%)
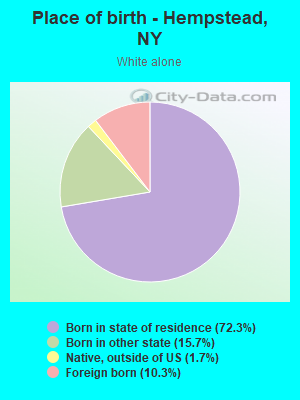
Place of birth - Born in state of residence (%) - White
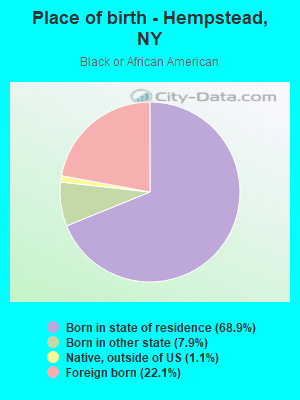
Place of birth - Born in state of residence (%) - Black or African American
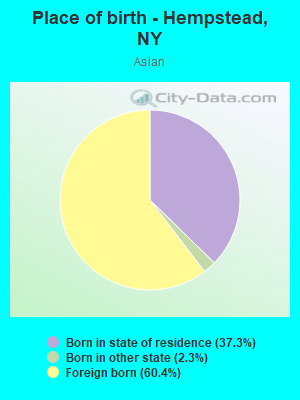
Place of birth - Born in state of residence (%) - Asian
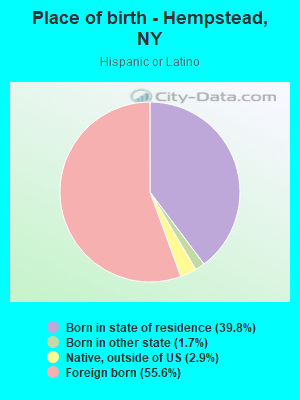
Place of birth - Born in state of residence (%) - Hispanic or Latino
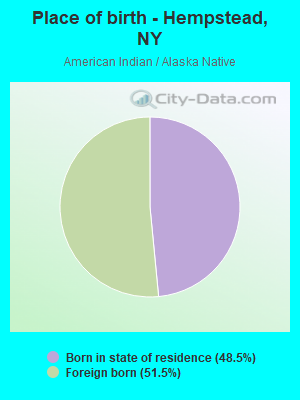
Place of birth - Born in state of residence (%) - American Indian and Alaska Native
Place of birth - Born in state of residence (%) - Multirace
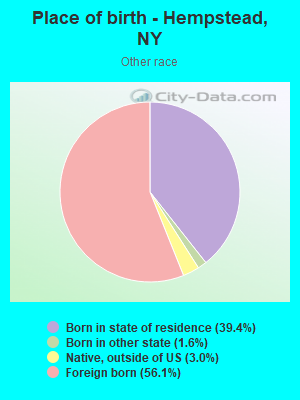
Place of birth - Born in state of residence (%) - Other Race
Place of birth - Born in other state (%)
Place of birth - Born in other state (%) - White
Place of birth - Born in other state (%) - Black or African American
Place of birth - Born in other state (%) - Asian
Place of birth - Born in other state (%) - Hispanic or Latino
Place of birth - Born in other state (%) - American Indian and Alaska Native
Place of birth - Born in other state (%) - Multirace
Place of birth - Born in other state (%) - Other Race
Place of birth - Native, outside of US (%)
Place of birth - Native, outside of US (%) - White
Place of birth - Native, outside of US (%) - Black or African American
Place of birth - Native, outside of US (%) - Asian
Place of birth - Native, outside of US (%) - Hispanic or Latino
Place of birth - Native, outside of US (%) - American Indian and Alaska Native
Place of birth - Native, outside of US (%) - Multirace
Place of birth - Native, outside of US (%) - Other Race
Place of birth - Foreign born (%)
Place of birth - Foreign born (%) - White
Place of birth - Foreign born (%) - Black or African American
Place of birth - Foreign born (%) - Asian
Place of birth - Foreign born (%) - Hispanic or Latino
Place of birth - Foreign born (%) - American Indian and Alaska Native
Place of birth - Foreign born (%) - Multirace
Place of birth - Foreign born (%) - Other Race
Residents speaking English at home (%)
Residents speaking English at home - Born in the United States (%)
Residents speaking English at home - Native, born elsewhere (%)
Residents speaking English at home - Foreign born (%)
Residents speaking Spanish at home (%)
Residents speaking Spanish at home - Born in the United States (%)
Residents speaking Spanish at home - Native, born elsewhere (%)
Residents speaking Spanish at home - Foreign born (%)
Residents speaking other language at home (%)
Residents speaking other language at home - Born in the United States (%)
Residents speaking other language at home - Native, born elsewhere (%)
Residents speaking other language at home - Foreign born (%)
Marital status - Never married (%)
Marital status - Now married (%)
Marital status - Separated (%)
Marital status - Widowed (%)
Marital status - Divorced (%)
Ancestries Reported - Arab (%)
Ancestries Reported - Czech (%)
Ancestries Reported - Danish (%)
Ancestries Reported - Dutch (%)
Ancestries Reported - English (%)
Ancestries Reported - French (%)
Ancestries Reported - French Canadian (%)
Ancestries Reported - German (%)
Ancestries Reported - Greek (%)
Ancestries Reported - Hungarian (%)
Ancestries Reported - Irish (%)
Ancestries Reported - Italian (%)
Ancestries Reported - Lithuanian (%)
Ancestries Reported - Norwegian (%)
Ancestries Reported - Polish (%)
Ancestries Reported - Portuguese (%)
Ancestries Reported - Russian (%)
Ancestries Reported - Scotch-Irish (%)
Ancestries Reported - Scottish (%)
Ancestries Reported - Slovak (%)
Ancestries Reported - Subsaharan African (%)
Ancestries Reported - Swedish (%)
Ancestries Reported - Swiss (%)
Ancestries Reported - Ukrainian (%)
Ancestries Reported - United States (%)
Ancestries Reported - Welsh (%)
Ancestries Reported - West Indian (%)
Ancestries Reported - Other (%)
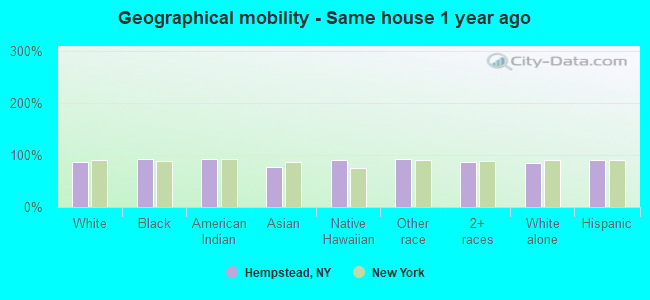
Geographical mobility - Same house 1 year ago (%)
Geographical mobility - Same house 1 year ago (%) - White
Geographical mobility - Same house 1 year ago (%) - Black or African American
Geographical mobility - Same house 1 year ago (%) - Asian
Geographical mobility - Same house 1 year ago (%) - Hispanic or Latino
Geographical mobility - Same house 1 year ago (%) - American Indian and Alaska Native
Geographical mobility - Same house 1 year ago (%) - Multirace
Geographical mobility - Same house 1 year ago (%) - Other Race
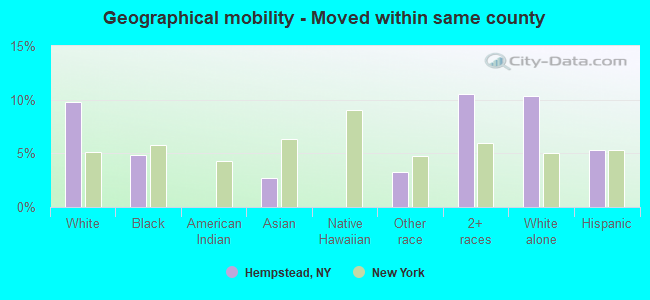
Geographical mobility - Moved within same county (%)
Geographical mobility - Moved within same county (%) - White
Geographical mobility - Moved within same county (%) - Black or African American
Geographical mobility - Moved within same county (%) - Asian
Geographical mobility - Moved within same county (%) - Hispanic or Latino
Geographical mobility - Moved within same county (%) - American Indian and Alaska Native
Geographical mobility - Moved within same county (%) - Multirace
Geographical mobility - Moved within same county (%) - Other Race
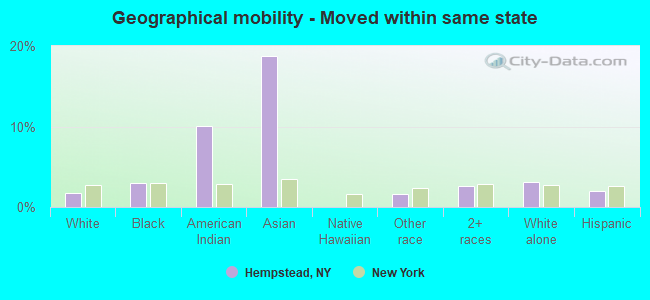
Geographical mobility - Moved from different county within same state (%)
Geographical mobility - Moved from different county within same state (%) - White
Geographical mobility - Moved from different county within same state (%) - Black or African American
Geographical mobility - Moved from different county within same state (%) - Asian
Geographical mobility - Moved from different county within same state (%) - Hispanic or Latino
Geographical mobility - Moved from different county within same state (%) - American Indian and Alaska Native
Geographical mobility - Moved from different county within same state (%) - Multirace
Geographical mobility - Moved from different county within same state (%) - Other Race
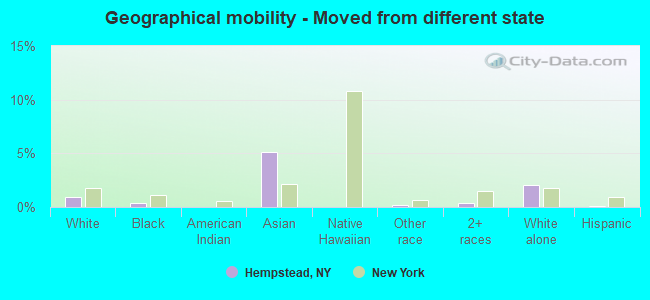
Geographical mobility - Moved from different state (%)
Geographical mobility - Moved from different state (%) - White
Geographical mobility - Moved from different state (%) - Black or African American
Geographical mobility - Moved from different state (%) - Asian
Geographical mobility - Moved from different state (%) - Hispanic or Latino
Geographical mobility - Moved from different state (%) - American Indian and Alaska Native
Geographical mobility - Moved from different state (%) - Multirace
Geographical mobility - Moved from different state (%) - Other Race
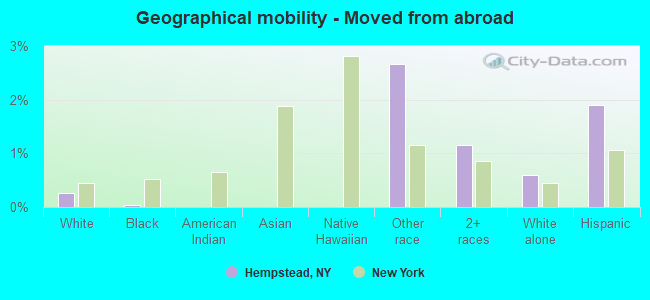
Geographical mobility - Moved from abroad (%)
Geographical mobility - Moved from abroad (%) - White
Geographical mobility - Moved from abroad (%) - Black or African American
Geographical mobility - Moved from abroad (%) - Asian
Geographical mobility - Moved from abroad (%) - Hispanic or Latino
Geographical mobility - Moved from abroad (%) - American Indian and Alaska Native
Geographical mobility - Moved from abroad (%) - Multirace
Geographical mobility - Moved from abroad (%) - Other Race
Place of birth for the foreign-born population - Ireland (%)
Place of birth for the foreign-born population - Denmark (%)
Place of birth for the foreign-born population - Norway (%)
Place of birth for the foreign-born population - Sweden (%)
Place of birth for the foreign-born population - United Kingdom (%)
Place of birth for the foreign-born population - England (%)
Place of birth for the foreign-born population - Scotland (%)
Place of birth for the foreign-born population - Other Northern Europe (%)
Place of birth for the foreign-born population - Austria (%)
Place of birth for the foreign-born population - Belgium (%)
Place of birth for the foreign-born population - France (%)
Place of birth for the foreign-born population - Germany (%)
Place of birth for the foreign-born population - Netherlands (%)
Place of birth for the foreign-born population - Switzerland (%)
Place of birth for the foreign-born population - Other Western Europe (%)
Place of birth for the foreign-born population - Greece (%)
Place of birth for the foreign-born population - Italy (%)
Place of birth for the foreign-born population - Portugal (%)
Place of birth for the foreign-born population - Spain (%)
Place of birth for the foreign-born population - Other Southern Europe (%)
Place of birth for the foreign-born population - Albania (%)
Place of birth for the foreign-born population - Belarus (%)
Place of birth for the foreign-born population - Bosnia and Herzegovina (%)
Place of birth for the foreign-born population - Bulgaria (%)
Place of birth for the foreign-born population - Croatia (%)
Place of birth for the foreign-born population - Czechoslovakia (%)
Place of birth for the foreign-born population - Hungary (%)
Place of birth for the foreign-born population - Latvia (%)
Place of birth for the foreign-born population - Lithuania (%)
Place of birth for the foreign-born population - North Macedonia (Macedonia) (%)
Place of birth for the foreign-born population - Moldova (%)
Place of birth for the foreign-born population - Poland (%)
Place of birth for the foreign-born population - Romania (%)
Place of birth for the foreign-born population - Russia (%)
Place of birth for the foreign-born population - Serbia (%)
Place of birth for the foreign-born population - Ukraine (%)
Place of birth for the foreign-born population - Other Eastern Europe (%)
Place of birth for the foreign-born population - China (%)
Place of birth for the foreign-born population - Hong Kong (%)
Place of birth for the foreign-born population - Taiwan (%)
Place of birth for the foreign-born population - Japan (%)
Place of birth for the foreign-born population - Korea (%)
Place of birth for the foreign-born population - Other Eastern Asia (%)
Place of birth for the foreign-born population - Afghanistan (%)
Place of birth for the foreign-born population - Bangladesh (%)
Place of birth for the foreign-born population - India (%)
Place of birth for the foreign-born population - Iran (%)
Place of birth for the foreign-born population - Kazakhstan (%)
Place of birth for the foreign-born population - Nepal (%)
Place of birth for the foreign-born population - Pakistan (%)
Place of birth for the foreign-born population - Sri Lanka (%)
Place of birth for the foreign-born population - Uzbekistan (%)
Place of birth for the foreign-born population - Other South Central Asia (%)
Place of birth for the foreign-born population - Burma (%)
Place of birth for the foreign-born population - Cambodia (%)
Place of birth for the foreign-born population - Indonesia (%)
Place of birth for the foreign-born population - Laos (%)
Place of birth for the foreign-born population - Malaysia (%)
Place of birth for the foreign-born population - Philippines (%)
Place of birth for the foreign-born population - Singapore (%)
Place of birth for the foreign-born population - Thailand (%)
Place of birth for the foreign-born population - Vietnam (%)
Place of birth for the foreign-born population - Other South Eastern Asia (%)
Place of birth for the foreign-born population - Armenia (%)
Place of birth for the foreign-born population - Iraq (%)
Place of birth for the foreign-born population - Israel (%)
Place of birth for the foreign-born population - Jordan (%)
Place of birth for the foreign-born population - Kuwait (%)
Place of birth for the foreign-born population - Lebanon (%)
Place of birth for the foreign-born population - Saudi Arabia (%)
Place of birth for the foreign-born population - Syria (%)
Place of birth for the foreign-born population - Turkey (%)
Place of birth for the foreign-born population - Yemen (%)
Place of birth for the foreign-born population - Other Western Asia (%)
Place of birth for the foreign-born population - Eritrea (%)
Place of birth for the foreign-born population - Ethiopia (%)
Place of birth for the foreign-born population - Kenya (%)
Place of birth for the foreign-born population - Somalia (%)
Place of birth for the foreign-born population - Uganda (%)
Place of birth for the foreign-born population - Zimbabwe (%)
Place of birth for the foreign-born population - Other Eastern Africa (%)
Place of birth for the foreign-born population - Cameroon (%)
Place of birth for the foreign-born population - Congo (%)
Place of birth for the foreign-born population - Democratic Republic of Congo (Zaire) (%)
Place of birth for the foreign-born population - Other Middle Africa (%)
Place of birth for the foreign-born population - Egypt (%)
Place of birth for the foreign-born population - Morocco (%)
Place of birth for the foreign-born population - Sudan (%)
Place of birth for the foreign-born population - Other Northern Africa (%)
Place of birth for the foreign-born population - South Africa (%)
Place of birth for the foreign-born population - Other Southern Africa (%)
Place of birth for the foreign-born population - Cabo Verde (%)
Place of birth for the foreign-born population - Ghana (%)
Place of birth for the foreign-born population - Liberia (%)
Place of birth for the foreign-born population - Nigeria (%)
Place of birth for the foreign-born population - Senegal (%)
Place of birth for the foreign-born population - Sierra Leone (%)
Place of birth for the foreign-born population - Other Western Africa (%)
Place of birth for the foreign-born population - Australia (%)
Place of birth for the foreign-born population - New Zealand (%)
Place of birth for the foreign-born population - Fiji (%)
Place of birth for the foreign-born population - Micronesia (%)
Place of birth for the foreign-born population - Bahamas (%)
Place of birth for the foreign-born population - Barbados (%)
Place of birth for the foreign-born population - Cuba (%)
Place of birth for the foreign-born population - Dominica (%)
Place of birth for the foreign-born population - Dominican Republic (%)
Place of birth for the foreign-born population - Grenada (%)
Place of birth for the foreign-born population - Haiti (%)
Place of birth for the foreign-born population - Jamaica (%)
Place of birth for the foreign-born population - St. Vincent and the Grenadines (%)
Place of birth for the foreign-born population - Trinidad and Tobago (%)
Place of birth for the foreign-born population - West Indies (%)
Place of birth for the foreign-born population - Other Caribbean (%)
Place of birth for the foreign-born population - Belize (%)
Place of birth for the foreign-born population - Costa Rica (%)
Place of birth for the foreign-born population - El Salvador (%)
Place of birth for the foreign-born population - Guatemala (%)
Place of birth for the foreign-born population - Honduras (%)
Place of birth for the foreign-born population - Mexico (%)
Place of birth for the foreign-born population - Nicaragua (%)
Place of birth for the foreign-born population - Panama (%)
Place of birth for the foreign-born population - Other Central America (%)
Place of birth for the foreign-born population - Argentina (%)
Place of birth for the foreign-born population - Bolivia (%)
Place of birth for the foreign-born population - Brazil (%)
Place of birth for the foreign-born population - Chile (%)
Place of birth for the foreign-born population - Colombia (%)
Place of birth for the foreign-born population - Ecuador (%)
Place of birth for the foreign-born population - Guyana (%)
Place of birth for the foreign-born population - Peru (%)
Place of birth for the foreign-born population - Uruguay (%)
Place of birth for the foreign-born population - Venezuela (%)
Place of birth for the foreign-born population - Other South America (%)
Place of birth for the foreign-born population - Canada (%)
Place of birth for the foreign-born population - Other Northern America (%)
Place of birth for the foreign-born population - Other (%)
Latest news about races in Hempstead, NY collected exclusively by city-data.com from local newspapers, TV, and radio stations
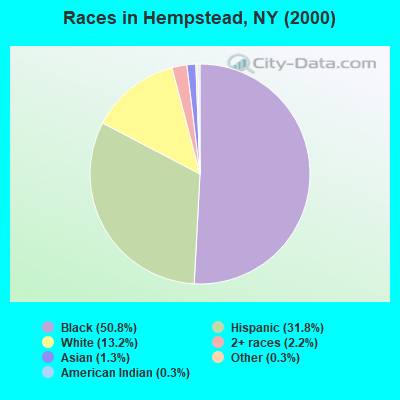
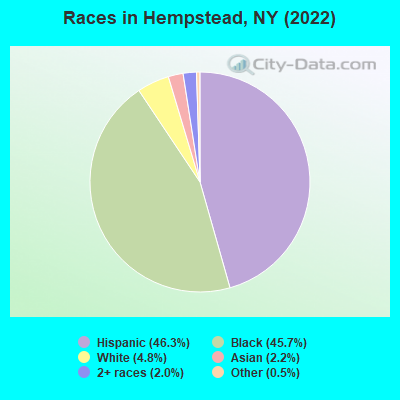
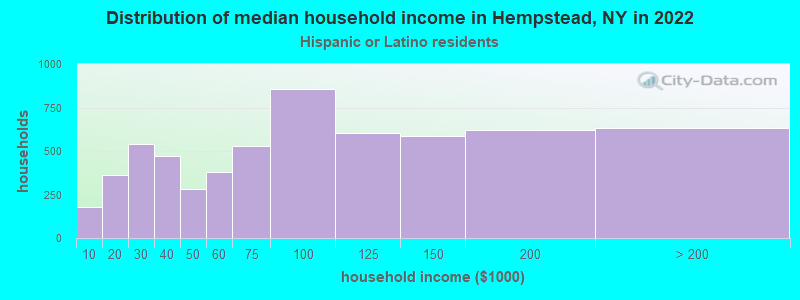
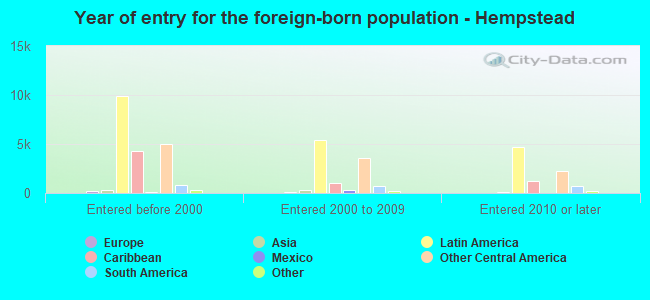
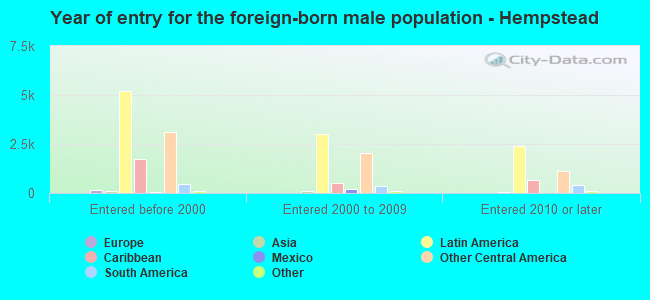
According to 2022 data, the most numerous races in Hempstead, NY are White alone (2,802 residents), Hispanic (26,987 residents), and Black alone (26,683 residents). 51.2% of Hempstead residents speak English at home. 38.2% of Hempstead, NY residents are foreign-born (36.0% born in Latin America), which is 42.4% greater than the foreign-born rate of 22.0% across the entire state of New York.
Race distribution in Hempstead
2000 2022
11,760,981 62.0% White alone 2,867,583 15.1% Hispanic 2,812,623 14.8% Black alone 1,035,926 5.5% Asian alone 366,116 1.9% Two or more races 75,499 0.4% Other race alone 52,499 0.3% American Indian alone 5,230 0.03% Native Hawaiian and Other
10,408,933 52.9% White alone 3,867,299 19.7% Hispanic 2,633,840 13.4% Black alone 1,776,286 9.0% Asian alone 732,670 3.7% Two or more races 216,110 1.1% Other race alone 35,082 0.2% American Indian alone 6,931 0.04% Native Hawaiian and Other
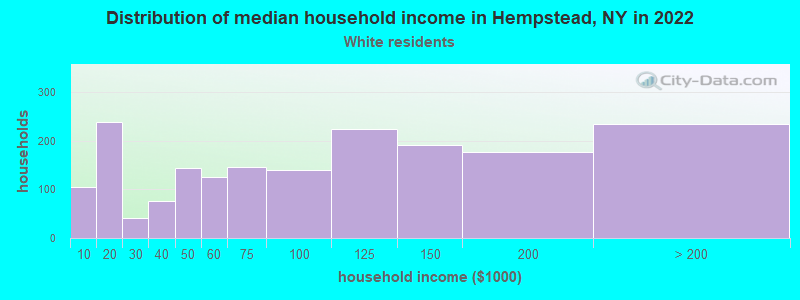
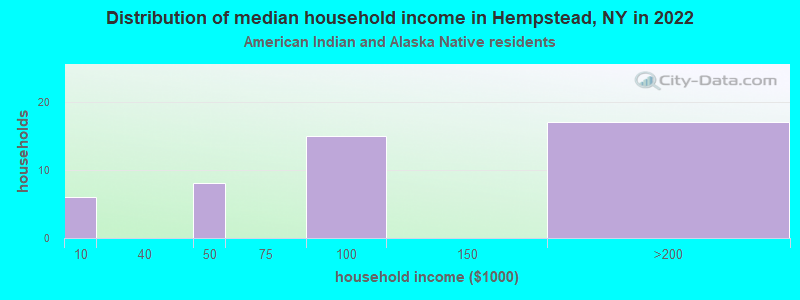
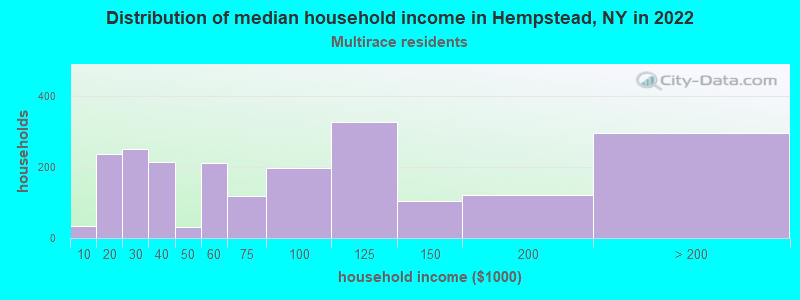
Income and house value in Hempstead Median household income in 2022 $101,974 White non-Hispanic householders$81,900 Black householders$94,892 Asian householders$83,622 Some other race householders$77,534 Two or more races householders$79,505 Hispanic or Latino race householdersMedian 2022 house value $446,431 White Non-Hispanic householders$435,652 Black or African American householders$398,055 American Indian or Alaska Native householders $492,967 Asian householders$361,509 Native Hawaiian and other Pacific Islander householders$420,402 Some other race householders$440,121 Two or more races householders$437,492 Hispanic or Latino householders
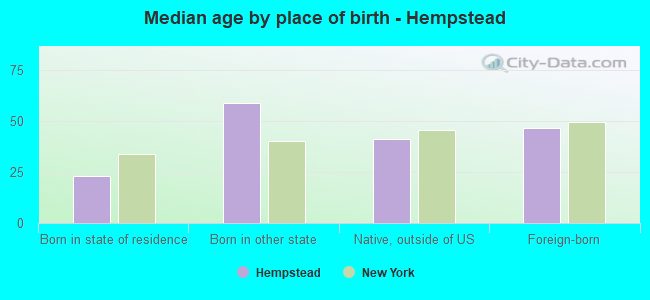
Median age by race in Hempstead
37.8 Median age for White residents37.4 38.7 37.3 Median age for Black or African American residents33.7 41.2 33.2 Median age for American Indian / Alaska Native residents13.5 36.2 43.7 Median age for Asian residents36.0 44.9 -487,992,314.6 Median age for Native Hawaiian / Pacific Islander residents-477,502,295.2 -497,387,669.3 36.5 Median age for Other race residents39.2 33.2 31.6 Median age for Two or more races residents31.7 30.5 59.2 Median age for White alone residents60.7 58.6 33.9 Median age for Hispanic or Latino residents35.2 31.9
Owner/renter occupied households by race in Hempstead
House owners and renters - White residents 779 41.4% Owner occupied1,101 58.6% Renter occupiedHouse owners and renters - Black or African American residents 4,801 54.4% Owner occupied4,021 45.6% Renter occupiedHouse owners and renters - American Indian / Alaska Native residents 41 88.4% Owner occupied5 11.6% Renter occupiedHouse owners and renters - Asian residents 170 47.5% Owner occupied188 52.5% Renter occupiedHouse owners and renters - Other race residents 1,830 40.7% Owner occupied2,669 59.3% Renter occupiedHouse owners and renters - Two or more races residents 660 33.1% Owner occupied1,335 66.9% Renter occupiedHouse owners and renters - White alone residents 591 51.2% Owner occupied564 48.8% Renter occupiedHouse owners and renters - Hispanic or Latino residents 2,057 33.9% Owner occupied4,002 66.1% Renter occupied
Language usage in Hempstead
English speakers - Total 51.2% of residents of Hempstead speak English at home.
40.7% of residents speak Spanish at home 8,393 37.9% Speak English very well13,770 62.1% Speak English less than very well8.0% of residents speak other language at home 2,478 57.1% Speak English very well1,861 42.9% Speak English less than very well
English speakers - Born in the United States 85.7% of residents of Hempstead speak English at home.
14.3% of residents speak Spanish at home 391 79.1% Speak English very well103 20.9% Speak English less than very well1.6% of residents speak other language at home 55 100.0% Speak English very well
English speakers - Native, born elsewhere 43.3% of residents of Hempstead speak English at home.
50.4% of residents speak Spanish at home 189 35.3% Speak English very well346 64.7% Speak English less than very well5.3% of residents speak other language at home 44 78.6% Speak English very well12 21.4% Speak English less than very well
English speakers - Foreign-born 20.3% of residents of Hempstead speak English at home.
63.7% of residents speak Spanish at home 2,193 15.0% Speak English very well12,431 85.0% Speak English less than very well13.3% of residents speak other language at home 1,340 43.8% Speak English very well1,721 56.2% Speak English less than very well
White (Caucasian) - Speak only English Native:
74.1% (2,478)Foreign-born:
12.3% (236)
White (Caucasian) - Speak another language Native:
21.5% (718)Foreign-born:
83.9% (1,611)
Black or African American - Speak only English Native:
93.2% (18,732)Foreign-born:
63.4% (3,803)
Black or African American - Speak another language Native:
6.4% (1,292)Foreign-born:
36.5% (2,193)
American Indian / Alaska Native - Speak another language Native:
33.4% (18)Foreign-born:
100.0% (81)
Asian - Speak only English Native:
33.6% (166)Foreign-born:
18.5% (146)
Asian - Speak another language Native:
65.4% (323)Foreign-born:
79.8% (629)
Other race - Speak only English Native:
13.0% (923)Foreign-born:
1.7% (183)
Other race - Speak another language Native:
82.8% (5,866)Foreign-born:
100.0% (10,872)
Two or more races - Speak only English Native:
50.8% (1,711)Foreign-born:
8.4% (323)
Two or more races - Speak another language Native:
52.8% (1,779)Foreign-born:
93.1% (3,582)
White alone - Speak only English Native:
94.9% (2,276)Foreign-born:
36.7% (107)
White alone - Speak another language Native:
5.1% (123)Foreign-born:
63.1% (184)
Hispanic or Latino - Speak only English Native:
22.1% (2,147)Foreign-born:
3.2% (470)
Hispanic or Latino - Speak another language Native:
78.4% (7,614)Foreign-born:
96.8% (14,251)
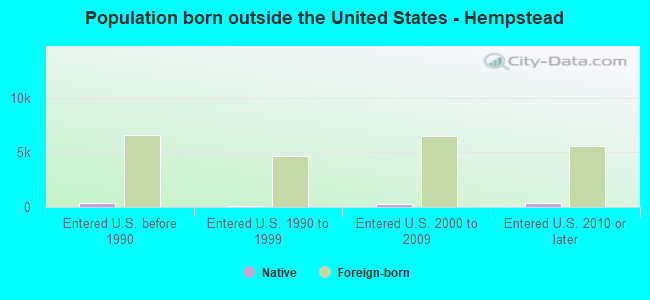
Foreign-born residents in Hempstead 22,261 residents are foreign born (36.0% Latin America ).
This city:
38.2%New York:
22.6%
Marital status for residents in Hempstead Marital status - White (Caucasian) population 15 years and over
Males 52.8% Never married35.4% Now married2.7% Separated2.2% Widowed6.8% DivorcedFemales 48.8% Never married31.7% Now married0.8% Separated9.6% Widowed9.0% DivorcedWomen who gave birth in the past 12 months Now married:
57.8% (23)Unmarried:
42.2% (17)
Women who did not give birth in the past 12 months Now married:
31.8% (392)Unmarried:
68.2% (840)
Marital status - Black or African American population 15 years and over
Males 52.3% Never married34.7% Now married2.4% Separated2.2% Widowed8.4% DivorcedFemales 55.8% Never married22.3% Now married4.8% Separated7.0% Widowed10.0% DivorcedWomen who gave birth in the past 12 months Now married:
42.9% (68)Unmarried:
57.1% (91)
Women who did not give birth in the past 12 months Now married:
22.9% (1,612)Unmarried:
77.1% (5,438)
Marital status - American Indian / Alaska Native population 15 years and over
Males 31.5% Never married50.0% Now married0.0% Separated0.0% Widowed18.5% DivorcedFemales 53.2% Never married17.0% Now married0.0% Separated8.5% Widowed21.3% DivorcedWomen who did not give birth in the past 12 months Now married:
18.6% (11)Unmarried:
81.4% (50)
Marital status - Asian population 15 years and over
Males 43.5% Never married50.9% Now married0.0% Separated5.6% Widowed0.0% DivorcedFemales 32.4% Never married45.3% Now married0.0% Separated13.6% Widowed8.7% DivorcedWomen who did not give birth in the past 12 months Now married:
45.8% (167)Unmarried:
54.2% (198)
Marital status - Other race population 15 years and over
Males 49.8% Never married40.0% Now married1.5% Separated1.1% Widowed7.6% DivorcedFemales 45.2% Never married38.1% Now married1.0% Separated9.1% Widowed6.5% DivorcedWomen who gave birth in the past 12 months Now married:
35.6% (106)Unmarried:
64.4% (191)
Women who did not give birth in the past 12 months Now married:
39.8% (1,838)Unmarried:
60.2% (2,782)
Marital status - Two or more races population 15 years and over
Males 64.0% Never married27.4% Now married0.0% Separated0.2% Widowed8.4% DivorcedFemales 51.0% Never married29.5% Now married3.7% Separated8.6% Widowed7.2% DivorcedWomen who gave birth in the past 12 months Now married:
54.0% (92)Unmarried:
46.0% (79)
Women who did not give birth in the past 12 months Now married:
30.0% (629)Unmarried:
70.0% (1,468)
Marital status - White alone, not Hispanic / Latino population 15 years and over
Males 56.7% Never married24.2% Now married0.9% Separated4.5% Widowed13.7% DivorcedFemales 52.5% Never married23.4% Now married0.4% Separated12.0% Widowed11.6% DivorcedWomen who gave birth in the past 12 months Now married:
0.0% (0)Unmarried:
100.0% (18)
Women who did not give birth in the past 12 months Now married:
13.9% (65)Unmarried:
86.1% (402)
Marital status - Hispanic or Latino population 15 years and over
Males 51.7% Never married38.2% Now married2.1% Separated1.0% Widowed7.1% DivorcedFemales 46.8% Never married36.7% Now married2.0% Separated7.6% Widowed6.9% DivorcedWomen who gave birth in the past 12 months Now married:
45.0% (179)Unmarried:
55.0% (218)
Women who did not give birth in the past 12 months Now married:
37.8% (2,325)Unmarried:
62.2% (3,819)
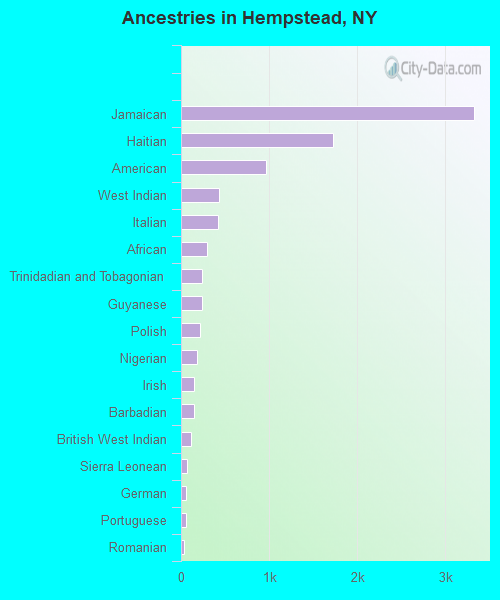
Ancestries in Hempstead
3,328 8.2% Jamaican1,728 4.3% Haitian959 2.4% American429 1.1% West Indian419 1.0% Italian294 0.7% African243 0.6% Trinidadian and Tobagonian235 0.6% Guyanese218 0.5% Polish178 0.4% Nigerian145 0.4% Irish143 0.4% Barbadian112 0.3% British West Indian63 0.2% Sierra Leonean61 0.2% German55 0.1% Portuguese32 0.08% Romanian29 0.07% Ghanaian26 0.06% Brazilian24 0.06% Liberian20 0.05% Dutch19 0.05% Israeli18 0.04% English16 0.04% French Canadian13 0.03% Greek13 0.03% Russian12 0.03% British12 0.03% European11 0.03% Kenyan7 0.02% Belgian5 0.01% Armenian4 0.01% French
Geographical mobility in Hempstead Same house 1 year ago 5,323 87.6% White (Caucasian)25,091 91.9% Black or African American193 92.3% American Indian / Alaska Native1,010 77.4% Asian6 89.7% Native Hawaiian / Pacific Islander17,992 92.9% Other race6,864 86.9% Two or more races2,364 84.9% White alone, not Hispanic / Latino24,278 91.3% Hispanic or LatinoMoved within same county 596 9.8% White / Caucasian1,311 4.8% Black or African American36 2.7% Asian633 3.3% Other race833 10.5% Two or more races287 10.3% White alone, not Hispanic / Latino1,406 5.3% Hispanic or LatinoMoved within same state 104 1.7% White / Caucasian824 3.0% Black or African American21 10.1% American Indian / Alaska Native245 18.8% Asian321 1.7% Other race205 2.6% Two or more races86 3.1% White alone, not Hispanic / Latino518 1.9% Hispanic or LatinoMoved from different state 57 0.9% White / Caucasian114 0.4% Black or African American67 5.1% Asian32 0.2% Other race29 0.4% Two or more races58 2.1% White alone, not Hispanic / Latino33 0.1% Hispanic or LatinoMoved from abroad 16 0.3% White8 0.0% Black or African American516 2.7% Other race91 1.2% Two or more races17 0.6% White alone, not Hispanic / Latino503 1.9% Hispanic or Latino
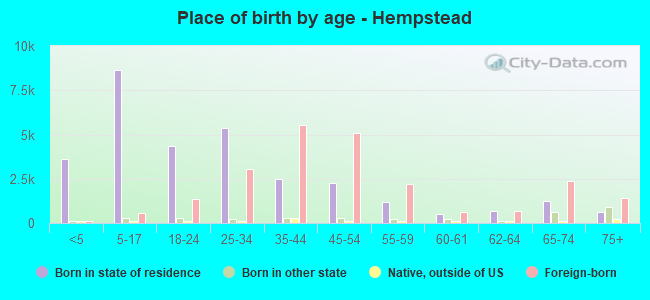
Children Nativity (place of birth) in Hempstead
Children under 6 years - Living with two parents Both parents native 130 100.0% NativeBoth parents foreign-born 1,001 98.2% Native18 1.8% Foreign-bornOne native, one foreign-born parent 185 100.0% NativeChildren under 6 years - Living with one parent Native parent 1,494 100.0% NativeForeign-born parent 1,188 90.2% Native129 9.8% Foreign-bornChildren 6 to 17 years - Living with two parents Both parents native 425 100.0% NativeBoth parents foreign-born 2,204 92.6% Native177 7.4% Foreign-bornOne native, one foreign-born parent 453 100.0% NativeChildren 6 to 17 years - Living with one parent Native parent 3,480 100.0% NativeForeign-born parent 1,932 50.6% Native1,883 49.4% Foreign-born
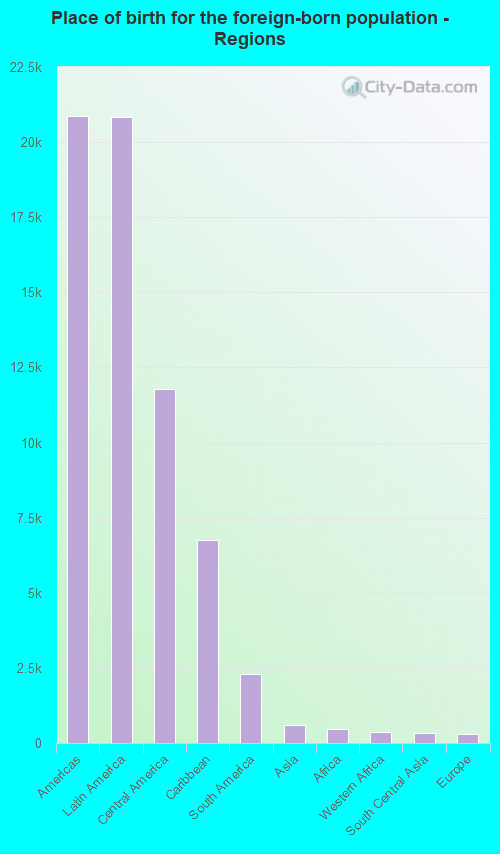
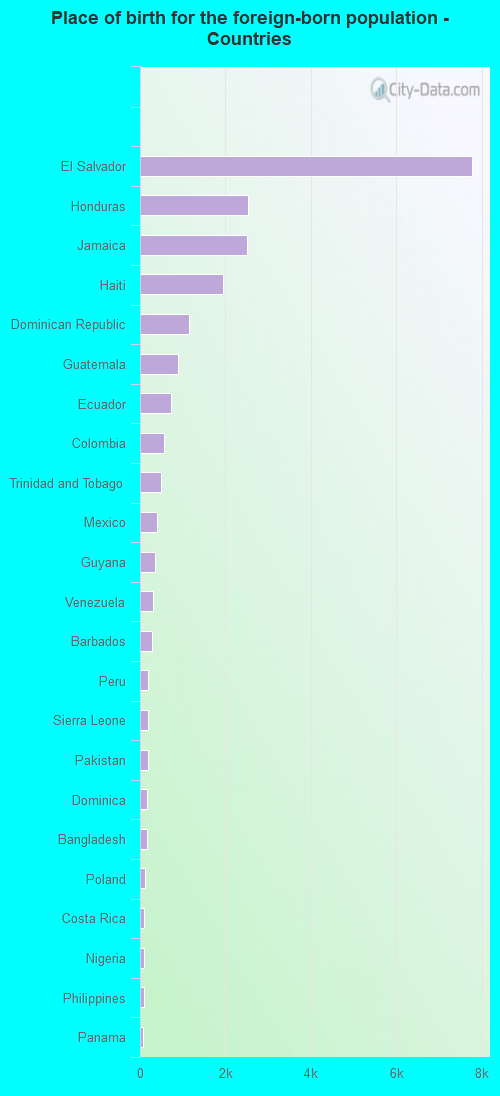
Place of birth for residents in Hempstead 20,882 Americas20,826 Latin America11,791 Central America6,754 Caribbean2,280 South America590 Asia477 Africa370 Western Africa344 South Central Asia303 Europe146 Eastern Europe101 South Eastern Asia80 Southern Europe80 Eastern Asia64 Western Asia57 Northern Europe56 Northern America52 China24 Southern Africa19 Western Europe6 Oceania7,784 El Salvador2,528 Honduras2,501 Jamaica1,940 Haiti1,158 Dominican Republic879 Guatemala734 Ecuador570 Colombia490 Trinidad and Tobago401 Mexico359 Guyana305 Venezuela273 Barbados198 Peru188 Sierra Leone182 Pakistan168 Dominica154 Bangladesh108 Poland105 Costa Rica99 Nigeria94 Philippines77 Panama64 Israel56 Canada54 Argentina45 Ghana36 Liberia36 West Indies34 Greece31 China29 Bolivia28 Italy27 Brazil25 Grenada22 Ireland21 St. Vincent and the Grenadines21 Japan20 Taiwan18 England16 Spain15 Belarus12 United Kingdom10 Romania10 Moldova10 Belgium8 Germany7 Nicaragua6 Thailand6 Iran6 Belize5 Korea2 Scotland
Grandparents responsible for own grandchildren in Hempstead
Grandparents (30 to 59 years) White / Caucasian 76 100.0% Not responsible for grandchildrenBlack or African American 285 33.0% Responsible for grandchildren578 67.0% Not responsible for grandchildrenOther race 527 100.0% Not responsible for grandchildrenTwo or more races 38 100.0% Not responsible for grandchildrenWhite alone, not Hispanic / Latino 3 100.0% Not responsible for grandchildrenHispanic or Latino 528 100.0% Not responsible for grandchildrenGrandparents (60 years and over) White / Caucasian 23 14.1% Responsible for grandchildren141 85.9% Not responsible for grandchildrenBlack or African American 38 4.8% Responsible for grandchildren759 95.2% Not responsible for grandchildrenOther race 18 6.8% Responsible for grandchildren247 93.2% Not responsible for grandchildrenTwo or more races 103 100.0% Not responsible for grandchildrenWhite alone, not Hispanic / Latino 8 17.0% Responsible for grandchildren40 83.0% Not responsible for grandchildrenHispanic or Latino 54 8.9% Responsible for grandchildren549 91.1% Not responsible for grandchildren