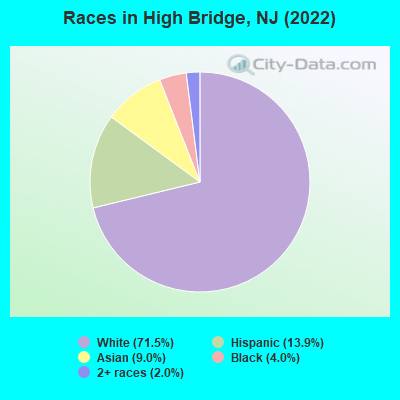
Races in High Bridge, New Jersey (NJ) Detailed Stats
Data:
Races - White alone (%)
Races - White alone (% change since 2000)
Races - Black alone (%)
Races - Black alone (% change since 2000)
Races - American Indian alone (%)
Races - American Indian alone (% change since 2000)
Races - Asian alone (%)
Races - Asian alone (% change since 2000)
Races - Hispanic (%)
Races - Hispanic (% change since 2000)
Races - Native Hawaiian and Other Pacific Islander alone (%)
Races - Native Hawaiian and Other Pacific Islander alone (% change since 2000)
Races - Two or more races(%)
Races - Two or more races(% change since 2000)
Races - Other race alone (%)
Races - Other race alone (% change since 2000)
Racial diversity
Place of birth - Born in state of residence (%)
Place of birth - Born in state of residence (%) - White
Place of birth - Born in state of residence (%) - Black or African American
Place of birth - Born in state of residence (%) - Asian
Place of birth - Born in state of residence (%) - Hispanic or Latino
Place of birth - Born in state of residence (%) - American Indian and Alaska Native
Place of birth - Born in state of residence (%) - Multirace
Place of birth - Born in state of residence (%) - Other Race
Place of birth - Born in other state (%)
Place of birth - Born in other state (%) - White
Place of birth - Born in other state (%) - Black or African American
Place of birth - Born in other state (%) - Asian
Place of birth - Born in other state (%) - Hispanic or Latino
Place of birth - Born in other state (%) - American Indian and Alaska Native
Place of birth - Born in other state (%) - Multirace
Place of birth - Born in other state (%) - Other Race
Place of birth - Native, outside of US (%)
Place of birth - Native, outside of US (%) - White
Place of birth - Native, outside of US (%) - Black or African American
Place of birth - Native, outside of US (%) - Asian
Place of birth - Native, outside of US (%) - Hispanic or Latino
Place of birth - Native, outside of US (%) - American Indian and Alaska Native
Place of birth - Native, outside of US (%) - Multirace
Place of birth - Native, outside of US (%) - Other Race
Place of birth - Foreign born (%)
Place of birth - Foreign born (%) - White
Place of birth - Foreign born (%) - Black or African American
Place of birth - Foreign born (%) - Asian
Place of birth - Foreign born (%) - Hispanic or Latino
Place of birth - Foreign born (%) - American Indian and Alaska Native
Place of birth - Foreign born (%) - Multirace
Place of birth - Foreign born (%) - Other Race
Residents speaking English at home (%)
Residents speaking English at home - Born in the United States (%)
Residents speaking English at home - Native, born elsewhere (%)
Residents speaking English at home - Foreign born (%)
Residents speaking Spanish at home (%)
Residents speaking Spanish at home - Born in the United States (%)
Residents speaking Spanish at home - Native, born elsewhere (%)
Residents speaking Spanish at home - Foreign born (%)
Residents speaking other language at home (%)
Residents speaking other language at home - Born in the United States (%)
Residents speaking other language at home - Native, born elsewhere (%)
Residents speaking other language at home - Foreign born (%)
Marital status - Never married (%)
Marital status - Now married (%)
Marital status - Separated (%)
Marital status - Widowed (%)
Marital status - Divorced (%)
Ancestries Reported - Arab (%)
Ancestries Reported - Czech (%)
Ancestries Reported - Danish (%)
Ancestries Reported - Dutch (%)
Ancestries Reported - English (%)
Ancestries Reported - French (%)
Ancestries Reported - French Canadian (%)
Ancestries Reported - German (%)
Ancestries Reported - Greek (%)
Ancestries Reported - Hungarian (%)
Ancestries Reported - Irish (%)
Ancestries Reported - Italian (%)
Ancestries Reported - Lithuanian (%)
Ancestries Reported - Norwegian (%)
Ancestries Reported - Polish (%)
Ancestries Reported - Portuguese (%)
Ancestries Reported - Russian (%)
Ancestries Reported - Scotch-Irish (%)
Ancestries Reported - Scottish (%)
Ancestries Reported - Slovak (%)
Ancestries Reported - Subsaharan African (%)
Ancestries Reported - Swedish (%)
Ancestries Reported - Swiss (%)
Ancestries Reported - Ukrainian (%)
Ancestries Reported - United States (%)
Ancestries Reported - Welsh (%)
Ancestries Reported - West Indian (%)
Ancestries Reported - Other (%)
Geographical mobility - Same house 1 year ago (%)
Geographical mobility - Same house 1 year ago (%) - White
Geographical mobility - Same house 1 year ago (%) - Black or African American
Geographical mobility - Same house 1 year ago (%) - Asian
Geographical mobility - Same house 1 year ago (%) - Hispanic or Latino
Geographical mobility - Same house 1 year ago (%) - American Indian and Alaska Native
Geographical mobility - Same house 1 year ago (%) - Multirace
Geographical mobility - Same house 1 year ago (%) - Other Race
Geographical mobility - Moved within same county (%)
Geographical mobility - Moved within same county (%) - White
Geographical mobility - Moved within same county (%) - Black or African American
Geographical mobility - Moved within same county (%) - Asian
Geographical mobility - Moved within same county (%) - Hispanic or Latino
Geographical mobility - Moved within same county (%) - American Indian and Alaska Native
Geographical mobility - Moved within same county (%) - Multirace
Geographical mobility - Moved within same county (%) - Other Race
Geographical mobility - Moved from different county within same state (%)
Geographical mobility - Moved from different county within same state (%) - White
Geographical mobility - Moved from different county within same state (%) - Black or African American
Geographical mobility - Moved from different county within same state (%) - Asian
Geographical mobility - Moved from different county within same state (%) - Hispanic or Latino
Geographical mobility - Moved from different county within same state (%) - American Indian and Alaska Native
Geographical mobility - Moved from different county within same state (%) - Multirace
Geographical mobility - Moved from different county within same state (%) - Other Race
Geographical mobility - Moved from different state (%)
Geographical mobility - Moved from different state (%) - White
Geographical mobility - Moved from different state (%) - Black or African American
Geographical mobility - Moved from different state (%) - Asian
Geographical mobility - Moved from different state (%) - Hispanic or Latino
Geographical mobility - Moved from different state (%) - American Indian and Alaska Native
Geographical mobility - Moved from different state (%) - Multirace
Geographical mobility - Moved from different state (%) - Other Race
Geographical mobility - Moved from abroad (%)
Geographical mobility - Moved from abroad (%) - White
Geographical mobility - Moved from abroad (%) - Black or African American
Geographical mobility - Moved from abroad (%) - Asian
Geographical mobility - Moved from abroad (%) - Hispanic or Latino
Geographical mobility - Moved from abroad (%) - American Indian and Alaska Native
Geographical mobility - Moved from abroad (%) - Multirace
Geographical mobility - Moved from abroad (%) - Other Race
Place of birth for the foreign-born population - Ireland (%)
Place of birth for the foreign-born population - Denmark (%)
Place of birth for the foreign-born population - Norway (%)
Place of birth for the foreign-born population - Sweden (%)
Place of birth for the foreign-born population - United Kingdom (%)
Place of birth for the foreign-born population - England (%)
Place of birth for the foreign-born population - Scotland (%)
Place of birth for the foreign-born population - Other Northern Europe (%)
Place of birth for the foreign-born population - Austria (%)
Place of birth for the foreign-born population - Belgium (%)
Place of birth for the foreign-born population - France (%)
Place of birth for the foreign-born population - Germany (%)
Place of birth for the foreign-born population - Netherlands (%)
Place of birth for the foreign-born population - Switzerland (%)
Place of birth for the foreign-born population - Other Western Europe (%)
Place of birth for the foreign-born population - Greece (%)
Place of birth for the foreign-born population - Italy (%)
Place of birth for the foreign-born population - Portugal (%)
Place of birth for the foreign-born population - Spain (%)
Place of birth for the foreign-born population - Other Southern Europe (%)
Place of birth for the foreign-born population - Albania (%)
Place of birth for the foreign-born population - Belarus (%)
Place of birth for the foreign-born population - Bosnia and Herzegovina (%)
Place of birth for the foreign-born population - Bulgaria (%)
Place of birth for the foreign-born population - Croatia (%)
Place of birth for the foreign-born population - Czechoslovakia (%)
Place of birth for the foreign-born population - Hungary (%)
Place of birth for the foreign-born population - Latvia (%)
Place of birth for the foreign-born population - Lithuania (%)
Place of birth for the foreign-born population - North Macedonia (Macedonia) (%)
Place of birth for the foreign-born population - Moldova (%)
Place of birth for the foreign-born population - Poland (%)
Place of birth for the foreign-born population - Romania (%)
Place of birth for the foreign-born population - Russia (%)
Place of birth for the foreign-born population - Serbia (%)
Place of birth for the foreign-born population - Ukraine (%)
Place of birth for the foreign-born population - Other Eastern Europe (%)
Place of birth for the foreign-born population - China (%)
Place of birth for the foreign-born population - Hong Kong (%)
Place of birth for the foreign-born population - Taiwan (%)
Place of birth for the foreign-born population - Japan (%)
Place of birth for the foreign-born population - Korea (%)
Place of birth for the foreign-born population - Other Eastern Asia (%)
Place of birth for the foreign-born population - Afghanistan (%)
Place of birth for the foreign-born population - Bangladesh (%)
Place of birth for the foreign-born population - India (%)
Place of birth for the foreign-born population - Iran (%)
Place of birth for the foreign-born population - Kazakhstan (%)
Place of birth for the foreign-born population - Nepal (%)
Place of birth for the foreign-born population - Pakistan (%)
Place of birth for the foreign-born population - Sri Lanka (%)
Place of birth for the foreign-born population - Uzbekistan (%)
Place of birth for the foreign-born population - Other South Central Asia (%)
Place of birth for the foreign-born population - Burma (%)
Place of birth for the foreign-born population - Cambodia (%)
Place of birth for the foreign-born population - Indonesia (%)
Place of birth for the foreign-born population - Laos (%)
Place of birth for the foreign-born population - Malaysia (%)
Place of birth for the foreign-born population - Philippines (%)
Place of birth for the foreign-born population - Singapore (%)
Place of birth for the foreign-born population - Thailand (%)
Place of birth for the foreign-born population - Vietnam (%)
Place of birth for the foreign-born population - Other South Eastern Asia (%)
Place of birth for the foreign-born population - Armenia (%)
Place of birth for the foreign-born population - Iraq (%)
Place of birth for the foreign-born population - Israel (%)
Place of birth for the foreign-born population - Jordan (%)
Place of birth for the foreign-born population - Kuwait (%)
Place of birth for the foreign-born population - Lebanon (%)
Place of birth for the foreign-born population - Saudi Arabia (%)
Place of birth for the foreign-born population - Syria (%)
Place of birth for the foreign-born population - Turkey (%)
Place of birth for the foreign-born population - Yemen (%)
Place of birth for the foreign-born population - Other Western Asia (%)
Place of birth for the foreign-born population - Eritrea (%)
Place of birth for the foreign-born population - Ethiopia (%)
Place of birth for the foreign-born population - Kenya (%)
Place of birth for the foreign-born population - Somalia (%)
Place of birth for the foreign-born population - Uganda (%)
Place of birth for the foreign-born population - Zimbabwe (%)
Place of birth for the foreign-born population - Other Eastern Africa (%)
Place of birth for the foreign-born population - Cameroon (%)
Place of birth for the foreign-born population - Congo (%)
Place of birth for the foreign-born population - Democratic Republic of Congo (Zaire) (%)
Place of birth for the foreign-born population - Other Middle Africa (%)
Place of birth for the foreign-born population - Egypt (%)
Place of birth for the foreign-born population - Morocco (%)
Place of birth for the foreign-born population - Sudan (%)
Place of birth for the foreign-born population - Other Northern Africa (%)
Place of birth for the foreign-born population - South Africa (%)
Place of birth for the foreign-born population - Other Southern Africa (%)
Place of birth for the foreign-born population - Cabo Verde (%)
Place of birth for the foreign-born population - Ghana (%)
Place of birth for the foreign-born population - Liberia (%)
Place of birth for the foreign-born population - Nigeria (%)
Place of birth for the foreign-born population - Senegal (%)
Place of birth for the foreign-born population - Sierra Leone (%)
Place of birth for the foreign-born population - Other Western Africa (%)
Place of birth for the foreign-born population - Australia (%)
Place of birth for the foreign-born population - New Zealand (%)
Place of birth for the foreign-born population - Fiji (%)
Place of birth for the foreign-born population - Micronesia (%)
Place of birth for the foreign-born population - Bahamas (%)
Place of birth for the foreign-born population - Barbados (%)
Place of birth for the foreign-born population - Cuba (%)
Place of birth for the foreign-born population - Dominica (%)
Place of birth for the foreign-born population - Dominican Republic (%)
Place of birth for the foreign-born population - Grenada (%)
Place of birth for the foreign-born population - Haiti (%)
Place of birth for the foreign-born population - Jamaica (%)
Place of birth for the foreign-born population - St. Vincent and the Grenadines (%)
Place of birth for the foreign-born population - Trinidad and Tobago (%)
Place of birth for the foreign-born population - West Indies (%)
Place of birth for the foreign-born population - Other Caribbean (%)
Place of birth for the foreign-born population - Belize (%)
Place of birth for the foreign-born population - Costa Rica (%)
Place of birth for the foreign-born population - El Salvador (%)
Place of birth for the foreign-born population - Guatemala (%)
Place of birth for the foreign-born population - Honduras (%)
Place of birth for the foreign-born population - Mexico (%)
Place of birth for the foreign-born population - Nicaragua (%)
Place of birth for the foreign-born population - Panama (%)
Place of birth for the foreign-born population - Other Central America (%)
Place of birth for the foreign-born population - Argentina (%)
Place of birth for the foreign-born population - Bolivia (%)
Place of birth for the foreign-born population - Brazil (%)
Place of birth for the foreign-born population - Chile (%)
Place of birth for the foreign-born population - Colombia (%)
Place of birth for the foreign-born population - Ecuador (%)
Place of birth for the foreign-born population - Guyana (%)
Place of birth for the foreign-born population - Peru (%)
Place of birth for the foreign-born population - Uruguay (%)
Place of birth for the foreign-born population - Venezuela (%)
Place of birth for the foreign-born population - Other South America (%)
Place of birth for the foreign-born population - Canada (%)
Place of birth for the foreign-born population - Other Northern America (%)
Place of birth for the foreign-born population - Other (%)
According to 2022 data, the most numerous races in High Bridge, NJ are White alone (2,561 residents), Hispanic (498 residents), and Black alone (143 residents). 77.4% of High Bridge residents speak English at home. 18.1% of High Bridge, NJ residents are foreign-born (8.4% born in Asia, 4.5% born in Europe, 4.3% born in Latin America), which is 26.8% less than the foreign-born rate of 23.0% across the entire state of New Jersey.
Race distribution in High Bridge
2000 2022
5,557,209 66.0% White alone 1,117,191 13.3% Hispanic 1,096,171 13.0% Black alone 477,012 5.7% Asian alone 133,689 1.6% Two or more races 19,565 0.2% Other race alone 11,338 0.1% American Indian alone 2,175 0.03% Native Hawaiian and Other
4,766,476 51.5% White alone 2,028,470 21.9% Hispanic 1,111,632 12.0% Black alone 923,546 10.0% Asian alone 332,237 3.6% Two or more races 89,847 1.0% Other race alone 8,557 0.09% American Indian alone 934 0.01% Native Hawaiian and Other
Income and house value in High Bridge Median household income in 2022 $112,168 White non-Hispanic householders$95,719 Hispanic or Latino race householdersMedian 2022 house value $301,071 White Non-Hispanic householders$251,808 American Indian or Alaska Native householders $251,808 Asian householders$251,808 Two or more races householders
Median age by race in High Bridge
41.7 Median age for White residents39.8 45.2 23.8 Median age for Black or African American residents38.9 13.7 -696,418,732.1 Median age for American Indian / Alaska Native residents-670,465,336.5 -688,298,917.7 38.7 Median age for Asian residents29.2 38.5 -804,177,544.9 Median age for Native Hawaiian / Pacific Islander residents-666,666,666.0 -713,070,378.3 69.7 Median age for Other race residents55.0 75.1 17.4 Median age for Two or more races residents12.1 56.4 42.3 Median age for White alone residents40.5 47.3 43.8 Median age for Hispanic or Latino residents37.0 44.3
Owner/renter occupied households by race in High Bridge
House owners and renters - White residents 980 82.3% Owner occupied210 17.7% Renter occupiedHouse owners and renters - Black or African American residents 46 64.6% Owner occupied25 35.4% Renter occupiedHouse owners and renters - Asian residents 46 56.0% Owner occupied36 44.0% Renter occupiedHouse owners and renters - Other race residents 53 100.0% Owner occupiedHouse owners and renters - Two or more races residents 47 57.5% Owner occupied35 42.5% Renter occupiedHouse owners and renters - White alone residents 946 82.7% Owner occupied198 17.3% Renter occupiedHouse owners and renters - Hispanic or Latino residents 127 71.2% Owner occupied51 28.8% Renter occupied
Language usage in High Bridge
English speakers - Total 77.4% of residents of High Bridge speak English at home.
8.1% of residents speak Spanish at home 127 46.4% Speak English very well147 53.6% Speak English less than very well15.1% of residents speak other language at home 426 83.2% Speak English very well86 16.8% Speak English less than very well
English speakers - Born in the United States 98.1% of residents of High Bridge speak English at home.
0.4% of residents speak Spanish at home 4 100.0% Speak English very well1.3% of residents speak other language at home 12 100.0% Speak English very well
English speakers - Native, born elsewhere 0.0% of residents of High Bridge speak English at home.
83.8% of residents speak Spanish at home 53 79.1% Speak English very well14 20.9% Speak English less than very well
English speakers - Foreign-born 16.4% of residents of High Bridge speak English at home.
22.5% of residents speak Spanish at home 26 17.7% Speak English very well121 82.3% Speak English less than very well64.1% of residents speak other language at home 337 80.6% Speak English very well81 19.4% Speak English less than very well
White (Caucasian) - Speak only English Native:
93.8% (2,193)Foreign-born:
19.4% (40)
White (Caucasian) - Speak another language Native:
6.2% (146)Foreign-born:
83.5% (172)
Asian - Speak only English Native:
100.0% (7)Foreign-born:
21.2% (74)
Other race - Speak another language Native:
100.0% (137)Foreign-born:
100.0% (27)
Two or more races - Speak another language Native:
5.6% (7)Foreign-born:
95.2% (66)
White alone - Speak only English Native:
95.2% (2,181)Foreign-born:
24.2% (45)
White alone - Speak another language Native:
5.0% (114)Foreign-born:
79.5% (146)
Hispanic or Latino - Speak another language Native:
43.2% (126)Foreign-born:
100.0% (130)
Foreign-born residents in High Bridge 650 residents are foreign born (8.4% Asia , 4.5% Europe , 4.3% Latin America ).
This city:
18.1%New Jersey:
23.2%
Marital status for residents in High Bridge Marital status - White (Caucasian) population 15 years and over
Males 32.4% Never married56.1% Now married0.0% Separated2.4% Widowed9.2% DivorcedFemales 28.3% Never married52.8% Now married1.8% Separated5.6% Widowed11.4% DivorcedWomen who gave birth in the past 12 months Now married:
100.0% (10)Unmarried:
0.0% (0)
Women who did not give birth in the past 12 months Now married:
38.0% (200)Unmarried:
62.0% (325)
Marital status - Black or African American population 15 years and over
Males 14.3% Never married85.7% Now married0.0% Separated0.0% Widowed0.0% DivorcedFemales 50.0% Never married50.0% Now married0.0% Separated0.0% Widowed0.0% DivorcedWomen who did not give birth in the past 12 months Now married:
50.0% (24)Unmarried:
50.0% (24)
Marital status - Asian population 15 years and over
Males 75.6% Never married24.4% Now married0.0% Separated0.0% Widowed0.0% DivorcedFemales 35.7% Never married64.3% Now married0.0% Separated0.0% Widowed0.0% DivorcedWomen who did not give birth in the past 12 months Now married:
73.1% (80)Unmarried:
26.9% (29)
Marital status - Other race population 15 years and over
Males 59.6% Never married40.4% Now married0.0% Separated0.0% Widowed0.0% DivorcedFemales 0.0% Never married70.8% Now married0.0% Separated29.2% Widowed0.0% DivorcedWomen who did not give birth in the past 12 months Now married:
100.0% (30)Unmarried:
0.0% (0)
Marital status - Two or more races population 15 years and over
Males 51.5% Never married48.5% Now married0.0% Separated0.0% Widowed0.0% DivorcedFemales 23.7% Never married40.8% Now married0.0% Separated10.5% Widowed25.0% DivorcedWomen who did not give birth in the past 12 months Now married:
45.6% (48)Unmarried:
54.4% (57)
Marital status - White alone, not Hispanic / Latino population 15 years and over
Males 32.5% Never married55.6% Now married0.0% Separated2.5% Widowed9.5% DivorcedFemales 29.1% Never married51.8% Now married1.9% Separated5.9% Widowed11.3% DivorcedWomen who gave birth in the past 12 months Now married:
100.0% (10)Unmarried:
0.0% (0)
Women who did not give birth in the past 12 months Now married:
36.3% (187)Unmarried:
63.7% (327)
Marital status - Hispanic or Latino population 15 years and over
Males 34.4% Never married65.6% Now married0.0% Separated0.0% Widowed0.0% DivorcedFemales 4.9% Never married65.2% Now married0.0% Separated13.4% Widowed16.5% DivorcedWomen who did not give birth in the past 12 months Now married:
73.5% (77)Unmarried:
26.5% (28)
Ancestries in High Bridge
210 13.3% German205 13.0% Irish201 12.8% Italian93 5.9% Hungarian85 5.4% Polish60 3.8% American36 2.3% Scotch-Irish35 2.2% European31 2.0% Russian23 1.5% Scandinavian17 1.1% Scottish16 1.0% Portuguese15 1.0% Egyptian15 1.0% English10 0.6% Canadian7 0.4% British
Children Nativity (place of birth) in High Bridge
Children under 6 years - Living with two parents Both parents native 145 100.0% NativeBoth parents foreign-born 19 100.0% NativeChildren under 6 years - Living with one parent Native parent 38 100.0% NativeChildren 6 to 17 years - Living with two parents Both parents native 253 100.0% NativeBoth parents foreign-born 47 56.8% Native36 43.2% Foreign-bornOne native, one foreign-born parent 24 100.0% NativeChildren 6 to 17 years - Living with one parent Native parent 113 81.1% Native26 18.9% Foreign-bornForeign-born parent 69 72.1% Native27 27.9% Foreign-born