Races in Hillcrest Heights, Maryland (MD) Detailed Stats
Data:
Races - White alone (%)
Races - White alone (% change since 2000)
Races - Black alone (%)
Races - Black alone (% change since 2000)
Races - American Indian alone (%)
Races - American Indian alone (% change since 2000)
Races - Asian alone (%)
Races - Asian alone (% change since 2000)
Races - Hispanic (%)
Races - Hispanic (% change since 2000)
Races - Native Hawaiian and Other Pacific Islander alone (%)
Races - Native Hawaiian and Other Pacific Islander alone (% change since 2000)
Races - Two or more races(%)
Races - Two or more races(% change since 2000)
Races - Other race alone (%)
Races - Other race alone (% change since 2000)
Racial diversity
Place of birth - Born in state of residence (%)
Place of birth - Born in state of residence (%) - White
Place of birth - Born in state of residence (%) - Black or African American
Place of birth - Born in state of residence (%) - Asian
Place of birth - Born in state of residence (%) - Hispanic or Latino
Place of birth - Born in state of residence (%) - American Indian and Alaska Native
Place of birth - Born in state of residence (%) - Multirace
Place of birth - Born in state of residence (%) - Other Race
Place of birth - Born in other state (%)
Place of birth - Born in other state (%) - White
Place of birth - Born in other state (%) - Black or African American
Place of birth - Born in other state (%) - Asian
Place of birth - Born in other state (%) - Hispanic or Latino
Place of birth - Born in other state (%) - American Indian and Alaska Native
Place of birth - Born in other state (%) - Multirace
Place of birth - Born in other state (%) - Other Race
Place of birth - Native, outside of US (%)
Place of birth - Native, outside of US (%) - White
Place of birth - Native, outside of US (%) - Black or African American
Place of birth - Native, outside of US (%) - Asian
Place of birth - Native, outside of US (%) - Hispanic or Latino
Place of birth - Native, outside of US (%) - American Indian and Alaska Native
Place of birth - Native, outside of US (%) - Multirace
Place of birth - Native, outside of US (%) - Other Race
Place of birth - Foreign born (%)
Place of birth - Foreign born (%) - White
Place of birth - Foreign born (%) - Black or African American
Place of birth - Foreign born (%) - Asian
Place of birth - Foreign born (%) - Hispanic or Latino
Place of birth - Foreign born (%) - American Indian and Alaska Native
Place of birth - Foreign born (%) - Multirace
Place of birth - Foreign born (%) - Other Race
Residents speaking English at home (%)
Residents speaking English at home - Born in the United States (%)
Residents speaking English at home - Native, born elsewhere (%)
Residents speaking English at home - Foreign born (%)
Residents speaking Spanish at home (%)
Residents speaking Spanish at home - Born in the United States (%)
Residents speaking Spanish at home - Native, born elsewhere (%)
Residents speaking Spanish at home - Foreign born (%)
Residents speaking other language at home (%)
Residents speaking other language at home - Born in the United States (%)
Residents speaking other language at home - Native, born elsewhere (%)
Residents speaking other language at home - Foreign born (%)
Marital status - Never married (%)
Marital status - Now married (%)
Marital status - Separated (%)
Marital status - Widowed (%)
Marital status - Divorced (%)
Ancestries Reported - Arab (%)
Ancestries Reported - Czech (%)
Ancestries Reported - Danish (%)
Ancestries Reported - Dutch (%)
Ancestries Reported - English (%)
Ancestries Reported - French (%)
Ancestries Reported - French Canadian (%)
Ancestries Reported - German (%)
Ancestries Reported - Greek (%)
Ancestries Reported - Hungarian (%)
Ancestries Reported - Irish (%)
Ancestries Reported - Italian (%)
Ancestries Reported - Lithuanian (%)
Ancestries Reported - Norwegian (%)
Ancestries Reported - Polish (%)
Ancestries Reported - Portuguese (%)
Ancestries Reported - Russian (%)
Ancestries Reported - Scotch-Irish (%)
Ancestries Reported - Scottish (%)
Ancestries Reported - Slovak (%)
Ancestries Reported - Subsaharan African (%)
Ancestries Reported - Swedish (%)
Ancestries Reported - Swiss (%)
Ancestries Reported - Ukrainian (%)
Ancestries Reported - United States (%)
Ancestries Reported - Welsh (%)
Ancestries Reported - West Indian (%)
Ancestries Reported - Other (%)
Geographical mobility - Same house 1 year ago (%)
Geographical mobility - Same house 1 year ago (%) - White
Geographical mobility - Same house 1 year ago (%) - Black or African American
Geographical mobility - Same house 1 year ago (%) - Asian
Geographical mobility - Same house 1 year ago (%) - Hispanic or Latino
Geographical mobility - Same house 1 year ago (%) - American Indian and Alaska Native
Geographical mobility - Same house 1 year ago (%) - Multirace
Geographical mobility - Same house 1 year ago (%) - Other Race
Geographical mobility - Moved within same county (%)
Geographical mobility - Moved within same county (%) - White
Geographical mobility - Moved within same county (%) - Black or African American
Geographical mobility - Moved within same county (%) - Asian
Geographical mobility - Moved within same county (%) - Hispanic or Latino
Geographical mobility - Moved within same county (%) - American Indian and Alaska Native
Geographical mobility - Moved within same county (%) - Multirace
Geographical mobility - Moved within same county (%) - Other Race
Geographical mobility - Moved from different county within same state (%)
Geographical mobility - Moved from different county within same state (%) - White
Geographical mobility - Moved from different county within same state (%) - Black or African American
Geographical mobility - Moved from different county within same state (%) - Asian
Geographical mobility - Moved from different county within same state (%) - Hispanic or Latino
Geographical mobility - Moved from different county within same state (%) - American Indian and Alaska Native
Geographical mobility - Moved from different county within same state (%) - Multirace
Geographical mobility - Moved from different county within same state (%) - Other Race
Geographical mobility - Moved from different state (%)
Geographical mobility - Moved from different state (%) - White
Geographical mobility - Moved from different state (%) - Black or African American
Geographical mobility - Moved from different state (%) - Asian
Geographical mobility - Moved from different state (%) - Hispanic or Latino
Geographical mobility - Moved from different state (%) - American Indian and Alaska Native
Geographical mobility - Moved from different state (%) - Multirace
Geographical mobility - Moved from different state (%) - Other Race
Geographical mobility - Moved from abroad (%)
Geographical mobility - Moved from abroad (%) - White
Geographical mobility - Moved from abroad (%) - Black or African American
Geographical mobility - Moved from abroad (%) - Asian
Geographical mobility - Moved from abroad (%) - Hispanic or Latino
Geographical mobility - Moved from abroad (%) - American Indian and Alaska Native
Geographical mobility - Moved from abroad (%) - Multirace
Geographical mobility - Moved from abroad (%) - Other Race
Place of birth for the foreign-born population - Ireland (%)
Place of birth for the foreign-born population - Denmark (%)
Place of birth for the foreign-born population - Norway (%)
Place of birth for the foreign-born population - Sweden (%)
Place of birth for the foreign-born population - United Kingdom (%)
Place of birth for the foreign-born population - England (%)
Place of birth for the foreign-born population - Scotland (%)
Place of birth for the foreign-born population - Other Northern Europe (%)
Place of birth for the foreign-born population - Austria (%)
Place of birth for the foreign-born population - Belgium (%)
Place of birth for the foreign-born population - France (%)
Place of birth for the foreign-born population - Germany (%)
Place of birth for the foreign-born population - Netherlands (%)
Place of birth for the foreign-born population - Switzerland (%)
Place of birth for the foreign-born population - Other Western Europe (%)
Place of birth for the foreign-born population - Greece (%)
Place of birth for the foreign-born population - Italy (%)
Place of birth for the foreign-born population - Portugal (%)
Place of birth for the foreign-born population - Spain (%)
Place of birth for the foreign-born population - Other Southern Europe (%)
Place of birth for the foreign-born population - Albania (%)
Place of birth for the foreign-born population - Belarus (%)
Place of birth for the foreign-born population - Bosnia and Herzegovina (%)
Place of birth for the foreign-born population - Bulgaria (%)
Place of birth for the foreign-born population - Croatia (%)
Place of birth for the foreign-born population - Czechoslovakia (%)
Place of birth for the foreign-born population - Hungary (%)
Place of birth for the foreign-born population - Latvia (%)
Place of birth for the foreign-born population - Lithuania (%)
Place of birth for the foreign-born population - North Macedonia (Macedonia) (%)
Place of birth for the foreign-born population - Moldova (%)
Place of birth for the foreign-born population - Poland (%)
Place of birth for the foreign-born population - Romania (%)
Place of birth for the foreign-born population - Russia (%)
Place of birth for the foreign-born population - Serbia (%)
Place of birth for the foreign-born population - Ukraine (%)
Place of birth for the foreign-born population - Other Eastern Europe (%)
Place of birth for the foreign-born population - China (%)
Place of birth for the foreign-born population - Hong Kong (%)
Place of birth for the foreign-born population - Taiwan (%)
Place of birth for the foreign-born population - Japan (%)
Place of birth for the foreign-born population - Korea (%)
Place of birth for the foreign-born population - Other Eastern Asia (%)
Place of birth for the foreign-born population - Afghanistan (%)
Place of birth for the foreign-born population - Bangladesh (%)
Place of birth for the foreign-born population - India (%)
Place of birth for the foreign-born population - Iran (%)
Place of birth for the foreign-born population - Kazakhstan (%)
Place of birth for the foreign-born population - Nepal (%)
Place of birth for the foreign-born population - Pakistan (%)
Place of birth for the foreign-born population - Sri Lanka (%)
Place of birth for the foreign-born population - Uzbekistan (%)
Place of birth for the foreign-born population - Other South Central Asia (%)
Place of birth for the foreign-born population - Burma (%)
Place of birth for the foreign-born population - Cambodia (%)
Place of birth for the foreign-born population - Indonesia (%)
Place of birth for the foreign-born population - Laos (%)
Place of birth for the foreign-born population - Malaysia (%)
Place of birth for the foreign-born population - Philippines (%)
Place of birth for the foreign-born population - Singapore (%)
Place of birth for the foreign-born population - Thailand (%)
Place of birth for the foreign-born population - Vietnam (%)
Place of birth for the foreign-born population - Other South Eastern Asia (%)
Place of birth for the foreign-born population - Armenia (%)
Place of birth for the foreign-born population - Iraq (%)
Place of birth for the foreign-born population - Israel (%)
Place of birth for the foreign-born population - Jordan (%)
Place of birth for the foreign-born population - Kuwait (%)
Place of birth for the foreign-born population - Lebanon (%)
Place of birth for the foreign-born population - Saudi Arabia (%)
Place of birth for the foreign-born population - Syria (%)
Place of birth for the foreign-born population - Turkey (%)
Place of birth for the foreign-born population - Yemen (%)
Place of birth for the foreign-born population - Other Western Asia (%)
Place of birth for the foreign-born population - Eritrea (%)
Place of birth for the foreign-born population - Ethiopia (%)
Place of birth for the foreign-born population - Kenya (%)
Place of birth for the foreign-born population - Somalia (%)
Place of birth for the foreign-born population - Uganda (%)
Place of birth for the foreign-born population - Zimbabwe (%)
Place of birth for the foreign-born population - Other Eastern Africa (%)
Place of birth for the foreign-born population - Cameroon (%)
Place of birth for the foreign-born population - Congo (%)
Place of birth for the foreign-born population - Democratic Republic of Congo (Zaire) (%)
Place of birth for the foreign-born population - Other Middle Africa (%)
Place of birth for the foreign-born population - Egypt (%)
Place of birth for the foreign-born population - Morocco (%)
Place of birth for the foreign-born population - Sudan (%)
Place of birth for the foreign-born population - Other Northern Africa (%)
Place of birth for the foreign-born population - South Africa (%)
Place of birth for the foreign-born population - Other Southern Africa (%)
Place of birth for the foreign-born population - Cabo Verde (%)
Place of birth for the foreign-born population - Ghana (%)
Place of birth for the foreign-born population - Liberia (%)
Place of birth for the foreign-born population - Nigeria (%)
Place of birth for the foreign-born population - Senegal (%)
Place of birth for the foreign-born population - Sierra Leone (%)
Place of birth for the foreign-born population - Other Western Africa (%)
Place of birth for the foreign-born population - Australia (%)
Place of birth for the foreign-born population - New Zealand (%)
Place of birth for the foreign-born population - Fiji (%)
Place of birth for the foreign-born population - Micronesia (%)
Place of birth for the foreign-born population - Bahamas (%)
Place of birth for the foreign-born population - Barbados (%)
Place of birth for the foreign-born population - Cuba (%)
Place of birth for the foreign-born population - Dominica (%)
Place of birth for the foreign-born population - Dominican Republic (%)
Place of birth for the foreign-born population - Grenada (%)
Place of birth for the foreign-born population - Haiti (%)
Place of birth for the foreign-born population - Jamaica (%)
Place of birth for the foreign-born population - St. Vincent and the Grenadines (%)
Place of birth for the foreign-born population - Trinidad and Tobago (%)
Place of birth for the foreign-born population - West Indies (%)
Place of birth for the foreign-born population - Other Caribbean (%)
Place of birth for the foreign-born population - Belize (%)
Place of birth for the foreign-born population - Costa Rica (%)
Place of birth for the foreign-born population - El Salvador (%)
Place of birth for the foreign-born population - Guatemala (%)
Place of birth for the foreign-born population - Honduras (%)
Place of birth for the foreign-born population - Mexico (%)
Place of birth for the foreign-born population - Nicaragua (%)
Place of birth for the foreign-born population - Panama (%)
Place of birth for the foreign-born population - Other Central America (%)
Place of birth for the foreign-born population - Argentina (%)
Place of birth for the foreign-born population - Bolivia (%)
Place of birth for the foreign-born population - Brazil (%)
Place of birth for the foreign-born population - Chile (%)
Place of birth for the foreign-born population - Colombia (%)
Place of birth for the foreign-born population - Ecuador (%)
Place of birth for the foreign-born population - Guyana (%)
Place of birth for the foreign-born population - Peru (%)
Place of birth for the foreign-born population - Uruguay (%)
Place of birth for the foreign-born population - Venezuela (%)
Place of birth for the foreign-born population - Other South America (%)
Place of birth for the foreign-born population - Canada (%)
Place of birth for the foreign-born population - Other Northern America (%)
Place of birth for the foreign-born population - Other (%)
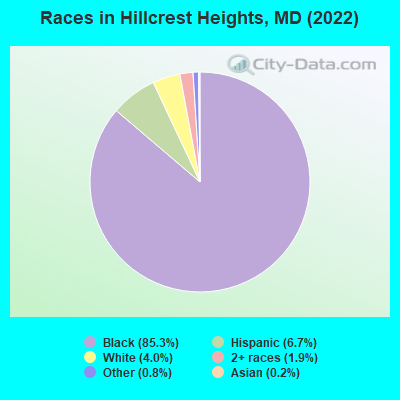
According to 2022 data, the most numerous races in Hillcrest Heights, MD are White alone (647 residents), Black alone (13,906 residents), and Hispanic (1,098 residents). 88.3% of Hillcrest Heights residents speak English at home. 6.8% of Hillcrest Heights, MD residents are foreign-born (4.2% born in Latin America, 1.5% born in Africa), which is 136.0% less than the foreign-born rate of 16.0% across the entire state of Maryland.
Race distribution in Hillcrest Heights
2000 2022
3,286,547 62.1% White alone 1,464,735 27.7% Black alone 227,916 4.3% Hispanic 209,738 4.0% Asian alone 82,946 1.6% Two or more races 13,312 0.3% American Indian alone 9,379 0.2% Other race alone 1,913 0.04% Native Hawaiian and Other
2,906,492 47.1% White alone 1,800,914 29.2% Black alone 705,842 11.4% Hispanic 401,818 6.5% Asian alone 291,317 4.7% Two or more races 46,930 0.8% Other race alone 8,930 0.1% American Indian alone 2,417 0.04% Native Hawaiian and Other
Income and house value in Hillcrest Heights Median household income in 2022 $65,791 Black householders$51,610 Some other race householders$79,060 Two or more races householders$85,503 Hispanic or Latino race householdersMedian 2022 house value $343,959 White Non-Hispanic householders$324,642 Black or African American householders $204,980 Asian householders$368,911 Some other race householders$368,911 Two or more races householders$368,911 Hispanic or Latino householders
Median age by race in Hillcrest Heights
34.0 Median age for White residents37.8 30.6 40.3 Median age for Black or African American residents38.1 43.5 -780,410,741.7 Median age for American Indian / Alaska Native residents-888,297,871.5 -689,905,591.2 -707,379,134.2 Median age for Asian residents-668,430,334.4 -716,586,150.7 -571,600,480.8 Median age for Native Hawaiian / Pacific Islander residents-720,061,021.4 -760,942,760.2 35.1 Median age for Other race residents39.1 36.2 30.8 Median age for Two or more races residents37.1 30.9 33.1 Median age for White alone residents33.3 30.1 30.8 Median age for Hispanic or Latino residents42.3 30.3
Owner/renter occupied households by race in Hillcrest Heights
House owners and renters - White residents 253 69.0% Owner occupied114 31.0% Renter occupiedHouse owners and renters - Black or African American residents 3,043 49.0% Owner occupied3,170 51.0% Renter occupiedHouse owners and renters - Asian residents 17 100.0% Renter occupiedHouse owners and renters - Other race residents 67 32.7% Owner occupied137 67.3% Renter occupiedHouse owners and renters - Two or more races residents 101 30.6% Owner occupied229 69.4% Renter occupiedHouse owners and renters - White alone residents 222 72.3% Owner occupied85 27.7% Renter occupiedHouse owners and renters - Hispanic or Latino residents 138 54.7% Owner occupied114 45.3% Renter occupied
Language usage in Hillcrest Heights
English speakers - Total 88.3% of residents of Hillcrest Heights speak English at home.
6.7% of residents speak Spanish at home 386 36.8% Speak English very well664 63.2% Speak English less than very well2.3% of residents speak other language at home 274 75.1% Speak English very well91 24.9% Speak English less than very well
English speakers - Born in the United States 97.3% of residents of Hillcrest Heights speak English at home.
1.3% of residents speak Spanish at home 102 76.1% Speak English very well32 23.9% Speak English less than very well0.4% of residents speak other language at home 38 100.0% Speak English very well
English speakers - Native, born elsewhere 86.5% of residents of Hillcrest Heights speak English at home.
28.4% of residents speak Spanish at home 40 100.0% Speak English less than very well
English speakers - Foreign-born 17.4% of residents of Hillcrest Heights speak English at home.
52.9% of residents speak Spanish at home 75 12.7% Speak English very well517 87.3% Speak English less than very well29.2% of residents speak other language at home 237 72.5% Speak English very well90 27.5% Speak English less than very well
White (Caucasian) - Speak only English Native:
69.9% (509)Foreign-born:
23.7% (21)
White (Caucasian) - Speak another language Native:
28.3% (206)Foreign-born:
76.0% (67)
Black or African American - Speak only English Native:
99.0% (12,309)Foreign-born:
35.2% (171)
Black or African American - Speak another language Native:
0.6% (71)Foreign-born:
65.1% (315)
Other race - Speak another language Native:
39.9% (72)Foreign-born:
100.0% (276)
Two or more races - Speak another language Native:
21.7% (138)Foreign-born:
100.0% (255)
White alone - Speak only English Native:
78.2% (468)Foreign-born:
79.8% (23)
White alone - Speak another language Native:
25.4% (152)Foreign-born:
22.9% (7)
Hispanic or Latino - Speak another language Native:
55.2% (272)Foreign-born:
100.0% (566)
Foreign-born residents in Hillcrest Heights 1,105 residents are foreign born (4.2% Latin America , 1.5% Africa ).
This city:
6.8%Maryland:
15.7%
Marital status for residents in Hillcrest Heights Marital status - White (Caucasian) population 15 years and over
Males 65.6% Never married30.5% Now married0.0% Separated0.8% Widowed3.2% DivorcedFemales 36.1% Never married46.4% Now married0.0% Separated0.4% Widowed17.2% DivorcedWomen who did not give birth in the past 12 months Now married:
43.9% (71)Unmarried:
56.1% (90)
Marital status - Black or African American population 15 years and over
Males 60.8% Never married26.6% Now married3.8% Separated1.7% Widowed7.0% DivorcedFemales 52.6% Never married19.8% Now married3.7% Separated7.2% Widowed16.7% DivorcedWomen who gave birth in the past 12 months Now married:
24.9% (65)Unmarried:
75.1% (196)
Women who did not give birth in the past 12 months Now married:
14.8% (488)Unmarried:
85.2% (2,811)
Marital status - Asian population 15 years and over
Males 100.0% Never married0.0% Now married0.0% Separated0.0% Widowed0.0% DivorcedFemales 0.0% Never married0.0% Now married0.0% Separated0.0% Widowed100.0% DivorcedMarital status - Other race population 15 years and over
Males 71.9% Never married12.7% Now married7.9% Separated0.0% Widowed7.5% DivorcedFemales 53.5% Never married25.7% Now married3.5% Separated7.4% Widowed9.9% DivorcedWomen who did not give birth in the past 12 months Now married:
31.9% (49)Unmarried:
68.1% (104)
Marital status - Two or more races population 15 years and over
Males 51.1% Never married42.9% Now married0.0% Separated0.0% Widowed6.0% DivorcedFemales 63.5% Never married22.1% Now married0.0% Separated0.0% Widowed14.4% DivorcedWomen who did not give birth in the past 12 months Now married:
13.0% (27)Unmarried:
87.0% (181)
Marital status - White alone, not Hispanic / Latino population 15 years and over
Males 76.7% Never married18.4% Now married0.0% Separated0.9% Widowed4.0% DivorcedFemales 45.6% Never married29.7% Now married0.0% Separated0.5% Widowed24.1% DivorcedWomen who did not give birth in the past 12 months Now married:
12.0% (12)Unmarried:
88.0% (90)
Marital status - Hispanic or Latino population 15 years and over
Males 42.2% Never married52.6% Now married5.2% Separated0.0% Widowed0.0% DivorcedFemales 53.5% Never married33.7% Now married1.4% Separated0.0% Widowed11.4% DivorcedWomen who did not give birth in the past 12 months Now married:
33.7% (142)Unmarried:
66.3% (279)
Ancestries in Hillcrest Heights
170 1.3% African161 1.3% Portuguese144 1.1% Nigerian143 1.1% Jamaican121 0.9% German106 0.8% American101 0.8% Arab43 0.3% Trinidadian and Tobagonian26 0.2% Haitian24 0.2% Canadian20 0.2% Brazilian19 0.1% Israeli16 0.1% Moroccan15 0.1% English14 0.1% British14 0.1% European9 0.07% Ukrainian8 0.06% Italian7 0.05% Liberian6 0.05% Egyptian5 0.04% Hungarian
Children Nativity (place of birth) in Hillcrest Heights
Children under 6 years - Living with two parents Both parents native 73 100.0% NativeBoth parents foreign-born 61 100.0% NativeOne native, one foreign-born parent 47 100.0% NativeChildren under 6 years - Living with one parent Native parent 874 100.0% NativeChildren 6 to 17 years - Living with two parents Both parents native 243 100.0% NativeBoth parents foreign-born 278 100.0% NativeOne native, one foreign-born parent 24 100.0% NativeChildren 6 to 17 years - Living with one parent Native parent 1,833 98.4% Native29 1.6% Foreign-bornForeign-born parent 46 79.7% Native12 20.3% Foreign-born
Grandparents responsible for own grandchildren in Hillcrest Heights
Grandparents (30 to 59 years) Black or African American 119 58.6% Responsible for grandchildren84 41.4% Not responsible for grandchildrenGrandparents (60 years and over) Black or African American 47 55.2% Responsible for grandchildren38 44.8% Not responsible for grandchildren