Races in Hillcrest, New York (NY) Detailed Stats
Data:
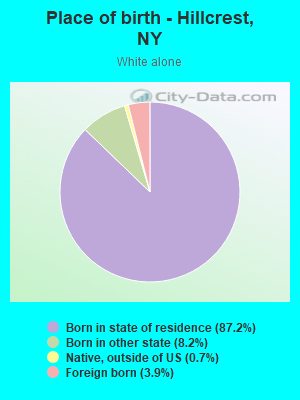
Races - White alone (%)
Races - White alone (% change since 2000)
Races - Black alone (%)
Races - Black alone (% change since 2000)
Races - American Indian alone (%)
Races - American Indian alone (% change since 2000)
Races - Asian alone (%)
Races - Asian alone (% change since 2000)
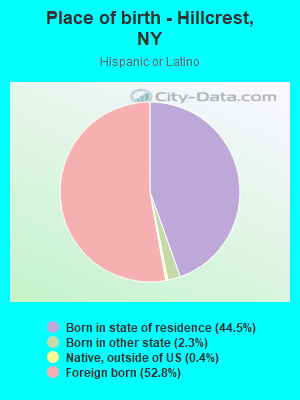
Races - Hispanic (%)
Races - Hispanic (% change since 2000)
Races - Native Hawaiian and Other Pacific Islander alone (%)
Races - Native Hawaiian and Other Pacific Islander alone (% change since 2000)
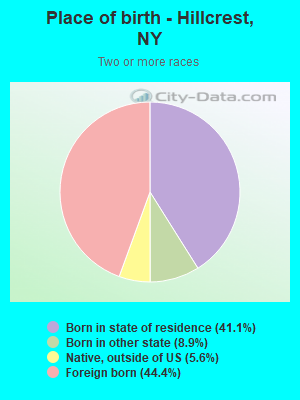
Races - Two or more races(%)
Races - Two or more races(% change since 2000)
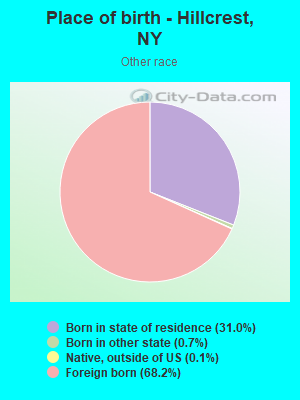
Races - Other race alone (%)
Races - Other race alone (% change since 2000)
Racial diversity
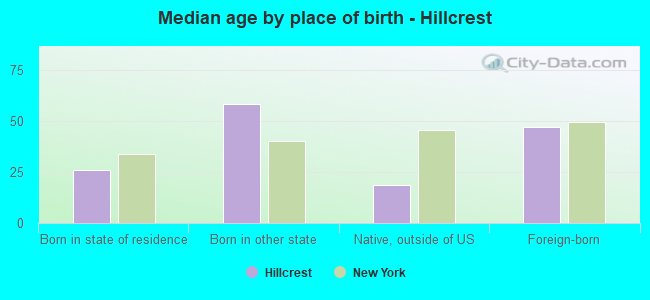
Place of birth - Born in state of residence (%)
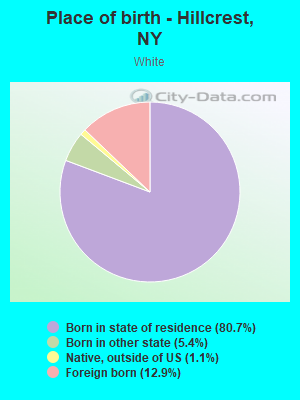
Place of birth - Born in state of residence (%) - White
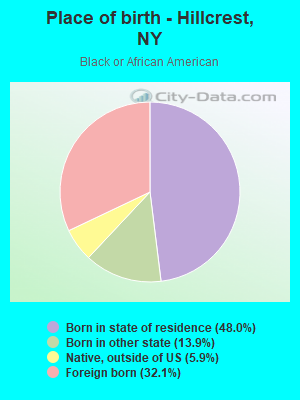
Place of birth - Born in state of residence (%) - Black or African American
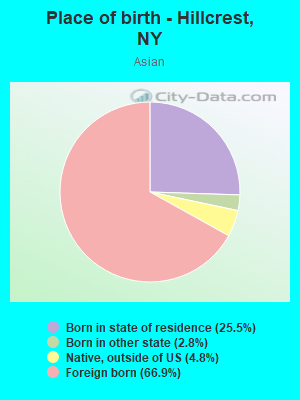
Place of birth - Born in state of residence (%) - Asian
Place of birth - Born in state of residence (%) - Hispanic or Latino
Place of birth - Born in state of residence (%) - American Indian and Alaska Native
Place of birth - Born in state of residence (%) - Multirace
Place of birth - Born in state of residence (%) - Other Race
Place of birth - Born in other state (%)
Place of birth - Born in other state (%) - White
Place of birth - Born in other state (%) - Black or African American
Place of birth - Born in other state (%) - Asian
Place of birth - Born in other state (%) - Hispanic or Latino
Place of birth - Born in other state (%) - American Indian and Alaska Native
Place of birth - Born in other state (%) - Multirace
Place of birth - Born in other state (%) - Other Race
Place of birth - Native, outside of US (%)
Place of birth - Native, outside of US (%) - White
Place of birth - Native, outside of US (%) - Black or African American
Place of birth - Native, outside of US (%) - Asian
Place of birth - Native, outside of US (%) - Hispanic or Latino
Place of birth - Native, outside of US (%) - American Indian and Alaska Native
Place of birth - Native, outside of US (%) - Multirace
Place of birth - Native, outside of US (%) - Other Race
Place of birth - Foreign born (%)
Place of birth - Foreign born (%) - White
Place of birth - Foreign born (%) - Black or African American
Place of birth - Foreign born (%) - Asian
Place of birth - Foreign born (%) - Hispanic or Latino
Place of birth - Foreign born (%) - American Indian and Alaska Native
Place of birth - Foreign born (%) - Multirace
Place of birth - Foreign born (%) - Other Race
Residents speaking English at home (%)
Residents speaking English at home - Born in the United States (%)
Residents speaking English at home - Native, born elsewhere (%)
Residents speaking English at home - Foreign born (%)
Residents speaking Spanish at home (%)
Residents speaking Spanish at home - Born in the United States (%)
Residents speaking Spanish at home - Native, born elsewhere (%)
Residents speaking Spanish at home - Foreign born (%)
Residents speaking other language at home (%)
Residents speaking other language at home - Born in the United States (%)
Residents speaking other language at home - Native, born elsewhere (%)
Residents speaking other language at home - Foreign born (%)
Marital status - Never married (%)
Marital status - Now married (%)
Marital status - Separated (%)
Marital status - Widowed (%)
Marital status - Divorced (%)
Ancestries Reported - Arab (%)
Ancestries Reported - Czech (%)
Ancestries Reported - Danish (%)
Ancestries Reported - Dutch (%)
Ancestries Reported - English (%)
Ancestries Reported - French (%)
Ancestries Reported - French Canadian (%)
Ancestries Reported - German (%)
Ancestries Reported - Greek (%)
Ancestries Reported - Hungarian (%)
Ancestries Reported - Irish (%)
Ancestries Reported - Italian (%)
Ancestries Reported - Lithuanian (%)
Ancestries Reported - Norwegian (%)
Ancestries Reported - Polish (%)
Ancestries Reported - Portuguese (%)
Ancestries Reported - Russian (%)
Ancestries Reported - Scotch-Irish (%)
Ancestries Reported - Scottish (%)
Ancestries Reported - Slovak (%)
Ancestries Reported - Subsaharan African (%)
Ancestries Reported - Swedish (%)
Ancestries Reported - Swiss (%)
Ancestries Reported - Ukrainian (%)
Ancestries Reported - United States (%)
Ancestries Reported - Welsh (%)
Ancestries Reported - West Indian (%)
Ancestries Reported - Other (%)
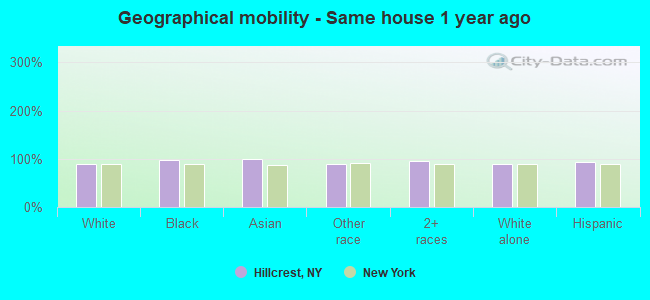
Geographical mobility - Same house 1 year ago (%)
Geographical mobility - Same house 1 year ago (%) - White
Geographical mobility - Same house 1 year ago (%) - Black or African American
Geographical mobility - Same house 1 year ago (%) - Asian
Geographical mobility - Same house 1 year ago (%) - Hispanic or Latino
Geographical mobility - Same house 1 year ago (%) - American Indian and Alaska Native
Geographical mobility - Same house 1 year ago (%) - Multirace
Geographical mobility - Same house 1 year ago (%) - Other Race
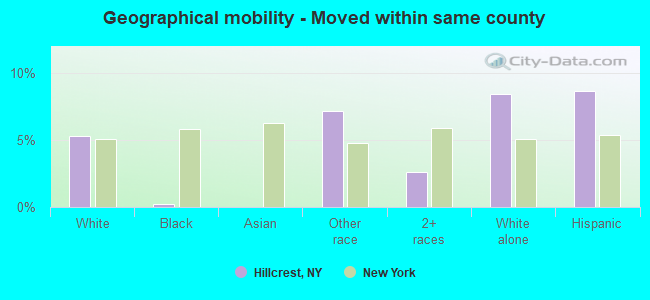
Geographical mobility - Moved within same county (%)
Geographical mobility - Moved within same county (%) - White
Geographical mobility - Moved within same county (%) - Black or African American
Geographical mobility - Moved within same county (%) - Asian
Geographical mobility - Moved within same county (%) - Hispanic or Latino
Geographical mobility - Moved within same county (%) - American Indian and Alaska Native
Geographical mobility - Moved within same county (%) - Multirace
Geographical mobility - Moved within same county (%) - Other Race
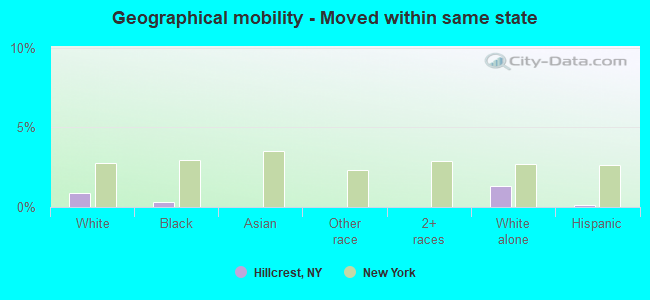
Geographical mobility - Moved from different county within same state (%)
Geographical mobility - Moved from different county within same state (%) - White
Geographical mobility - Moved from different county within same state (%) - Black or African American
Geographical mobility - Moved from different county within same state (%) - Asian
Geographical mobility - Moved from different county within same state (%) - Hispanic or Latino
Geographical mobility - Moved from different county within same state (%) - American Indian and Alaska Native
Geographical mobility - Moved from different county within same state (%) - Multirace
Geographical mobility - Moved from different county within same state (%) - Other Race
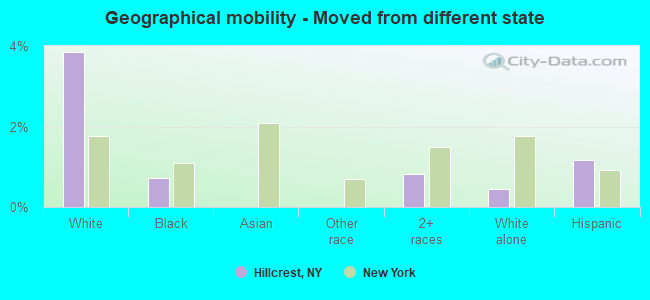
Geographical mobility - Moved from different state (%)
Geographical mobility - Moved from different state (%) - White
Geographical mobility - Moved from different state (%) - Black or African American
Geographical mobility - Moved from different state (%) - Asian
Geographical mobility - Moved from different state (%) - Hispanic or Latino
Geographical mobility - Moved from different state (%) - American Indian and Alaska Native
Geographical mobility - Moved from different state (%) - Multirace
Geographical mobility - Moved from different state (%) - Other Race
Geographical mobility - Moved from abroad (%)
Geographical mobility - Moved from abroad (%) - White
Geographical mobility - Moved from abroad (%) - Black or African American
Geographical mobility - Moved from abroad (%) - Asian
Geographical mobility - Moved from abroad (%) - Hispanic or Latino
Geographical mobility - Moved from abroad (%) - American Indian and Alaska Native
Geographical mobility - Moved from abroad (%) - Multirace
Geographical mobility - Moved from abroad (%) - Other Race
Place of birth for the foreign-born population - Ireland (%)
Place of birth for the foreign-born population - Denmark (%)
Place of birth for the foreign-born population - Norway (%)
Place of birth for the foreign-born population - Sweden (%)
Place of birth for the foreign-born population - United Kingdom (%)
Place of birth for the foreign-born population - England (%)
Place of birth for the foreign-born population - Scotland (%)
Place of birth for the foreign-born population - Other Northern Europe (%)
Place of birth for the foreign-born population - Austria (%)
Place of birth for the foreign-born population - Belgium (%)
Place of birth for the foreign-born population - France (%)
Place of birth for the foreign-born population - Germany (%)
Place of birth for the foreign-born population - Netherlands (%)
Place of birth for the foreign-born population - Switzerland (%)
Place of birth for the foreign-born population - Other Western Europe (%)
Place of birth for the foreign-born population - Greece (%)
Place of birth for the foreign-born population - Italy (%)
Place of birth for the foreign-born population - Portugal (%)
Place of birth for the foreign-born population - Spain (%)
Place of birth for the foreign-born population - Other Southern Europe (%)
Place of birth for the foreign-born population - Albania (%)
Place of birth for the foreign-born population - Belarus (%)
Place of birth for the foreign-born population - Bosnia and Herzegovina (%)
Place of birth for the foreign-born population - Bulgaria (%)
Place of birth for the foreign-born population - Croatia (%)
Place of birth for the foreign-born population - Czechoslovakia (%)
Place of birth for the foreign-born population - Hungary (%)
Place of birth for the foreign-born population - Latvia (%)
Place of birth for the foreign-born population - Lithuania (%)
Place of birth for the foreign-born population - North Macedonia (Macedonia) (%)
Place of birth for the foreign-born population - Moldova (%)
Place of birth for the foreign-born population - Poland (%)
Place of birth for the foreign-born population - Romania (%)
Place of birth for the foreign-born population - Russia (%)
Place of birth for the foreign-born population - Serbia (%)
Place of birth for the foreign-born population - Ukraine (%)
Place of birth for the foreign-born population - Other Eastern Europe (%)
Place of birth for the foreign-born population - China (%)
Place of birth for the foreign-born population - Hong Kong (%)
Place of birth for the foreign-born population - Taiwan (%)
Place of birth for the foreign-born population - Japan (%)
Place of birth for the foreign-born population - Korea (%)
Place of birth for the foreign-born population - Other Eastern Asia (%)
Place of birth for the foreign-born population - Afghanistan (%)
Place of birth for the foreign-born population - Bangladesh (%)
Place of birth for the foreign-born population - India (%)
Place of birth for the foreign-born population - Iran (%)
Place of birth for the foreign-born population - Kazakhstan (%)
Place of birth for the foreign-born population - Nepal (%)
Place of birth for the foreign-born population - Pakistan (%)
Place of birth for the foreign-born population - Sri Lanka (%)
Place of birth for the foreign-born population - Uzbekistan (%)
Place of birth for the foreign-born population - Other South Central Asia (%)
Place of birth for the foreign-born population - Burma (%)
Place of birth for the foreign-born population - Cambodia (%)
Place of birth for the foreign-born population - Indonesia (%)
Place of birth for the foreign-born population - Laos (%)
Place of birth for the foreign-born population - Malaysia (%)
Place of birth for the foreign-born population - Philippines (%)
Place of birth for the foreign-born population - Singapore (%)
Place of birth for the foreign-born population - Thailand (%)
Place of birth for the foreign-born population - Vietnam (%)
Place of birth for the foreign-born population - Other South Eastern Asia (%)
Place of birth for the foreign-born population - Armenia (%)
Place of birth for the foreign-born population - Iraq (%)
Place of birth for the foreign-born population - Israel (%)
Place of birth for the foreign-born population - Jordan (%)
Place of birth for the foreign-born population - Kuwait (%)
Place of birth for the foreign-born population - Lebanon (%)
Place of birth for the foreign-born population - Saudi Arabia (%)
Place of birth for the foreign-born population - Syria (%)
Place of birth for the foreign-born population - Turkey (%)
Place of birth for the foreign-born population - Yemen (%)
Place of birth for the foreign-born population - Other Western Asia (%)
Place of birth for the foreign-born population - Eritrea (%)
Place of birth for the foreign-born population - Ethiopia (%)
Place of birth for the foreign-born population - Kenya (%)
Place of birth for the foreign-born population - Somalia (%)
Place of birth for the foreign-born population - Uganda (%)
Place of birth for the foreign-born population - Zimbabwe (%)
Place of birth for the foreign-born population - Other Eastern Africa (%)
Place of birth for the foreign-born population - Cameroon (%)
Place of birth for the foreign-born population - Congo (%)
Place of birth for the foreign-born population - Democratic Republic of Congo (Zaire) (%)
Place of birth for the foreign-born population - Other Middle Africa (%)
Place of birth for the foreign-born population - Egypt (%)
Place of birth for the foreign-born population - Morocco (%)
Place of birth for the foreign-born population - Sudan (%)
Place of birth for the foreign-born population - Other Northern Africa (%)
Place of birth for the foreign-born population - South Africa (%)
Place of birth for the foreign-born population - Other Southern Africa (%)
Place of birth for the foreign-born population - Cabo Verde (%)
Place of birth for the foreign-born population - Ghana (%)
Place of birth for the foreign-born population - Liberia (%)
Place of birth for the foreign-born population - Nigeria (%)
Place of birth for the foreign-born population - Senegal (%)
Place of birth for the foreign-born population - Sierra Leone (%)
Place of birth for the foreign-born population - Other Western Africa (%)
Place of birth for the foreign-born population - Australia (%)
Place of birth for the foreign-born population - New Zealand (%)
Place of birth for the foreign-born population - Fiji (%)
Place of birth for the foreign-born population - Micronesia (%)
Place of birth for the foreign-born population - Bahamas (%)
Place of birth for the foreign-born population - Barbados (%)
Place of birth for the foreign-born population - Cuba (%)
Place of birth for the foreign-born population - Dominica (%)
Place of birth for the foreign-born population - Dominican Republic (%)
Place of birth for the foreign-born population - Grenada (%)
Place of birth for the foreign-born population - Haiti (%)
Place of birth for the foreign-born population - Jamaica (%)
Place of birth for the foreign-born population - St. Vincent and the Grenadines (%)
Place of birth for the foreign-born population - Trinidad and Tobago (%)
Place of birth for the foreign-born population - West Indies (%)
Place of birth for the foreign-born population - Other Caribbean (%)
Place of birth for the foreign-born population - Belize (%)
Place of birth for the foreign-born population - Costa Rica (%)
Place of birth for the foreign-born population - El Salvador (%)
Place of birth for the foreign-born population - Guatemala (%)
Place of birth for the foreign-born population - Honduras (%)
Place of birth for the foreign-born population - Mexico (%)
Place of birth for the foreign-born population - Nicaragua (%)
Place of birth for the foreign-born population - Panama (%)
Place of birth for the foreign-born population - Other Central America (%)
Place of birth for the foreign-born population - Argentina (%)
Place of birth for the foreign-born population - Bolivia (%)
Place of birth for the foreign-born population - Brazil (%)
Place of birth for the foreign-born population - Chile (%)
Place of birth for the foreign-born population - Colombia (%)
Place of birth for the foreign-born population - Ecuador (%)
Place of birth for the foreign-born population - Guyana (%)
Place of birth for the foreign-born population - Peru (%)
Place of birth for the foreign-born population - Uruguay (%)
Place of birth for the foreign-born population - Venezuela (%)
Place of birth for the foreign-born population - Other South America (%)
Place of birth for the foreign-born population - Canada (%)
Place of birth for the foreign-born population - Other Northern America (%)
Place of birth for the foreign-born population - Other (%)
Latest news about races in Hillcrest, NY collected exclusively by city-data.com from local newspapers, TV, and radio stations
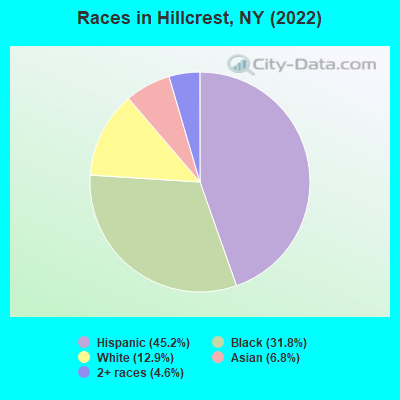
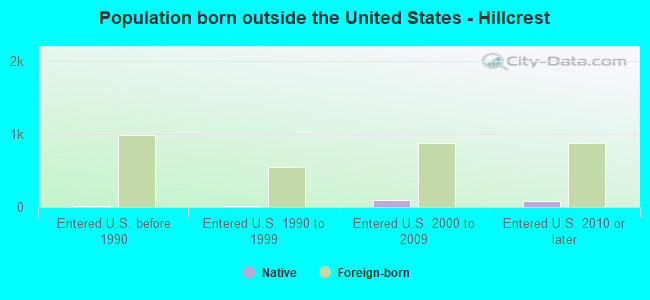
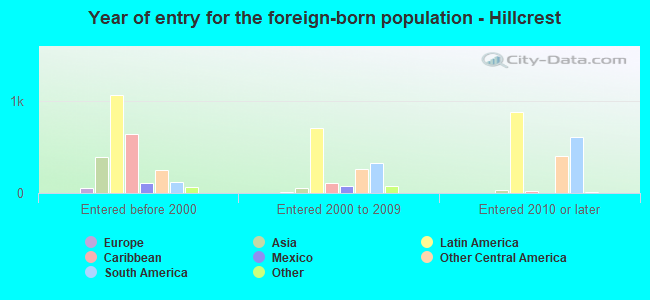
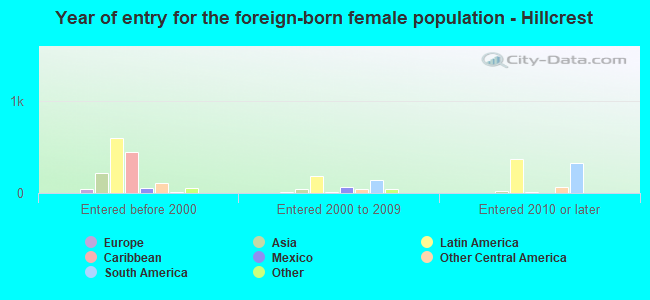
According to 2022 data, the most numerous races in Hillcrest, NY are White alone (1,062 residents), Hispanic (3,713 residents), and Black alone (2,616 residents). 38.5% of Hillcrest residents speak English at home. 41.1% of Hillcrest, NY residents are foreign-born (33.7% born in Latin America, 5.5% born in Asia), which is 46.5% greater than the foreign-born rate of 22.0% across the entire state of New York.
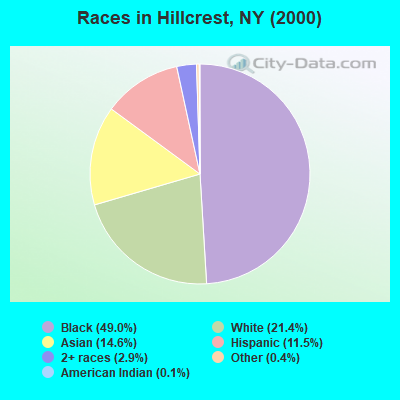
Race distribution in Hillcrest
2000 2022
11,760,981 62.0% White alone 2,867,583 15.1% Hispanic 2,812,623 14.8% Black alone 1,035,926 5.5% Asian alone 366,116 1.9% Two or more races 75,499 0.4% Other race alone 52,499 0.3% American Indian alone 5,230 0.03% Native Hawaiian and Other
10,408,933 52.9% White alone 3,867,299 19.7% Hispanic 2,633,840 13.4% Black alone 1,776,286 9.0% Asian alone 732,670 3.7% Two or more races 216,110 1.1% Other race alone 35,082 0.2% American Indian alone 6,931 0.04% Native Hawaiian and Other
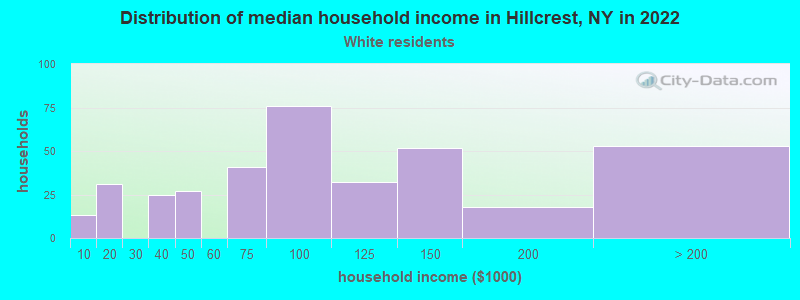
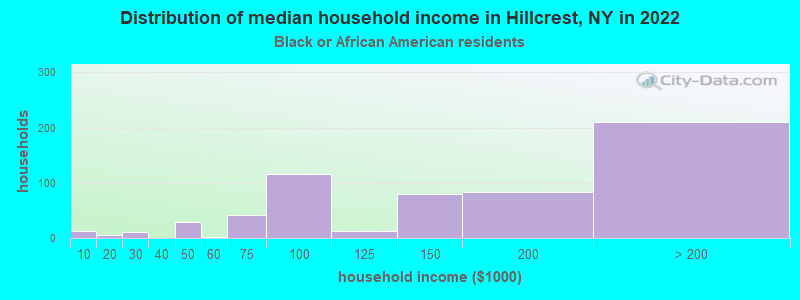
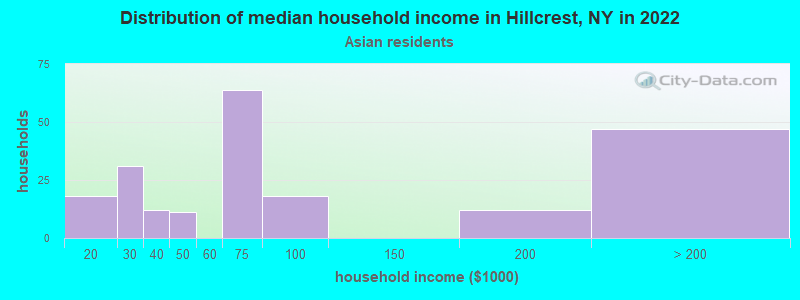
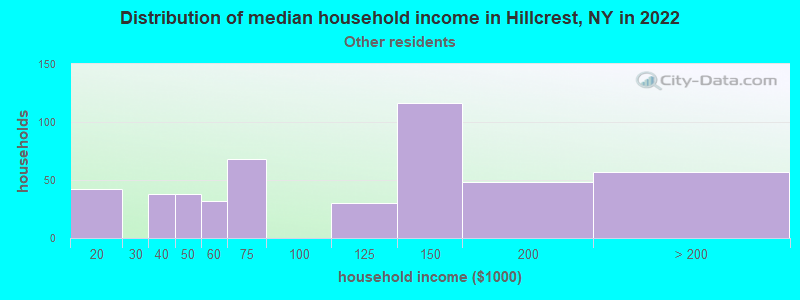
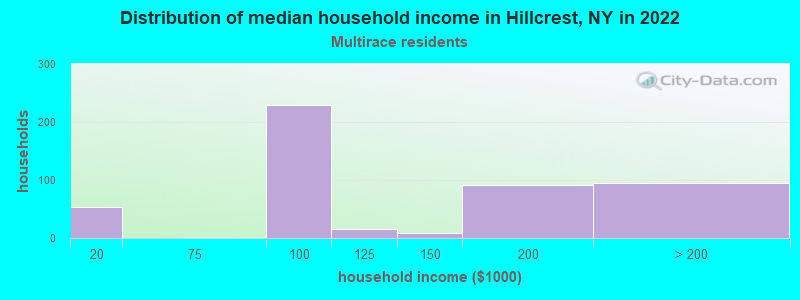
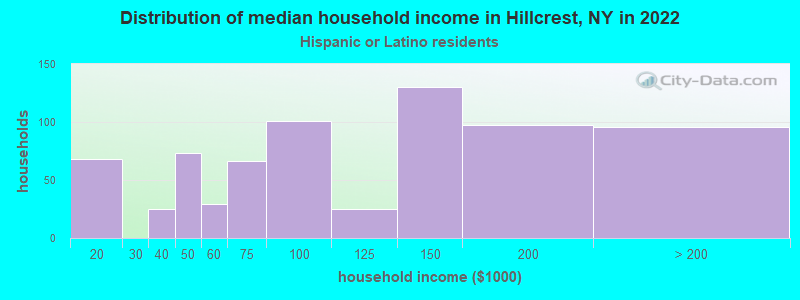
Income and house value in Hillcrest Median household income in 2022 $89,484 White non-Hispanic householders$125,826 Black householders$60,017 Asian householders$117,741 Some other race householders$75,842 Two or more races householders$113,931 Hispanic or Latino race householdersMedian 2022 house value $495,417 White Non-Hispanic householders$524,559 Black or African American householders $538,714 Asian householders$446,569 Some other race householders$529,000 Two or more races householders$466,552 Hispanic or Latino householders
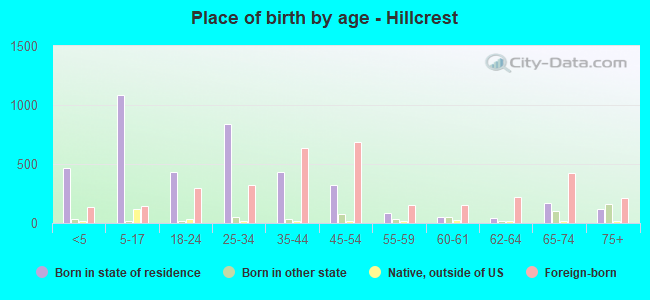
Median age by race in Hillcrest
24.5 Median age for White residents23.1 26.0 46.2 Median age for Black or African American residents44.2 49.2 -666,666,666.0 Median age for American Indian / Alaska Native residents-750,656,167.2 -644,444,443.8 61.8 Median age for Asian residents57.8 65.1 -463,937,621.4 Median age for Native Hawaiian / Pacific Islander residents-649,572,648.9 -666,666,666.0 34.6 Median age for Other race residents34.7 32.6 36.6 Median age for Two or more races residents32.6 45.8 33.1 Median age for White alone residents33.1 33.7 31.9 Median age for Hispanic or Latino residents31.4 31.5
Owner/renter occupied households by race in Hillcrest
House owners and renters - White residents 301 79.7% Owner occupied77 20.3% Renter occupiedHouse owners and renters - Black or African American residents 621 93.4% Owner occupied44 6.6% Renter occupiedHouse owners and renters - Asian residents 204 96.5% Owner occupied7 3.5% Renter occupiedHouse owners and renters - Other race residents 197 51.7% Owner occupied184 48.3% Renter occupiedHouse owners and renters - Two or more races residents 325 66.1% Owner occupied166 33.9% Renter occupiedHouse owners and renters - White alone residents 245 76.5% Owner occupied75 23.5% Renter occupiedHouse owners and renters - Hispanic or Latino residents 397 56.9% Owner occupied300 43.1% Renter occupied
Language usage in Hillcrest
English speakers - Total 38.5% of residents of Hillcrest speak English at home.
35.0% of residents speak Spanish at home 926 34.6% Speak English very well1,748 65.4% Speak English less than very well25.5% of residents speak other language at home 1,087 55.9% Speak English very well858 44.1% Speak English less than very well
English speakers - Born in the United States 91.6% of residents of Hillcrest speak English at home.
10.7% of residents speak Spanish at home 57 100.0% Speak English very well0.9% of residents speak other language at home 5 100.0% Speak English very well
English speakers - Native, born elsewhere 58.9% of residents of Hillcrest speak English at home.
9.6% of residents speak Spanish at home 20 100.0% Speak English very well33.0% of residents speak other language at home 46 66.7% Speak English very well23 33.3% Speak English less than very well
English speakers - Foreign-born 13.3% of residents of Hillcrest speak English at home.
57.5% of residents speak Spanish at home 184 9.9% Speak English very well1,675 90.1% Speak English less than very well31.9% of residents speak other language at home 430 41.6% Speak English very well603 58.4% Speak English less than very well
White (Caucasian) - Speak only English Native:
43.0% (519)Foreign-born:
4.1% (10)
White (Caucasian) - Speak another language Native:
54.8% (661)Foreign-born:
88.8% (208)
Black or African American - Speak only English Native:
77.2% (1,264)Foreign-born:
30.9% (254)
Black or African American - Speak another language Native:
22.8% (373)Foreign-born:
68.4% (562)
Asian - Speak only English Native:
47.3% (68)Foreign-born:
9.5% (37)
Asian - Speak another language Native:
51.2% (74)Foreign-born:
89.5% (351)
Other race - Speak only English Native:
29.0% (168)Foreign-born:
2.7% (37)
Other race - Speak another language Native:
68.3% (395)Foreign-born:
97.2% (1,335)
Two or more races - Speak only English Native:
61.0% (551)Foreign-born:
13.0% (82)
Two or more races - Speak another language Native:
38.9% (352)Foreign-born:
86.7% (548)
White alone - Speak only English Native:
52.6% (450)Foreign-born:
22.8% (9)
White alone - Speak another language Native:
47.5% (406)Foreign-born:
76.3% (32)
Hispanic or Latino - Speak only English Native:
41.0% (596)Foreign-born:
2.6% (49)
Hispanic or Latino - Speak another language Native:
54.9% (798)Foreign-born:
97.2% (1,805)
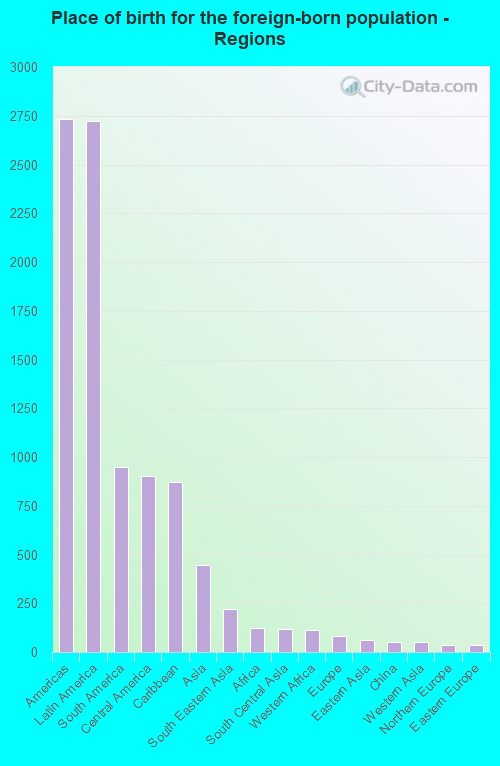
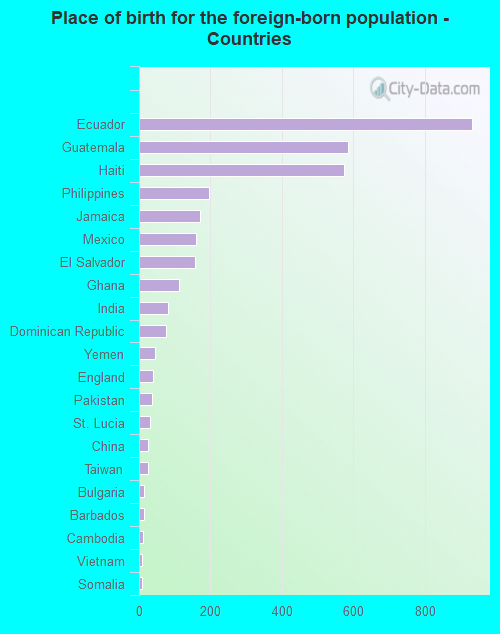
Foreign-born residents in Hillcrest 3,381 residents are foreign born (33.7% Latin America , 5.5% Asia ).
This city:
41.1%New York:
22.6%
Marital status for residents in Hillcrest Marital status - White (Caucasian) population 15 years and over
Males 52.7% Never married30.2% Now married1.7% Separated2.2% Widowed13.1% DivorcedFemales 34.1% Never married46.3% Now married1.4% Separated17.0% Widowed1.2% DivorcedWomen who did not give birth in the past 12 months Now married:
53.6% (120)Unmarried:
46.4% (104)
Marital status - Black or African American population 15 years and over
Males 43.2% Never married49.7% Now married4.0% Separated1.7% Widowed1.4% DivorcedFemales 43.3% Never married40.5% Now married5.0% Separated7.7% Widowed3.5% DivorcedWomen who did not give birth in the past 12 months Now married:
27.1% (161)Unmarried:
72.9% (434)
Marital status - Asian population 15 years and over
Males 20.4% Never married79.6% Now married0.0% Separated0.0% Widowed0.0% DivorcedFemales 32.7% Never married48.1% Now married0.0% Separated11.5% Widowed7.7% DivorcedWomen who did not give birth in the past 12 months Now married:
29.1% (32)Unmarried:
70.9% (78)
Marital status - Other race population 15 years and over
Males 42.7% Never married51.7% Now married2.7% Separated0.0% Widowed2.9% DivorcedFemales 39.4% Never married53.5% Now married0.0% Separated0.0% Widowed7.0% DivorcedWomen who gave birth in the past 12 months Now married:
100.0% (18)Unmarried:
0.0% (0)
Women who did not give birth in the past 12 months Now married:
51.1% (267)Unmarried:
48.9% (256)
Marital status - Two or more races population 15 years and over
Males 53.4% Never married22.2% Now married0.0% Separated5.7% Widowed18.8% DivorcedFemales 52.7% Never married35.0% Now married0.0% Separated1.6% Widowed10.7% DivorcedWomen who did not give birth in the past 12 months Now married:
19.6% (83)Unmarried:
80.4% (343)
Marital status - White alone, not Hispanic / Latino population 15 years and over
Males 35.0% Never married46.6% Now married1.9% Separated4.4% Widowed12.1% DivorcedFemales 22.0% Never married51.4% Now married0.0% Separated24.8% Widowed1.7% DivorcedWomen who did not give birth in the past 12 months Now married:
76.2% (97)Unmarried:
23.8% (30)
Marital status - Hispanic or Latino population 15 years and over
Males 53.1% Never married34.8% Now married1.9% Separated0.0% Widowed10.2% DivorcedFemales 44.0% Never married45.1% Now married0.6% Separated0.7% Widowed9.7% DivorcedWomen who gave birth in the past 12 months Now married:
100.0% (19)Unmarried:
0.0% (0)
Women who did not give birth in the past 12 months Now married:
38.9% (336)Unmarried:
61.1% (529)
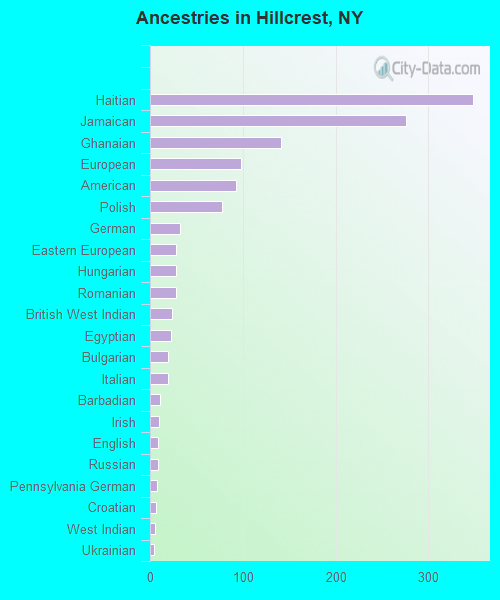
Ancestries in Hillcrest
348 7.9% Haitian276 6.3% Jamaican141 3.2% Ghanaian98 2.2% European93 2.1% American78 1.8% Polish32 0.7% German28 0.6% Eastern European28 0.6% Hungarian28 0.6% Romanian24 0.5% British West Indian23 0.5% Egyptian19 0.4% Bulgarian19 0.4% Italian11 0.3% Barbadian10 0.2% Irish9 0.2% English9 0.2% Russian8 0.2% Pennsylvania German6 0.1% Croatian5 0.1% West Indian4 0.09% Ukrainian3 0.07% Israeli2 0.05% African
Children Nativity (place of birth) in Hillcrest
Children under 6 years - Living with two parents Both parents native 206 100.0% NativeBoth parents foreign-born 50 100.0% NativeOne native, one foreign-born parent 63 100.0% NativeChildren under 6 years - Living with one parent Native parent 7 100.0% NativeForeign-born parent 63 42.9% Native83 57.1% Foreign-bornChildren 6 to 17 years - Living with two parents Both parents native 275 100.0% NativeBoth parents foreign-born 483 98.5% Native7 1.5% Foreign-bornOne native, one foreign-born parent 74 100.0% NativeChildren 6 to 17 years - Living with one parent Native parent 94 91.6% Native9 8.4% Foreign-bornForeign-born parent 118 58.3% Native84 41.7% Foreign-born
Grandparents responsible for own grandchildren in Hillcrest
Grandparents (30 to 59 years) White / Caucasian 15 100.0% Not responsible for grandchildrenBlack or African American 11 100.0% Not responsible for grandchildrenOther race 29 100.0% Not responsible for grandchildrenTwo or more races 43 100.0% Not responsible for grandchildrenHispanic or Latino 75 100.0% Not responsible for grandchildrenGrandparents (60 years and over) Black or African American 24 60.0% Responsible for grandchildren16 40.0% Not responsible for grandchildren