Races in Hillsdale, North Carolina (NC) Detailed Stats
Ancestries, Foreign-born residents, place of birth
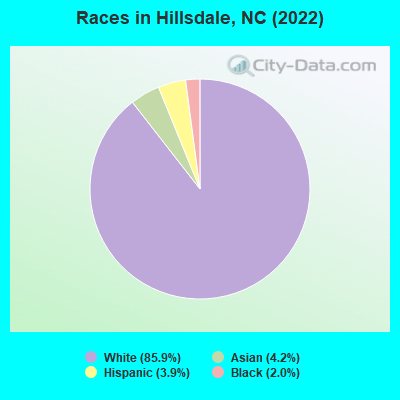
According to 2022 data, the most numerous races in Hillsdale, NC are White alone (773 residents), Black alone (18 residents), and Hispanic (35 residents). 97.0% of Hillsdale residents speak English at home.
Race distribution in Hillsdale

- 77385.9%White alone
- 384.2%Asian alone
- 353.9%Hispanic
- 182.0%Black alone
2000
2022
-
- 5,647,15570.2%White alone
- 1,723,30121.4%Black alone
- 378,9634.7%Hispanic
- 112,4161.4%Asian alone
- 95,3331.2%American Indian alone
- 79,9651.0%Two or more races
- 9,0150.1%Other race alone
- 3,1650.04%Native Hawaiian and Other
Pacific Islander alone

-
- 6,497,51960.7%White alone
- 2,155,65020.1%Black alone
- 1,114,79910.4%Hispanic
- 438,0614.1%Two or more races
- 341,0523.2%Asian alone
- 91,7580.9%American Indian alone
- 50,1800.5%Other race alone
- 9,9540.09%Native Hawaiian and Other
Pacific Islander alone

Income and house value in Hillsdale
- Median household income in 2022
- $90,816White non-Hispanic householders
- Median 2022 house value
Household income for White non-Hispanic householders

Median age by race in Hillsdale
- 51.1Median age for White residents
- 50.6Males
- 51.2Females
- 114.8Median age for Black or African American residents
- 51.4Median age for White alone residents
- 50.9Males
- 52.1Females
- 22.7Median age for Hispanic or Latino residents
Owner/renter occupied households by race in Hillsdale
- House owners and renters - White residents
- 23962.3%Owner occupied
- 14537.7%Renter occupied
- House owners and renters - Asian residents
- 43100.0%Owner occupied
- House owners and renters - White alone residents
- 24061.7%Owner occupied
- 14938.3%Renter occupied
Language usage in Hillsdale
- English speakers - Total
- 97.0% of residents of Hillsdale speak English at home.
- 0.7% of residents speak Spanish at home
- 6100.0%Speak English less than very well
- English speakers - Born in the United States
- 99.7% of residents of Hillsdale speak English at home.
- English speakers - Native, born elsewhere
- 84.4% of residents of Hillsdale speak English at home.
- 15.6% of residents speak Spanish at home
- 12100.0%Speak English less than very well
All residents speak only English at home
Foreign-born residents in Hillsdale


Marital status for residents in Hillsdale
Marital status - White (Caucasian) population 15 years and over
- Males
- 12.9%Never married
- 73.3%Now married
- 0.0%Separated
- 2.5%Widowed
- 11.3%Divorced
- Females
- 18.2%Never married
- 52.0%Now married
- 0.0%Separated
- 4.3%Widowed
- 25.5%Divorced
Women who did not give birth in the past 12 months
| Now married: | 40.2% (99) |
| Unmarried: | 59.8% (148) |
Marital status - Black or African American population 15 years and over
- Males
- 100.0%Never married
- 0.0%Now married
- 0.0%Separated
- 0.0%Widowed
- 0.0%Divorced
- Females
- 0.0%Never married
- 0.0%Now married
- 0.0%Separated
- 100.0%Widowed
- 0.0%Divorced
Marital status - White alone, not Hispanic / Latino population 15 years and over
- Males
- 12.9%Never married
- 73.3%Now married
- 0.0%Separated
- 2.5%Widowed
- 11.3%Divorced
- Females
- 14.4%Never married
- 54.5%Now married
- 0.0%Separated
- 4.5%Widowed
- 26.7%Divorced
Women who did not give birth in the past 12 months
| Now married: | 43.2% (99) |
| Unmarried: | 56.8% (130) |
Marital status - Hispanic or Latino population 15 years and over
- Males
- 0.0%Never married
- 0.0%Now married
- 0.0%Separated
- 100.0%Widowed
- 0.0%Divorced
- Females
- 100.0%Never married
- 0.0%Now married
- 0.0%Separated
- 0.0%Widowed
- 0.0%Divorced
Women who did not give birth in the past 12 months
| Now married: | 0.0% (0) |
| Unmarried: | 100.0% (25) |
Ancestries in Hillsdale

- 8520.7%American
- 8320.2%Scotch-Irish
- 5814.1%German
- 358.5%Irish
- 225.3%French Canadian
- 163.9%Russian

Geographical mobility in Hillsdale

- Same house 1 year ago
- 71591.0%White (Caucasian)
- 20100.0%Black or African American
- 40100.0%Asian
- 9100.0%Other race
- 69789.9%White alone, not Hispanic / Latino
- 38100.0%Hispanic or Latino

-
- Moved within same county
- 303.9%White / Caucasian
- 283.7%White alone, not Hispanic / Latino

-
- Moved within same state
- 496.3%White / Caucasian
- 557.1%White alone, not Hispanic / Latino

Children Nativity (place of birth) in Hillsdale
Place of birth for residents in Hillsdale
![Place of birth for the foreign-born population - Regions]()
- 23Asia
- 23Eastern Asia
- 23China
