Races in Hobart, Washington (WA) Detailed Stats
Ancestries, Foreign-born residents, place of birth
Settings
X


Recent posts about races in Hobart, Washington on our local forum with over 2,400,000 registered users:
 | Considering moving the family to Seattle (44 replies) |
| Seattle is broken. (165 replies) |
| Looking for info about lovely Seattle (55 replies) |
| Recommendation for a couple working in Seattle and Covington (14 replies) |
| Maple Valley and Bonney Lake (31 replies) |
| Husky Stadium Attendance (18 replies) |
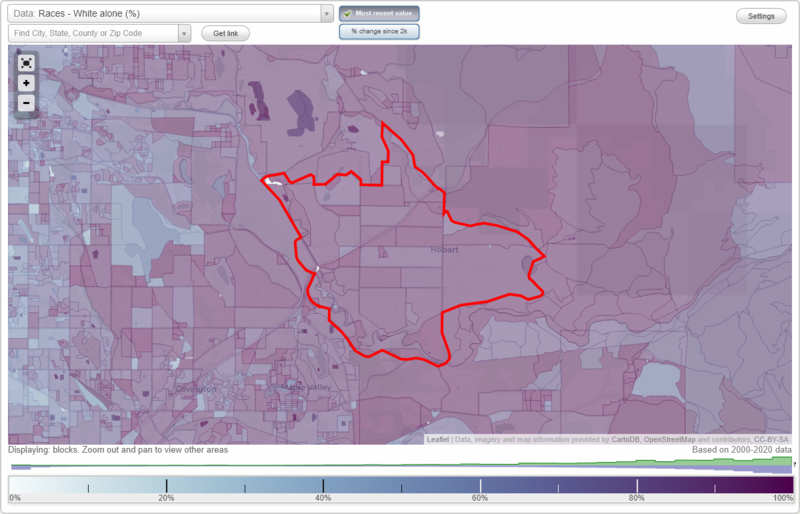
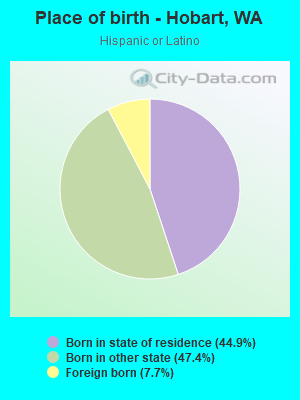
According to 2022 data, the most numerous races in Hobart, WA are White alone (5,525 residents), Hispanic (645 residents), and Asian alone (293 residents). 91.2% of Hobart residents speak English at home. 5.7% of Hobart, WA residents are foreign-born (2.9% born in Asia, 1.2% born in North America, 0.8% born in Europe), which is 165.1% less than the foreign-born rate of 15.0% across the entire state of Washington.
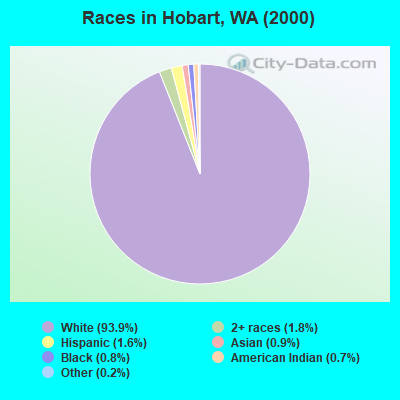
Race distribution in Hobart
2000
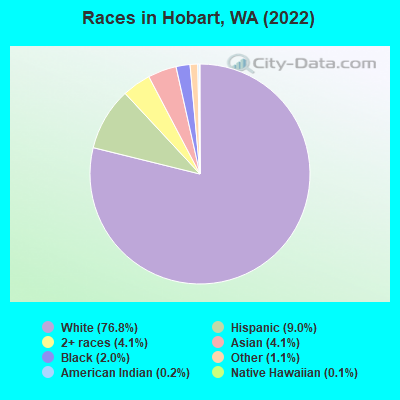
2022

- 5,87193.9%White alone
- 1121.8%Two or more races
- 1011.6%Hispanic
- 570.9%Asian alone
- 510.8%Black alone
- 410.7%American Indian alone
- 120.2%Other race alone
- 60.10%Native Hawaiian and Other
Pacific Islander alone
-
- 5,52576.8%White alone
- 6459.0%Hispanic
- 2934.1%Asian alone
- 2984.1%Two or more races
- 1442.0%Black alone
- 791.1%Other race alone
- 170.2%American Indian alone
- 100.1%Native Hawaiian and Other
Pacific Islander alone
2000
2022
-
- 4,652,49078.9%White alone
- 441,5097.5%Hispanic
- 319,4015.4%Asian alone
- 184,6313.1%Black alone
- 175,9263.0%Two or more races
- 85,3961.4%American Indian alone
- 22,7790.4%Native Hawaiian and Other
Pacific Islander alone - 11,9890.2%Other race alone

-
- 4,941,45663.5%White alone
- 1,093,31314.0%Hispanic
- 755,8329.7%Asian alone
- 523,4486.7%Two or more races
- 299,5373.8%Black alone
- 69,0240.9%American Indian alone
- 52,2310.7%Native Hawaiian and Other
Pacific Islander alone - 50,9450.7%Other race alone

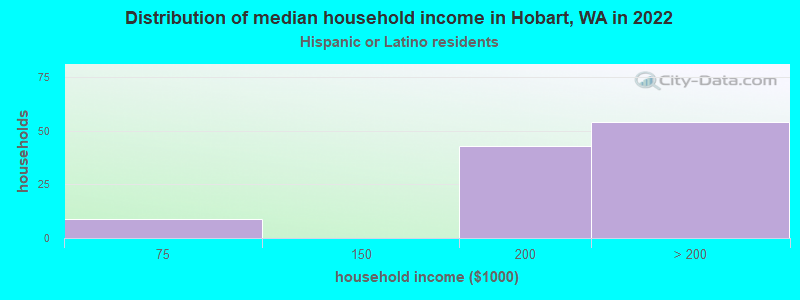
Income and house value in Hobart
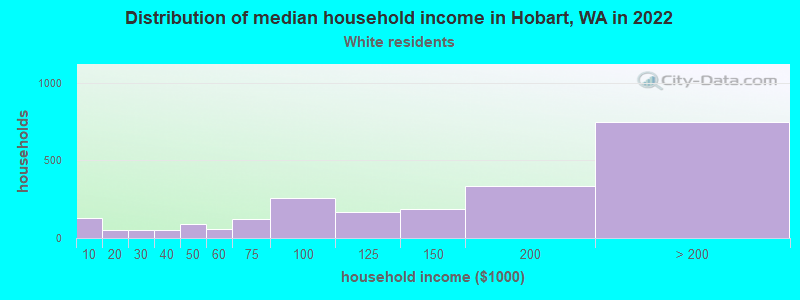
- Median household income in 2022
- $137,788White non-Hispanic householders
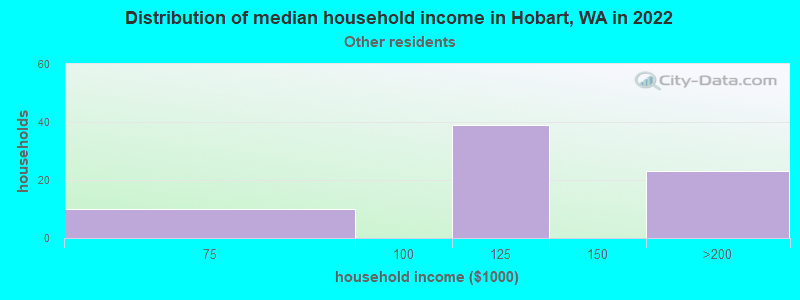
- $130,284Some other race householders
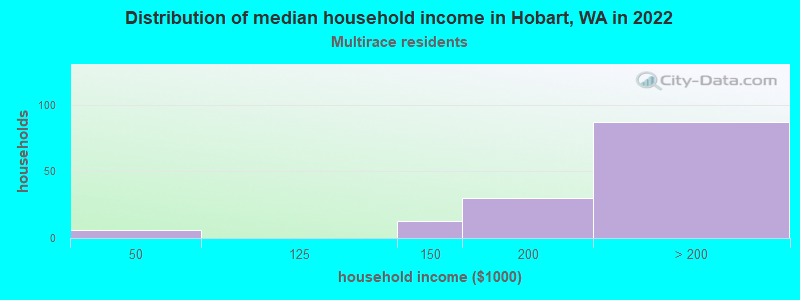
- over $200,000Two or more races householders
- over $200,000Hispanic or Latino race householders
- Median 2022 house value
- $953,095White Non-Hispanic householders
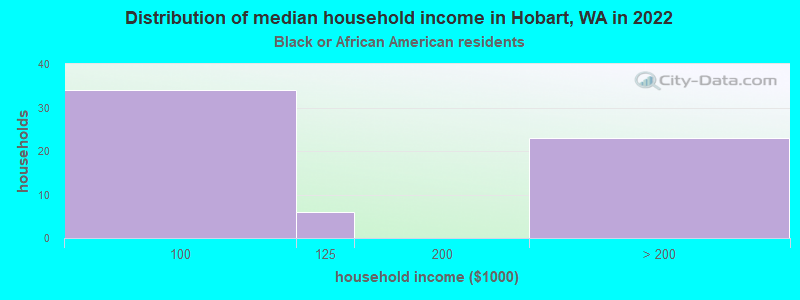
- $736,116Black or African American householders
- $497,755American Indian or Alaska Native householders
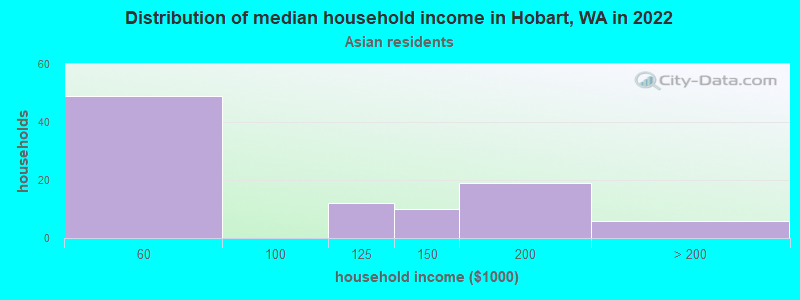
- over $1,000,000Asian householders
- $657,246Some other race householders
- over $1,000,000Two or more races householders
- $692,300Hispanic or Latino householders
Household income for White non-Hispanic householders
Household income for Black householders
Household income for Asian householders
Household income for Some other race householders
Household income for Two or more races householders
Household income for Hispanic or Latino race householders
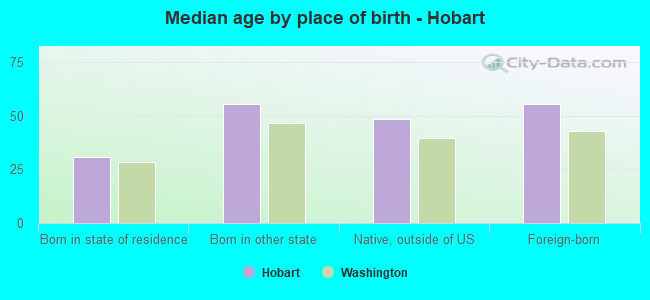
Median age by race in Hobart
- 46.3Median age for White residents
- 44.9Males
- 46.9Females
- 17.2Median age for Black or African American residents
- 28.5Males
- -697,247,705.7Females
- -639,412,997.3Median age for American Indian / Alaska Native residents
- -658,092,175.1Males
- -631,249,999.4Females
- 32.9Median age for Asian residents
- 31.0Males
- 33.2Females
- -653,927,812.5Median age for Native Hawaiian / Pacific Islander residents
- -664,509,168.7Males
- -651,945,320.1Females
- 58.4Median age for Other race residents
- 57.8Males
- 55.5Females
- 18.3Median age for Two or more races residents
- 12.7Males
- 23.9Females
- 46.7Median age for White alone residents
- 46.7Males
- 47.0Females
- 17.0Median age for Hispanic or Latino residents
- 13.0Males
- 18.7Females
Owner/renter occupied households by race in Hobart
- House owners and renters - White residents
- 2,01590.6%Owner occupied
- 2089.4%Renter occupied
- House owners and renters - Black or African American residents
- 58100.0%Owner occupied
- House owners and renters - Asian residents
- 97100.0%Owner occupied
- House owners and renters - Other race residents
- 3868.8%Owner occupied
- 1731.2%Renter occupied
- House owners and renters - Two or more races residents
- 138100.0%Owner occupied
- House owners and renters - White alone residents
- 2,01790.5%Owner occupied
- 2129.5%Renter occupied
- House owners and renters - Hispanic or Latino residents
- 8584.3%Owner occupied
- 1615.7%Renter occupied
Language usage in Hobart
- English speakers - Total
- 91.2% of residents of Hobart speak English at home.
- 1.0% of residents speak Spanish at home
- 70100.0%Speak English very well
- 5.6% of residents speak other language at home
- 24062.5%Speak English very well
- 14437.5%Speak English less than very well
- English speakers - Born in the United States
- 97.1% of residents of Hobart speak English at home.
- 0.4% of residents speak Spanish at home
- 11100.0%Speak English very well
- 1.9% of residents speak other language at home
- 48100.0%Speak English very well
- English speakers - Native, born elsewhere
- 72.6% of residents of Hobart speak English at home.
- 15.3% of residents speak Spanish at home
- 19100.0%Speak English very well
- 10.5% of residents speak other language at home
- 13100.0%Speak English very well
- English speakers - Foreign-born
- 25.6% of residents of Hobart speak English at home.
- 10.8% of residents speak Spanish at home
- 44100.0%Speak English very well
- 63.4% of residents speak other language at home
- 13853.5%Speak English very well
- 12046.5%Speak English less than very well
White (Caucasian) - Speak only English
| Native: | 98.1% (5,235) |
| Foreign-born: | 58.1% (75) |
White (Caucasian) - Speak another language
| Native: | 2.0% (107) |
| Foreign-born: | 41.0% (53) |
Asian - Speak only English
| Native: | 94.3% (22) |
| Foreign-born: | 6.2% (12) |
Two or more races - Speak only English
| Native: | 95.4% (591) |
| Foreign-born: | 18.6% (10) |
Two or more races - Speak another language
| Native: | 2.4% (15) |
| Foreign-born: | 81.3% (45) |
White alone - Speak only English
| Native: | 97.5% (5,115) |
| Foreign-born: | 53.6% (76) |
White alone - Speak another language
| Native: | 2.4% (124) |
| Foreign-born: | 42.8% (61) |
Hispanic or Latino - Speak only English
| Native: | 97.1% (545) |
| Foreign-born: | 14.9% (7) |
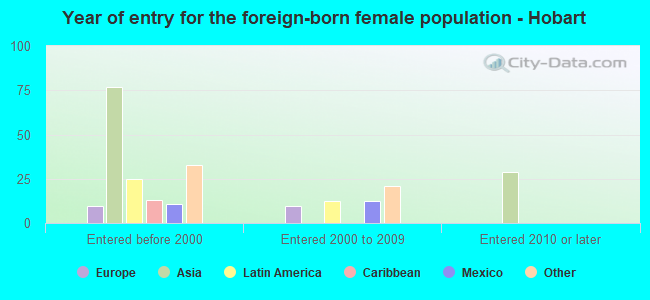
Foreign-born residents in Hobart
407 residents are foreign born (2.9% Asia, 1.2% North America, 0.8% Europe).
| This city: | 5.7% |
| Washington: | 14.9% |
Marital status for residents in Hobart
Marital status - White (Caucasian) population 15 years and over
- Males
- 22.4%Never married
- 65.6%Now married
- 1.9%Separated
- 1.2%Widowed
- 9.0%Divorced
- Females
- 22.0%Never married
- 63.6%Now married
- 0.5%Separated
- 5.9%Widowed
- 8.0%Divorced
Women who gave birth in the past 12 months
| Now married: | 100.0% (6) |
| Unmarried: | 0.0% (0) |
Women who did not give birth in the past 12 months
| Now married: | 52.5% (554) |
| Unmarried: | 47.5% (500) |
Marital status - Black or African American population 15 years and over
- Males
- 31.4%Never married
- 68.6%Now married
- 0.0%Separated
- 0.0%Widowed
- 0.0%Divorced
- Females
- 51.4%Never married
- 48.6%Now married
- 0.0%Separated
- 0.0%Widowed
- 0.0%Divorced
Women who did not give birth in the past 12 months
| Now married: | 48.6% (36) |
| Unmarried: | 51.4% (38) |
Marital status - Asian population 15 years and over
- Males
- 12.0%Never married
- 75.9%Now married
- 0.0%Separated
- 0.0%Widowed
- 12.0%Divorced
- Females
- 0.0%Never married
- 90.3%Now married
- 0.0%Separated
- 9.7%Widowed
- 0.0%Divorced
Women who did not give birth in the past 12 months
| Now married: | 100.0% (47) |
| Unmarried: | 0.0% (0) |
Marital status - Other race population 15 years and over
- Males
- 0.0%Never married
- 84.2%Now married
- 0.0%Separated
- 0.0%Widowed
- 15.8%Divorced
- Females
- 0.0%Never married
- 100.0%Now married
- 0.0%Separated
- 0.0%Widowed
- 0.0%Divorced
Women who did not give birth in the past 12 months
| Now married: | 100.0% (16) |
| Unmarried: | 0.0% (0) |
Marital status - Two or more races population 15 years and over
- Males
- 38.5%Never married
- 61.5%Now married
- 0.0%Separated
- 0.0%Widowed
- 0.0%Divorced
- Females
- 48.4%Never married
- 51.6%Now married
- 0.0%Separated
- 0.0%Widowed
- 0.0%Divorced
Women who did not give birth in the past 12 months
| Now married: | 42.6% (111) |
| Unmarried: | 57.4% (149) |
Marital status - White alone, not Hispanic / Latino population 15 years and over
- Males
- 21.3%Never married
- 66.3%Now married
- 2.0%Separated
- 1.2%Widowed
- 9.2%Divorced
- Females
- 22.4%Never married
- 63.0%Now married
- 0.5%Separated
- 6.0%Widowed
- 8.1%Divorced
Women who gave birth in the past 12 months
| Now married: | 100.0% (7) |
| Unmarried: | 0.0% (0) |
Women who did not give birth in the past 12 months
| Now married: | 51.2% (541) |
| Unmarried: | 48.8% (515) |
Marital status - Hispanic or Latino population 15 years and over
- Males
- 35.5%Never married
- 58.0%Now married
- 0.0%Separated
- 0.0%Widowed
- 6.5%Divorced
- Females
- 41.4%Never married
- 58.6%Now married
- 0.0%Separated
- 0.0%Widowed
- 0.0%Divorced
Women who did not give birth in the past 12 months
| Now married: | 48.0% (87) |
| Unmarried: | 52.0% (95) |
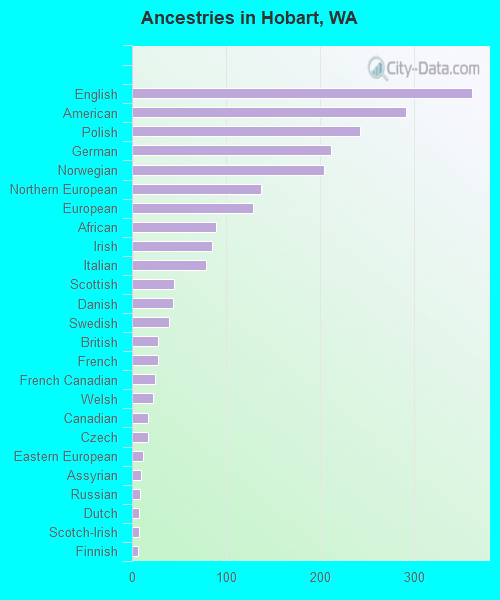
Ancestries in Hobart

- 36211.9%English
- 2929.6%American
- 2438.0%Polish
- 2126.9%German
- 2046.7%Norwegian
- 1374.5%Northern European
- 1294.2%European
- 892.9%African
- 852.8%Irish
- 792.6%Italian
- 451.5%Scottish
- 441.4%Danish
- 391.3%Swedish
- 280.9%British
- 280.9%French
- 250.8%French Canadian
- 220.7%Welsh
- 170.6%Canadian
- 170.6%Czech
- 120.4%Eastern European
- 100.3%Assyrian
- 80.3%Russian
- 70.2%Dutch
- 70.2%Scotch-Irish
- 60.2%Finnish
- 60.2%Swiss
- 50.2%Scandinavian
- 30.10%Croatian
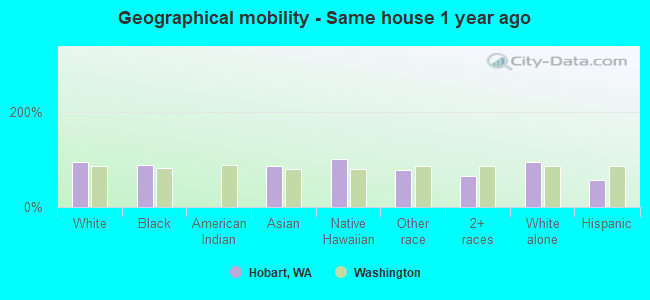
Geographical mobility in Hobart

- Same house 1 year ago
- 5,22993.5%White (Caucasian)
- 12788.4%Black or African American
- 26084.8%Asian
- 11100.0%Native Hawaiian / Pacific Islander
- 9978.3%Other race
- 48866.2%Two or more races
- 5,20394.1%White alone, not Hispanic / Latino
- 36557.4%Hispanic or Latino
-
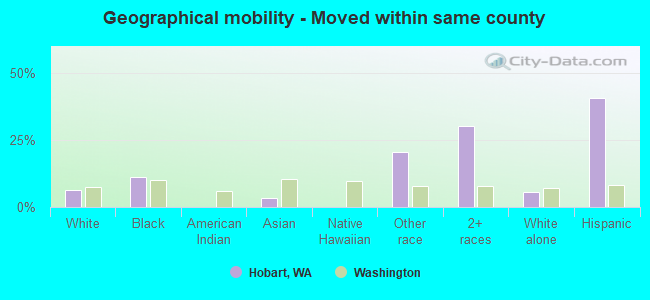
- Moved within same county
- 3526.3%White / Caucasian
- 1611.2%Black or African American
- 103.2%Asian
- 2620.5%Other race
- 22230.2%Two or more races
- 3125.6%White alone, not Hispanic / Latino
- 25940.7%Hispanic or Latino
-
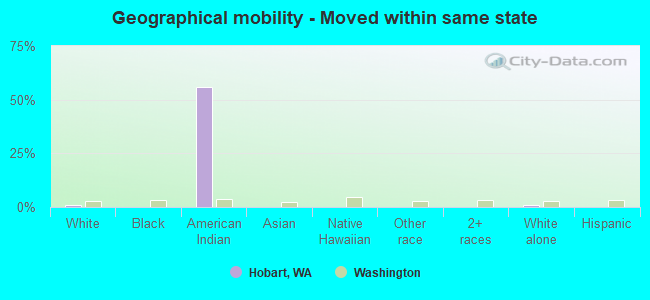
- Moved within same state
- 480.9%White / Caucasian
- 1155.7%American Indian / Alaska Native
- 500.9%White alone, not Hispanic / Latino
-
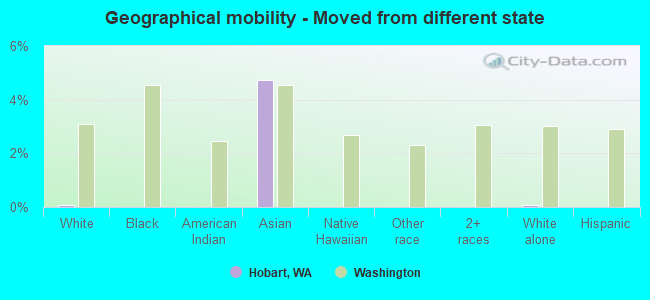
- Moved from different state
- 40.1%White / Caucasian
- 144.7%Asian
- 50.1%White alone, not Hispanic / Latino
-
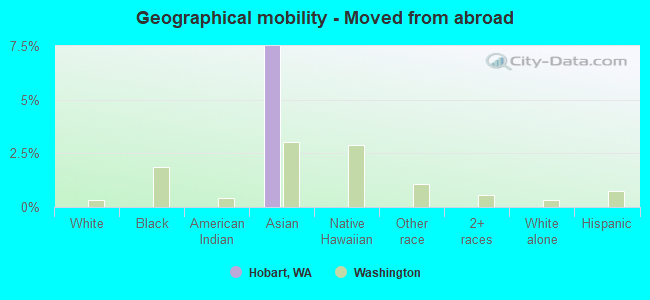
- Moved from abroad
- 237.5%Asian
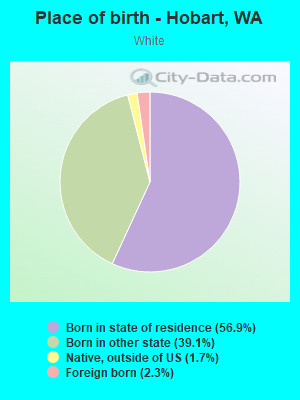
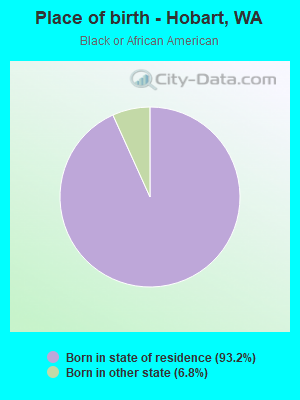
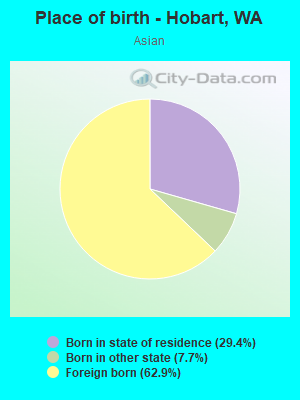
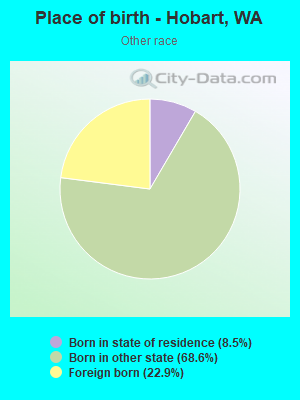
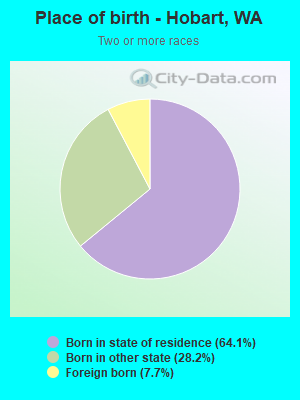
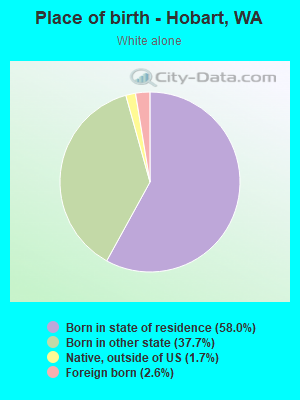
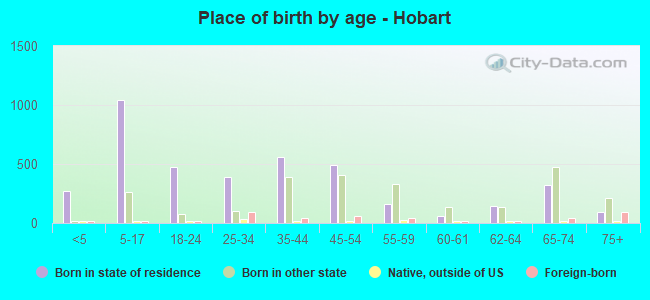
Children Nativity (place of birth) in Hobart
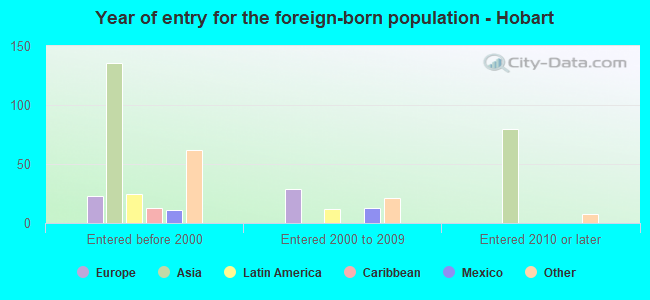
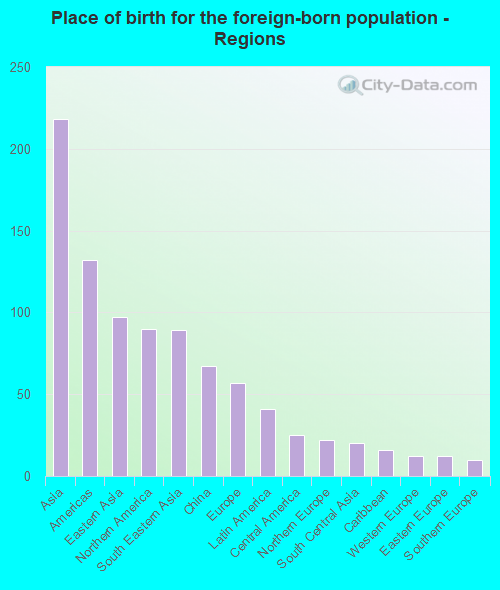
Place of birth for residents in Hobart
![Place of birth for the foreign-born population - Regions]()
- 218Asia
- 132Americas
- 97Eastern Asia
- 90Northern America
- 89South Eastern Asia
- 67China
- 57Europe
- 41Latin America
- 25Central America
- 22Northern Europe
- 20South Central Asia
- 16Caribbean
- 12Western Europe
- 12Eastern Europe
- 10Southern Europe
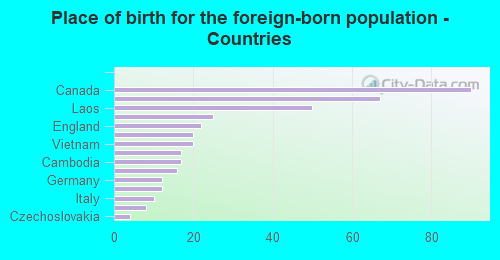
![Place of birth for the foreign-born population - Countries]()
- 90Canada
- 67China
- 50Laos
- 25Mexico
- 22England
- 20India
- 20Vietnam
- 17Japan
- 17Cambodia
- 16Cuba
- 12Germany
- 12Korea
- 10Italy
- 8Russia
- 4Czechoslovakia
Zip codes: 98051.