Races in Hoffman Estates, Illinois (IL) Detailed Stats
Data:
Races - White alone (%)
Races - White alone (% change since 2000)
Races - Black alone (%)
Races - Black alone (% change since 2000)
Races - American Indian alone (%)
Races - American Indian alone (% change since 2000)
Races - Asian alone (%)
Races - Asian alone (% change since 2000)
Races - Hispanic (%)
Races - Hispanic (% change since 2000)
Races - Native Hawaiian and Other Pacific Islander alone (%)
Races - Native Hawaiian and Other Pacific Islander alone (% change since 2000)
Races - Two or more races(%)
Races - Two or more races(% change since 2000)
Races - Other race alone (%)
Races - Other race alone (% change since 2000)
Racial diversity
Place of birth - Born in state of residence (%)
Place of birth - Born in state of residence (%) - White
Place of birth - Born in state of residence (%) - Black or African American
Place of birth - Born in state of residence (%) - Asian
Place of birth - Born in state of residence (%) - Hispanic or Latino
Place of birth - Born in state of residence (%) - American Indian and Alaska Native
Place of birth - Born in state of residence (%) - Multirace
Place of birth - Born in state of residence (%) - Other Race
Place of birth - Born in other state (%)
Place of birth - Born in other state (%) - White
Place of birth - Born in other state (%) - Black or African American
Place of birth - Born in other state (%) - Asian
Place of birth - Born in other state (%) - Hispanic or Latino
Place of birth - Born in other state (%) - American Indian and Alaska Native
Place of birth - Born in other state (%) - Multirace
Place of birth - Born in other state (%) - Other Race
Place of birth - Native, outside of US (%)
Place of birth - Native, outside of US (%) - White
Place of birth - Native, outside of US (%) - Black or African American
Place of birth - Native, outside of US (%) - Asian
Place of birth - Native, outside of US (%) - Hispanic or Latino
Place of birth - Native, outside of US (%) - American Indian and Alaska Native
Place of birth - Native, outside of US (%) - Multirace
Place of birth - Native, outside of US (%) - Other Race
Place of birth - Foreign born (%)
Place of birth - Foreign born (%) - White
Place of birth - Foreign born (%) - Black or African American
Place of birth - Foreign born (%) - Asian
Place of birth - Foreign born (%) - Hispanic or Latino
Place of birth - Foreign born (%) - American Indian and Alaska Native
Place of birth - Foreign born (%) - Multirace
Place of birth - Foreign born (%) - Other Race
Residents speaking English at home (%)
Residents speaking English at home - Born in the United States (%)
Residents speaking English at home - Native, born elsewhere (%)
Residents speaking English at home - Foreign born (%)
Residents speaking Spanish at home (%)
Residents speaking Spanish at home - Born in the United States (%)
Residents speaking Spanish at home - Native, born elsewhere (%)
Residents speaking Spanish at home - Foreign born (%)
Residents speaking other language at home (%)
Residents speaking other language at home - Born in the United States (%)
Residents speaking other language at home - Native, born elsewhere (%)
Residents speaking other language at home - Foreign born (%)
Marital status - Never married (%)
Marital status - Now married (%)
Marital status - Separated (%)
Marital status - Widowed (%)
Marital status - Divorced (%)
Ancestries Reported - Arab (%)
Ancestries Reported - Czech (%)
Ancestries Reported - Danish (%)
Ancestries Reported - Dutch (%)
Ancestries Reported - English (%)
Ancestries Reported - French (%)
Ancestries Reported - French Canadian (%)
Ancestries Reported - German (%)
Ancestries Reported - Greek (%)
Ancestries Reported - Hungarian (%)
Ancestries Reported - Irish (%)
Ancestries Reported - Italian (%)
Ancestries Reported - Lithuanian (%)
Ancestries Reported - Norwegian (%)
Ancestries Reported - Polish (%)
Ancestries Reported - Portuguese (%)
Ancestries Reported - Russian (%)
Ancestries Reported - Scotch-Irish (%)
Ancestries Reported - Scottish (%)
Ancestries Reported - Slovak (%)
Ancestries Reported - Subsaharan African (%)
Ancestries Reported - Swedish (%)
Ancestries Reported - Swiss (%)
Ancestries Reported - Ukrainian (%)
Ancestries Reported - United States (%)
Ancestries Reported - Welsh (%)
Ancestries Reported - West Indian (%)
Ancestries Reported - Other (%)
Geographical mobility - Same house 1 year ago (%)
Geographical mobility - Same house 1 year ago (%) - White
Geographical mobility - Same house 1 year ago (%) - Black or African American
Geographical mobility - Same house 1 year ago (%) - Asian
Geographical mobility - Same house 1 year ago (%) - Hispanic or Latino
Geographical mobility - Same house 1 year ago (%) - American Indian and Alaska Native
Geographical mobility - Same house 1 year ago (%) - Multirace
Geographical mobility - Same house 1 year ago (%) - Other Race
Geographical mobility - Moved within same county (%)
Geographical mobility - Moved within same county (%) - White
Geographical mobility - Moved within same county (%) - Black or African American
Geographical mobility - Moved within same county (%) - Asian
Geographical mobility - Moved within same county (%) - Hispanic or Latino
Geographical mobility - Moved within same county (%) - American Indian and Alaska Native
Geographical mobility - Moved within same county (%) - Multirace
Geographical mobility - Moved within same county (%) - Other Race
Geographical mobility - Moved from different county within same state (%)
Geographical mobility - Moved from different county within same state (%) - White
Geographical mobility - Moved from different county within same state (%) - Black or African American
Geographical mobility - Moved from different county within same state (%) - Asian
Geographical mobility - Moved from different county within same state (%) - Hispanic or Latino
Geographical mobility - Moved from different county within same state (%) - American Indian and Alaska Native
Geographical mobility - Moved from different county within same state (%) - Multirace
Geographical mobility - Moved from different county within same state (%) - Other Race
Geographical mobility - Moved from different state (%)
Geographical mobility - Moved from different state (%) - White
Geographical mobility - Moved from different state (%) - Black or African American
Geographical mobility - Moved from different state (%) - Asian
Geographical mobility - Moved from different state (%) - Hispanic or Latino
Geographical mobility - Moved from different state (%) - American Indian and Alaska Native
Geographical mobility - Moved from different state (%) - Multirace
Geographical mobility - Moved from different state (%) - Other Race
Geographical mobility - Moved from abroad (%)
Geographical mobility - Moved from abroad (%) - White
Geographical mobility - Moved from abroad (%) - Black or African American
Geographical mobility - Moved from abroad (%) - Asian
Geographical mobility - Moved from abroad (%) - Hispanic or Latino
Geographical mobility - Moved from abroad (%) - American Indian and Alaska Native
Geographical mobility - Moved from abroad (%) - Multirace
Geographical mobility - Moved from abroad (%) - Other Race
Place of birth for the foreign-born population - Ireland (%)
Place of birth for the foreign-born population - Denmark (%)
Place of birth for the foreign-born population - Norway (%)
Place of birth for the foreign-born population - Sweden (%)
Place of birth for the foreign-born population - United Kingdom (%)
Place of birth for the foreign-born population - England (%)
Place of birth for the foreign-born population - Scotland (%)
Place of birth for the foreign-born population - Other Northern Europe (%)
Place of birth for the foreign-born population - Austria (%)
Place of birth for the foreign-born population - Belgium (%)
Place of birth for the foreign-born population - France (%)
Place of birth for the foreign-born population - Germany (%)
Place of birth for the foreign-born population - Netherlands (%)
Place of birth for the foreign-born population - Switzerland (%)
Place of birth for the foreign-born population - Other Western Europe (%)
Place of birth for the foreign-born population - Greece (%)
Place of birth for the foreign-born population - Italy (%)
Place of birth for the foreign-born population - Portugal (%)
Place of birth for the foreign-born population - Spain (%)
Place of birth for the foreign-born population - Other Southern Europe (%)
Place of birth for the foreign-born population - Albania (%)
Place of birth for the foreign-born population - Belarus (%)
Place of birth for the foreign-born population - Bosnia and Herzegovina (%)
Place of birth for the foreign-born population - Bulgaria (%)
Place of birth for the foreign-born population - Croatia (%)
Place of birth for the foreign-born population - Czechoslovakia (%)
Place of birth for the foreign-born population - Hungary (%)
Place of birth for the foreign-born population - Latvia (%)
Place of birth for the foreign-born population - Lithuania (%)
Place of birth for the foreign-born population - North Macedonia (Macedonia) (%)
Place of birth for the foreign-born population - Moldova (%)
Place of birth for the foreign-born population - Poland (%)
Place of birth for the foreign-born population - Romania (%)
Place of birth for the foreign-born population - Russia (%)
Place of birth for the foreign-born population - Serbia (%)
Place of birth for the foreign-born population - Ukraine (%)
Place of birth for the foreign-born population - Other Eastern Europe (%)
Place of birth for the foreign-born population - China (%)
Place of birth for the foreign-born population - Hong Kong (%)
Place of birth for the foreign-born population - Taiwan (%)
Place of birth for the foreign-born population - Japan (%)
Place of birth for the foreign-born population - Korea (%)
Place of birth for the foreign-born population - Other Eastern Asia (%)
Place of birth for the foreign-born population - Afghanistan (%)
Place of birth for the foreign-born population - Bangladesh (%)
Place of birth for the foreign-born population - India (%)
Place of birth for the foreign-born population - Iran (%)
Place of birth for the foreign-born population - Kazakhstan (%)
Place of birth for the foreign-born population - Nepal (%)
Place of birth for the foreign-born population - Pakistan (%)
Place of birth for the foreign-born population - Sri Lanka (%)
Place of birth for the foreign-born population - Uzbekistan (%)
Place of birth for the foreign-born population - Other South Central Asia (%)
Place of birth for the foreign-born population - Burma (%)
Place of birth for the foreign-born population - Cambodia (%)
Place of birth for the foreign-born population - Indonesia (%)
Place of birth for the foreign-born population - Laos (%)
Place of birth for the foreign-born population - Malaysia (%)
Place of birth for the foreign-born population - Philippines (%)
Place of birth for the foreign-born population - Singapore (%)
Place of birth for the foreign-born population - Thailand (%)
Place of birth for the foreign-born population - Vietnam (%)
Place of birth for the foreign-born population - Other South Eastern Asia (%)
Place of birth for the foreign-born population - Armenia (%)
Place of birth for the foreign-born population - Iraq (%)
Place of birth for the foreign-born population - Israel (%)
Place of birth for the foreign-born population - Jordan (%)
Place of birth for the foreign-born population - Kuwait (%)
Place of birth for the foreign-born population - Lebanon (%)
Place of birth for the foreign-born population - Saudi Arabia (%)
Place of birth for the foreign-born population - Syria (%)
Place of birth for the foreign-born population - Turkey (%)
Place of birth for the foreign-born population - Yemen (%)
Place of birth for the foreign-born population - Other Western Asia (%)
Place of birth for the foreign-born population - Eritrea (%)
Place of birth for the foreign-born population - Ethiopia (%)
Place of birth for the foreign-born population - Kenya (%)
Place of birth for the foreign-born population - Somalia (%)
Place of birth for the foreign-born population - Uganda (%)
Place of birth for the foreign-born population - Zimbabwe (%)
Place of birth for the foreign-born population - Other Eastern Africa (%)
Place of birth for the foreign-born population - Cameroon (%)
Place of birth for the foreign-born population - Congo (%)
Place of birth for the foreign-born population - Democratic Republic of Congo (Zaire) (%)
Place of birth for the foreign-born population - Other Middle Africa (%)
Place of birth for the foreign-born population - Egypt (%)
Place of birth for the foreign-born population - Morocco (%)
Place of birth for the foreign-born population - Sudan (%)
Place of birth for the foreign-born population - Other Northern Africa (%)
Place of birth for the foreign-born population - South Africa (%)
Place of birth for the foreign-born population - Other Southern Africa (%)
Place of birth for the foreign-born population - Cabo Verde (%)
Place of birth for the foreign-born population - Ghana (%)
Place of birth for the foreign-born population - Liberia (%)
Place of birth for the foreign-born population - Nigeria (%)
Place of birth for the foreign-born population - Senegal (%)
Place of birth for the foreign-born population - Sierra Leone (%)
Place of birth for the foreign-born population - Other Western Africa (%)
Place of birth for the foreign-born population - Australia (%)
Place of birth for the foreign-born population - New Zealand (%)
Place of birth for the foreign-born population - Fiji (%)
Place of birth for the foreign-born population - Micronesia (%)
Place of birth for the foreign-born population - Bahamas (%)
Place of birth for the foreign-born population - Barbados (%)
Place of birth for the foreign-born population - Cuba (%)
Place of birth for the foreign-born population - Dominica (%)
Place of birth for the foreign-born population - Dominican Republic (%)
Place of birth for the foreign-born population - Grenada (%)
Place of birth for the foreign-born population - Haiti (%)
Place of birth for the foreign-born population - Jamaica (%)
Place of birth for the foreign-born population - St. Vincent and the Grenadines (%)
Place of birth for the foreign-born population - Trinidad and Tobago (%)
Place of birth for the foreign-born population - West Indies (%)
Place of birth for the foreign-born population - Other Caribbean (%)
Place of birth for the foreign-born population - Belize (%)
Place of birth for the foreign-born population - Costa Rica (%)
Place of birth for the foreign-born population - El Salvador (%)
Place of birth for the foreign-born population - Guatemala (%)
Place of birth for the foreign-born population - Honduras (%)
Place of birth for the foreign-born population - Mexico (%)
Place of birth for the foreign-born population - Nicaragua (%)
Place of birth for the foreign-born population - Panama (%)
Place of birth for the foreign-born population - Other Central America (%)
Place of birth for the foreign-born population - Argentina (%)
Place of birth for the foreign-born population - Bolivia (%)
Place of birth for the foreign-born population - Brazil (%)
Place of birth for the foreign-born population - Chile (%)
Place of birth for the foreign-born population - Colombia (%)
Place of birth for the foreign-born population - Ecuador (%)
Place of birth for the foreign-born population - Guyana (%)
Place of birth for the foreign-born population - Peru (%)
Place of birth for the foreign-born population - Uruguay (%)
Place of birth for the foreign-born population - Venezuela (%)
Place of birth for the foreign-born population - Other South America (%)
Place of birth for the foreign-born population - Canada (%)
Place of birth for the foreign-born population - Other Northern America (%)
Place of birth for the foreign-born population - Other (%)
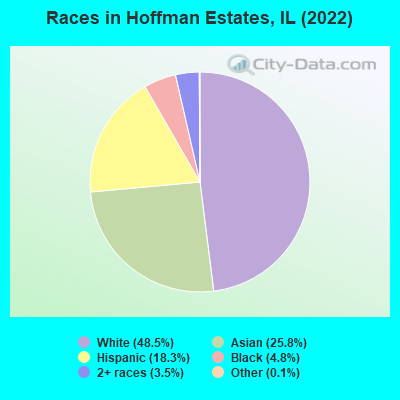
According to 2022 data, the most numerous races in Hoffman Estates, IL are White alone (24,544 residents), Hispanic (9,280 residents), and Black alone (2,418 residents). 53.8% of Hoffman Estates residents speak English at home. 33.5% of Hoffman Estates, IL residents are foreign-born (18.4% born in Asia, 7.6% born in Latin America, 5.3% born in Europe), which is 58.2% greater than the foreign-born rate of 14.0% across the entire state of Illinois.
Race distribution in Hoffman Estates
2000 2022
8,424,140 67.8% White alone 1,856,152 14.9% Black alone 1,530,262 12.3% Hispanic 419,916 3.4% Asian alone 153,996 1.2% Two or more races 13,479 0.1% Other race alone 18,232 0.1% American Indian alone 3,116 0.03% Native Hawaiian and Other
7,356,301 58.5% White alone 2,299,726 18.3% Hispanic 1,660,423 13.2% Black alone 747,296 5.9% Asian alone 458,599 3.6% Two or more races 45,386 0.4% Other race alone 10,405 0.08% American Indian alone 3,896 0.03% Native Hawaiian and Other
Income and house value in Hoffman Estates Median household income in 2022 $114,516 White non-Hispanic householders$73,304 Black householders$110,758 Asian householders$99,528 Some other race householders$80,861 Two or more races householders$86,063 Hispanic or Latino race householdersMedian 2022 house value $352,786 White Non-Hispanic householders$245,625 Black or African American householders$338,191 American Indian or Alaska Native householders $360,852 Asian householders$293,444 Some other race householders$237,751 Two or more races householders$289,411 Hispanic or Latino householders
Median age by race in Hoffman Estates
43.9 Median age for White residents43.2 44.7 33.0 Median age for Black or African American residents31.9 33.5 9.8 Median age for American Indian / Alaska Native residents10.5 -641,399,416.3 42.4 Median age for Asian residents42.5 42.3 -687,999,999.3 Median age for Native Hawaiian / Pacific Islander residents-918,721,460.3 -610,229,276.3 30.2 Median age for Other race residents29.3 36.1 27.1 Median age for Two or more races residents24.3 30.8 45.5 Median age for White alone residents45.7 45.0 28.8 Median age for Hispanic or Latino residents25.5 32.5
Owner/renter occupied households by race in Hoffman Estates
House owners and renters - White residents 8,334 81.5% Owner occupied1,889 18.5% Renter occupiedHouse owners and renters - Black or African American residents 402 39.0% Owner occupied630 61.0% Renter occupiedHouse owners and renters - American Indian / Alaska Native residents 11 59.6% Owner occupied8 40.4% Renter occupiedHouse owners and renters - Asian residents 3,376 73.4% Owner occupied1,221 26.6% Renter occupiedHouse owners and renters - Other race residents 879 65.9% Owner occupied455 34.1% Renter occupiedHouse owners and renters - Two or more races residents 762 53.6% Owner occupied661 46.4% Renter occupiedHouse owners and renters - White alone residents 8,527 82.3% Owner occupied1,838 17.7% Renter occupiedHouse owners and renters - Hispanic or Latino residents 1,375 59.2% Owner occupied948 40.8% Renter occupied
Language usage in Hoffman Estates
English speakers - Total 53.8% of residents of Hoffman Estates speak English at home.
14.6% of residents speak Spanish at home 4,634 66.9% Speak English very well2,288 33.1% Speak English less than very well32.1% of residents speak other language at home 9,939 65.3% Speak English very well5,270 34.7% Speak English less than very well
English speakers - Born in the United States 85.9% of residents of Hoffman Estates speak English at home.
8.9% of residents speak Spanish at home 355 70.7% Speak English very well147 29.3% Speak English less than very well5.4% of residents speak other language at home 271 89.4% Speak English very well32 10.6% Speak English less than very well
English speakers - Native, born elsewhere 36.5% of residents of Hoffman Estates speak English at home.
39.8% of residents speak Spanish at home 241 68.3% Speak English very well112 31.7% Speak English less than very well23.8% of residents speak other language at home 168 79.6% Speak English very well43 20.4% Speak English less than very well
English speakers - Foreign-born 7.4% of residents of Hoffman Estates speak English at home.
21.4% of residents speak Spanish at home 1,784 49.2% Speak English very well1,843 50.8% Speak English less than very well71.1% of residents speak other language at home 7,185 59.7% Speak English very well4,852 40.3% Speak English less than very well
White (Caucasian) - Speak only English Native:
94.2% (18,265)Foreign-born:
10.7% (367)
White (Caucasian) - Speak another language Native:
7.4% (1,426)Foreign-born:
89.0% (3,048)
Black or African American - Speak only English Native:
90.2% (1,707)Foreign-born:
41.3% (174)
Black or African American - Speak another language Native:
10.0% (189)Foreign-born:
59.6% (251)
Asian - Speak only English Native:
44.0% (1,416)Foreign-born:
6.0% (554)
Asian - Speak another language Native:
55.9% (1,800)Foreign-born:
94.8% (8,804)
Other race - Speak only English Native:
29.0% (675)Foreign-born:
2.0% (36)
Other race - Speak another language Native:
71.4% (1,663)Foreign-born:
98.4% (1,830)
Two or more races - Speak only English Native:
63.0% (2,140)Foreign-born:
5.9% (107)
Two or more races - Speak another language Native:
36.0% (1,223)Foreign-born:
94.1% (1,713)
White alone - Speak only English Native:
92.8% (18,249)Foreign-born:
11.6% (402)
White alone - Speak another language Native:
7.1% (1,389)Foreign-born:
88.8% (3,077)
Hispanic or Latino - Speak only English Native:
36.3% (1,713)Foreign-born:
2.7% (102)
Hispanic or Latino - Speak another language Native:
63.9% (3,012)Foreign-born:
97.5% (3,650)
Foreign-born residents in Hoffman Estates 16,964 residents are foreign born (18.4% Asia , 7.6% Latin America , 5.3% Europe ).
This city:
33.5%Illinois:
14.1%
Marital status for residents in Hoffman Estates Marital status - White (Caucasian) population 15 years and over
Males 31.1% Never married60.0% Now married0.5% Separated2.1% Widowed6.4% DivorcedFemales 21.7% Never married59.3% Now married2.1% Separated6.7% Widowed10.3% DivorcedWomen who gave birth in the past 12 months Now married:
88.3% (224)Unmarried:
11.7% (30)
Women who did not give birth in the past 12 months Now married:
53.5% (2,525)Unmarried:
46.5% (2,192)
Marital status - Black or African American population 15 years and over
Males 37.3% Never married51.0% Now married0.9% Separated0.9% Widowed10.1% DivorcedFemales 51.4% Never married30.3% Now married7.6% Separated4.1% Widowed6.6% DivorcedWomen who gave birth in the past 12 months Now married:
69.9% (123)Unmarried:
30.1% (53)
Women who did not give birth in the past 12 months Now married:
26.8% (152)Unmarried:
73.2% (415)
Marital status - American Indian / Alaska Native population 15 years and over
Males 0.0% Never married60.0% Now married0.0% Separated0.0% Widowed40.0% DivorcedFemales 100.0% Never married0.0% Now married0.0% Separated0.0% Widowed0.0% DivorcedWomen who did not give birth in the past 12 months Now married:
0.0% (0)Unmarried:
100.0% (18)
Marital status - Asian population 15 years and over
Males 25.4% Never married65.8% Now married0.5% Separated3.0% Widowed5.3% DivorcedFemales 20.6% Never married62.8% Now married0.3% Separated7.1% Widowed9.2% DivorcedWomen who gave birth in the past 12 months Now married:
100.0% (148)Unmarried:
0.0% (0)
Women who did not give birth in the past 12 months Now married:
57.3% (1,877)Unmarried:
42.7% (1,399)
Marital status - Other race population 15 years and over
Males 39.9% Never married57.4% Now married0.0% Separated0.7% Widowed2.0% DivorcedFemales 35.1% Never married53.3% Now married4.6% Separated2.2% Widowed4.8% DivorcedWomen who gave birth in the past 12 months Now married:
100.0% (133)Unmarried:
0.0% (0)
Women who did not give birth in the past 12 months Now married:
45.5% (593)Unmarried:
54.5% (709)
Marital status - Two or more races population 15 years and over
Males 47.2% Never married41.4% Now married0.6% Separated3.2% Widowed7.6% DivorcedFemales 48.5% Never married43.2% Now married4.7% Separated2.4% Widowed1.2% DivorcedWomen who gave birth in the past 12 months Now married:
60.5% (36)Unmarried:
39.5% (24)
Women who did not give birth in the past 12 months Now married:
46.6% (610)Unmarried:
53.4% (699)
Marital status - White alone, not Hispanic / Latino population 15 years and over
Males 30.0% Never married61.0% Now married0.1% Separated2.3% Widowed6.6% DivorcedFemales 21.1% Never married59.9% Now married1.8% Separated6.9% Widowed10.3% DivorcedWomen who gave birth in the past 12 months Now married:
86.5% (214)Unmarried:
13.5% (33)
Women who did not give birth in the past 12 months Now married:
54.2% (2,610)Unmarried:
45.8% (2,206)
Marital status - Hispanic or Latino population 15 years and over
Males 41.9% Never married52.1% Now married1.7% Separated0.8% Widowed3.5% DivorcedFemales 38.0% Never married48.7% Now married5.3% Separated2.8% Widowed5.3% DivorcedWomen who gave birth in the past 12 months Now married:
100.0% (168)Unmarried:
0.0% (0)
Women who did not give birth in the past 12 months Now married:
46.3% (1,108)Unmarried:
53.7% (1,284)
Ancestries in Hoffman Estates
2,032 7.1% Polish1,366 4.8% German1,088 3.8% Italian805 2.8% Irish726 2.5% American636 2.2% English590 2.1% Romanian484 1.7% Assyrian336 1.2% Serbian315 1.1% European286 1.0% Nigerian245 0.9% Syrian240 0.8% Greek225 0.8% Bulgarian173 0.6% African170 0.6% Swedish154 0.5% Ukrainian120 0.4% Albanian118 0.4% Russian112 0.4% West Indian110 0.4% Palestinian101 0.4% Eastern European90 0.3% Norwegian88 0.3% Czech87 0.3% Haitian79 0.3% Turkish65 0.2% French62 0.2% Scottish60 0.2% Jamaican58 0.2% Croatian58 0.2% Iranian53 0.2% Egyptian47 0.2% Scandinavian43 0.1% Scotch-Irish39 0.1% Moroccan35 0.1% Arab33 0.1% Estonian30 0.1% Armenian27 0.09% French Canadian26 0.09% Luxembourger22 0.08% Dutch21 0.07% Lithuanian18 0.06% Czechoslovakian16 0.06% Iraqi15 0.05% Welsh14 0.05% British11 0.04% Yugoslavian10 0.03% Slovak10 0.03% Hungarian10 0.03% Macedonian6 0.02% Canadian5 0.02% Danish4 0.01% Austrian
Geographical mobility in Hoffman Estates Same house 1 year ago 21,401 88.9% White (Caucasian)2,251 89.1% Black or African American60 61.9% American Indian / Alaska Native12,050 93.5% Asian3,988 93.4% Other race5,248 92.8% Two or more races21,817 89.6% White alone, not Hispanic / Latino8,254 91.0% Hispanic or LatinoMoved within same county 1,695 7.0% White / Caucasian188 7.4% Black or African American42 43.2% American Indian / Alaska Native537 4.2% Asian234 5.5% Other race330 5.8% Two or more races1,668 6.8% White alone, not Hispanic / Latino550 6.1% Hispanic or LatinoMoved within same state 532 2.2% White / Caucasian55 2.2% Black or African American129 1.0% Asian34 0.8% Other race486 2.0% White alone, not Hispanic / Latino105 1.2% Hispanic or LatinoMoved from different state 150 0.6% White / Caucasian50 2.0% Black or African American37 0.3% Asian18 0.4% Other race26 0.5% Two or more races86 0.4% White alone, not Hispanic / Latino126 1.4% Hispanic or LatinoMoved from abroad 202 0.8% White27 0.2% Asian184 0.8% White alone, not Hispanic / Latino49 0.5% Hispanic or Latino
Children Nativity (place of birth) in Hoffman Estates
Children under 6 years - Living with two parents Both parents native 1,264 100.0% NativeBoth parents foreign-born 744 91.8% Native67 8.2% Foreign-bornOne native, one foreign-born parent 774 100.0% NativeChildren under 6 years - Living with one parent Native parent 573 100.0% NativeForeign-born parent 200 100.0% NativeChildren 6 to 17 years - Living with two parents Both parents native 1,814 99.4% Native11 0.6% Foreign-bornBoth parents foreign-born 2,012 71.5% Native801 28.5% Foreign-bornOne native, one foreign-born parent 1,060 100.0% NativeChildren 6 to 17 years - Living with one parent Native parent 971 100.0% NativeForeign-born parent 536 55.9% Native422 44.1% Foreign-born
Place of birth for residents in Hoffman Estates 9,470 Asia4,914 South Central Asia4,153 Americas3,893 Latin America3,189 Central America2,730 Europe2,304 Eastern Europe2,295 Eastern Asia1,815 South Eastern Asia623 China617 South America604 Africa387 Western Asia280 Western Africa259 Northern America224 Southern Europe181 Northern Africa112 Western Europe102 Eastern Africa89 Northern Europe86 Caribbean30 Southern Africa6 Oceania4,634 India3,090 Mexico1,627 Philippines917 Poland850 Japan731 Korea573 China317 Serbia280 Nigeria259 Canada231 Ukraine207 Syria183 Bulgaria182 Romania165 Russia149 Ecuador139 Moldova135 Peru124 Italy124 Venezuela119 Colombia100 Greece96 Pakistan81 Egypt80 Albania71 Iraq68 Brazil62 Laos58 Croatia56 Germany56 Ireland55 Jamaica45 Kuwait45 Guatemala44 Thailand43 Panama41 Vietnam39 Uganda39 Turkey36 Morocco35 France33 Algeria31 Hong Kong30 South Africa26 Uzbekistan26 Haiti25 Kazakhstan24 United Kingdom22 Burma (Myanmar)22 Ethiopia22 Saudi Arabia20 Argentina19 Austria18 Nepal17 Taiwan15 Malaysia12 Tanzania9 Costa Rica9 Belarus7 England7 Sri Lanka6 Fiji3 Kenya3 Dominican Republic
Grandparents responsible for own grandchildren in Hoffman Estates
Grandparents (30 to 59 years) White / Caucasian 32 43.7% Responsible for grandchildren42 56.3% Not responsible for grandchildrenBlack or African American 35 74.5% Responsible for grandchildren12 25.5% Not responsible for grandchildrenAsian 27 100.0% Not responsible for grandchildrenOther race 8 11.2% Responsible for grandchildren63 88.8% Not responsible for grandchildrenTwo or more races 28 83.9% Responsible for grandchildren5 16.1% Not responsible for grandchildrenWhite alone, not Hispanic / Latino 43 61.0% Responsible for grandchildren27 39.0% Not responsible for grandchildrenHispanic or Latino 11 13.2% Responsible for grandchildren70 86.8% Not responsible for grandchildrenGrandparents (60 years and over) White / Caucasian 55 16.3% Responsible for grandchildren282 83.7% Not responsible for grandchildrenAsian 263 100.0% Not responsible for grandchildrenOther race 121 100.0% Not responsible for grandchildrenWhite alone, not Hispanic / Latino 67 20.5% Responsible for grandchildren260 79.5% Not responsible for grandchildrenHispanic or Latino 196 100.0% Not responsible for grandchildren