Races in Holly Springs, North Carolina (NC) Detailed Stats
Data:
Races - White alone (%)
Races - White alone (% change since 2000)
Races - Black alone (%)
Races - Black alone (% change since 2000)
Races - American Indian alone (%)
Races - American Indian alone (% change since 2000)
Races - Asian alone (%)
Races - Asian alone (% change since 2000)
Races - Hispanic (%)
Races - Hispanic (% change since 2000)
Races - Native Hawaiian and Other Pacific Islander alone (%)
Races - Native Hawaiian and Other Pacific Islander alone (% change since 2000)
Races - Two or more races(%)
Races - Two or more races(% change since 2000)
Races - Other race alone (%)
Races - Other race alone (% change since 2000)
Racial diversity
Place of birth - Born in state of residence (%)
Place of birth - Born in state of residence (%) - White
Place of birth - Born in state of residence (%) - Black or African American
Place of birth - Born in state of residence (%) - Asian
Place of birth - Born in state of residence (%) - Hispanic or Latino
Place of birth - Born in state of residence (%) - American Indian and Alaska Native
Place of birth - Born in state of residence (%) - Multirace
Place of birth - Born in state of residence (%) - Other Race
Place of birth - Born in other state (%)
Place of birth - Born in other state (%) - White
Place of birth - Born in other state (%) - Black or African American
Place of birth - Born in other state (%) - Asian
Place of birth - Born in other state (%) - Hispanic or Latino
Place of birth - Born in other state (%) - American Indian and Alaska Native
Place of birth - Born in other state (%) - Multirace
Place of birth - Born in other state (%) - Other Race
Place of birth - Native, outside of US (%)
Place of birth - Native, outside of US (%) - White
Place of birth - Native, outside of US (%) - Black or African American
Place of birth - Native, outside of US (%) - Asian
Place of birth - Native, outside of US (%) - Hispanic or Latino
Place of birth - Native, outside of US (%) - American Indian and Alaska Native
Place of birth - Native, outside of US (%) - Multirace
Place of birth - Native, outside of US (%) - Other Race
Place of birth - Foreign born (%)
Place of birth - Foreign born (%) - White
Place of birth - Foreign born (%) - Black or African American
Place of birth - Foreign born (%) - Asian
Place of birth - Foreign born (%) - Hispanic or Latino
Place of birth - Foreign born (%) - American Indian and Alaska Native
Place of birth - Foreign born (%) - Multirace
Place of birth - Foreign born (%) - Other Race
Residents speaking English at home (%)
Residents speaking English at home - Born in the United States (%)
Residents speaking English at home - Native, born elsewhere (%)
Residents speaking English at home - Foreign born (%)
Residents speaking Spanish at home (%)
Residents speaking Spanish at home - Born in the United States (%)
Residents speaking Spanish at home - Native, born elsewhere (%)
Residents speaking Spanish at home - Foreign born (%)
Residents speaking other language at home (%)
Residents speaking other language at home - Born in the United States (%)
Residents speaking other language at home - Native, born elsewhere (%)
Residents speaking other language at home - Foreign born (%)
Marital status - Never married (%)
Marital status - Now married (%)
Marital status - Separated (%)
Marital status - Widowed (%)
Marital status - Divorced (%)
Ancestries Reported - Arab (%)
Ancestries Reported - Czech (%)
Ancestries Reported - Danish (%)
Ancestries Reported - Dutch (%)
Ancestries Reported - English (%)
Ancestries Reported - French (%)
Ancestries Reported - French Canadian (%)
Ancestries Reported - German (%)
Ancestries Reported - Greek (%)
Ancestries Reported - Hungarian (%)
Ancestries Reported - Irish (%)
Ancestries Reported - Italian (%)
Ancestries Reported - Lithuanian (%)
Ancestries Reported - Norwegian (%)
Ancestries Reported - Polish (%)
Ancestries Reported - Portuguese (%)
Ancestries Reported - Russian (%)
Ancestries Reported - Scotch-Irish (%)
Ancestries Reported - Scottish (%)
Ancestries Reported - Slovak (%)
Ancestries Reported - Subsaharan African (%)
Ancestries Reported - Swedish (%)
Ancestries Reported - Swiss (%)
Ancestries Reported - Ukrainian (%)
Ancestries Reported - United States (%)
Ancestries Reported - Welsh (%)
Ancestries Reported - West Indian (%)
Ancestries Reported - Other (%)
Geographical mobility - Same house 1 year ago (%)
Geographical mobility - Same house 1 year ago (%) - White
Geographical mobility - Same house 1 year ago (%) - Black or African American
Geographical mobility - Same house 1 year ago (%) - Asian
Geographical mobility - Same house 1 year ago (%) - Hispanic or Latino
Geographical mobility - Same house 1 year ago (%) - American Indian and Alaska Native
Geographical mobility - Same house 1 year ago (%) - Multirace
Geographical mobility - Same house 1 year ago (%) - Other Race
Geographical mobility - Moved within same county (%)
Geographical mobility - Moved within same county (%) - White
Geographical mobility - Moved within same county (%) - Black or African American
Geographical mobility - Moved within same county (%) - Asian
Geographical mobility - Moved within same county (%) - Hispanic or Latino
Geographical mobility - Moved within same county (%) - American Indian and Alaska Native
Geographical mobility - Moved within same county (%) - Multirace
Geographical mobility - Moved within same county (%) - Other Race
Geographical mobility - Moved from different county within same state (%)
Geographical mobility - Moved from different county within same state (%) - White
Geographical mobility - Moved from different county within same state (%) - Black or African American
Geographical mobility - Moved from different county within same state (%) - Asian
Geographical mobility - Moved from different county within same state (%) - Hispanic or Latino
Geographical mobility - Moved from different county within same state (%) - American Indian and Alaska Native
Geographical mobility - Moved from different county within same state (%) - Multirace
Geographical mobility - Moved from different county within same state (%) - Other Race
Geographical mobility - Moved from different state (%)
Geographical mobility - Moved from different state (%) - White
Geographical mobility - Moved from different state (%) - Black or African American
Geographical mobility - Moved from different state (%) - Asian
Geographical mobility - Moved from different state (%) - Hispanic or Latino
Geographical mobility - Moved from different state (%) - American Indian and Alaska Native
Geographical mobility - Moved from different state (%) - Multirace
Geographical mobility - Moved from different state (%) - Other Race
Geographical mobility - Moved from abroad (%)
Geographical mobility - Moved from abroad (%) - White
Geographical mobility - Moved from abroad (%) - Black or African American
Geographical mobility - Moved from abroad (%) - Asian
Geographical mobility - Moved from abroad (%) - Hispanic or Latino
Geographical mobility - Moved from abroad (%) - American Indian and Alaska Native
Geographical mobility - Moved from abroad (%) - Multirace
Geographical mobility - Moved from abroad (%) - Other Race
Place of birth for the foreign-born population - Ireland (%)
Place of birth for the foreign-born population - Denmark (%)
Place of birth for the foreign-born population - Norway (%)
Place of birth for the foreign-born population - Sweden (%)
Place of birth for the foreign-born population - United Kingdom (%)
Place of birth for the foreign-born population - England (%)
Place of birth for the foreign-born population - Scotland (%)
Place of birth for the foreign-born population - Other Northern Europe (%)
Place of birth for the foreign-born population - Austria (%)
Place of birth for the foreign-born population - Belgium (%)
Place of birth for the foreign-born population - France (%)
Place of birth for the foreign-born population - Germany (%)
Place of birth for the foreign-born population - Netherlands (%)
Place of birth for the foreign-born population - Switzerland (%)
Place of birth for the foreign-born population - Other Western Europe (%)
Place of birth for the foreign-born population - Greece (%)
Place of birth for the foreign-born population - Italy (%)
Place of birth for the foreign-born population - Portugal (%)
Place of birth for the foreign-born population - Spain (%)
Place of birth for the foreign-born population - Other Southern Europe (%)
Place of birth for the foreign-born population - Albania (%)
Place of birth for the foreign-born population - Belarus (%)
Place of birth for the foreign-born population - Bosnia and Herzegovina (%)
Place of birth for the foreign-born population - Bulgaria (%)
Place of birth for the foreign-born population - Croatia (%)
Place of birth for the foreign-born population - Czechoslovakia (%)
Place of birth for the foreign-born population - Hungary (%)
Place of birth for the foreign-born population - Latvia (%)
Place of birth for the foreign-born population - Lithuania (%)
Place of birth for the foreign-born population - North Macedonia (Macedonia) (%)
Place of birth for the foreign-born population - Moldova (%)
Place of birth for the foreign-born population - Poland (%)
Place of birth for the foreign-born population - Romania (%)
Place of birth for the foreign-born population - Russia (%)
Place of birth for the foreign-born population - Serbia (%)
Place of birth for the foreign-born population - Ukraine (%)
Place of birth for the foreign-born population - Other Eastern Europe (%)
Place of birth for the foreign-born population - China (%)
Place of birth for the foreign-born population - Hong Kong (%)
Place of birth for the foreign-born population - Taiwan (%)
Place of birth for the foreign-born population - Japan (%)
Place of birth for the foreign-born population - Korea (%)
Place of birth for the foreign-born population - Other Eastern Asia (%)
Place of birth for the foreign-born population - Afghanistan (%)
Place of birth for the foreign-born population - Bangladesh (%)
Place of birth for the foreign-born population - India (%)
Place of birth for the foreign-born population - Iran (%)
Place of birth for the foreign-born population - Kazakhstan (%)
Place of birth for the foreign-born population - Nepal (%)
Place of birth for the foreign-born population - Pakistan (%)
Place of birth for the foreign-born population - Sri Lanka (%)
Place of birth for the foreign-born population - Uzbekistan (%)
Place of birth for the foreign-born population - Other South Central Asia (%)
Place of birth for the foreign-born population - Burma (%)
Place of birth for the foreign-born population - Cambodia (%)
Place of birth for the foreign-born population - Indonesia (%)
Place of birth for the foreign-born population - Laos (%)
Place of birth for the foreign-born population - Malaysia (%)
Place of birth for the foreign-born population - Philippines (%)
Place of birth for the foreign-born population - Singapore (%)
Place of birth for the foreign-born population - Thailand (%)
Place of birth for the foreign-born population - Vietnam (%)
Place of birth for the foreign-born population - Other South Eastern Asia (%)
Place of birth for the foreign-born population - Armenia (%)
Place of birth for the foreign-born population - Iraq (%)
Place of birth for the foreign-born population - Israel (%)
Place of birth for the foreign-born population - Jordan (%)
Place of birth for the foreign-born population - Kuwait (%)
Place of birth for the foreign-born population - Lebanon (%)
Place of birth for the foreign-born population - Saudi Arabia (%)
Place of birth for the foreign-born population - Syria (%)
Place of birth for the foreign-born population - Turkey (%)
Place of birth for the foreign-born population - Yemen (%)
Place of birth for the foreign-born population - Other Western Asia (%)
Place of birth for the foreign-born population - Eritrea (%)
Place of birth for the foreign-born population - Ethiopia (%)
Place of birth for the foreign-born population - Kenya (%)
Place of birth for the foreign-born population - Somalia (%)
Place of birth for the foreign-born population - Uganda (%)
Place of birth for the foreign-born population - Zimbabwe (%)
Place of birth for the foreign-born population - Other Eastern Africa (%)
Place of birth for the foreign-born population - Cameroon (%)
Place of birth for the foreign-born population - Congo (%)
Place of birth for the foreign-born population - Democratic Republic of Congo (Zaire) (%)
Place of birth for the foreign-born population - Other Middle Africa (%)
Place of birth for the foreign-born population - Egypt (%)
Place of birth for the foreign-born population - Morocco (%)
Place of birth for the foreign-born population - Sudan (%)
Place of birth for the foreign-born population - Other Northern Africa (%)
Place of birth for the foreign-born population - South Africa (%)
Place of birth for the foreign-born population - Other Southern Africa (%)
Place of birth for the foreign-born population - Cabo Verde (%)
Place of birth for the foreign-born population - Ghana (%)
Place of birth for the foreign-born population - Liberia (%)
Place of birth for the foreign-born population - Nigeria (%)
Place of birth for the foreign-born population - Senegal (%)
Place of birth for the foreign-born population - Sierra Leone (%)
Place of birth for the foreign-born population - Other Western Africa (%)
Place of birth for the foreign-born population - Australia (%)
Place of birth for the foreign-born population - New Zealand (%)
Place of birth for the foreign-born population - Fiji (%)
Place of birth for the foreign-born population - Micronesia (%)
Place of birth for the foreign-born population - Bahamas (%)
Place of birth for the foreign-born population - Barbados (%)
Place of birth for the foreign-born population - Cuba (%)
Place of birth for the foreign-born population - Dominica (%)
Place of birth for the foreign-born population - Dominican Republic (%)
Place of birth for the foreign-born population - Grenada (%)
Place of birth for the foreign-born population - Haiti (%)
Place of birth for the foreign-born population - Jamaica (%)
Place of birth for the foreign-born population - St. Vincent and the Grenadines (%)
Place of birth for the foreign-born population - Trinidad and Tobago (%)
Place of birth for the foreign-born population - West Indies (%)
Place of birth for the foreign-born population - Other Caribbean (%)
Place of birth for the foreign-born population - Belize (%)
Place of birth for the foreign-born population - Costa Rica (%)
Place of birth for the foreign-born population - El Salvador (%)
Place of birth for the foreign-born population - Guatemala (%)
Place of birth for the foreign-born population - Honduras (%)
Place of birth for the foreign-born population - Mexico (%)
Place of birth for the foreign-born population - Nicaragua (%)
Place of birth for the foreign-born population - Panama (%)
Place of birth for the foreign-born population - Other Central America (%)
Place of birth for the foreign-born population - Argentina (%)
Place of birth for the foreign-born population - Bolivia (%)
Place of birth for the foreign-born population - Brazil (%)
Place of birth for the foreign-born population - Chile (%)
Place of birth for the foreign-born population - Colombia (%)
Place of birth for the foreign-born population - Ecuador (%)
Place of birth for the foreign-born population - Guyana (%)
Place of birth for the foreign-born population - Peru (%)
Place of birth for the foreign-born population - Uruguay (%)
Place of birth for the foreign-born population - Venezuela (%)
Place of birth for the foreign-born population - Other South America (%)
Place of birth for the foreign-born population - Canada (%)
Place of birth for the foreign-born population - Other Northern America (%)
Place of birth for the foreign-born population - Other (%)
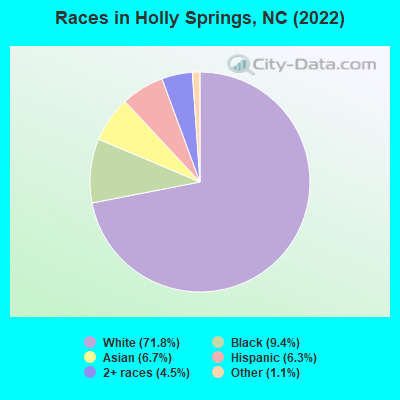
According to 2022 data, the most numerous races in Holly Springs, NC are White alone (31,307 residents), Black alone (4,089 residents), and Hispanic (2,741 residents). 86.0% of Holly Springs residents speak English at home. 9.9% of Holly Springs, NC residents are foreign-born (4.9% born in Asia, 2.1% born in Latin America, 1.8% born in Europe), which is 19.5% greater than the foreign-born rate of 8.0% across the entire state of North Carolina.
Race distribution in Holly Springs
2000 2022
5,647,155 70.2% White alone 1,723,301 21.4% Black alone 378,963 4.7% Hispanic 112,416 1.4% Asian alone 95,333 1.2% American Indian alone 79,965 1.0% Two or more races 9,015 0.1% Other race alone 3,165 0.04% Native Hawaiian and Other
6,497,519 60.7% White alone 2,155,650 20.1% Black alone 1,114,799 10.4% Hispanic 438,061 4.1% Two or more races 341,052 3.2% Asian alone 91,758 0.9% American Indian alone 50,180 0.5% Other race alone 9,954 0.09% Native Hawaiian and Other
Income and house value in Holly Springs Median household income in 2022 $134,413 White non-Hispanic householders$108,304 Black householders$124,797 American Indian and Alaska Native householders$130,403 Asian householders$90,499 Some other race householders$100,125 Two or more races householders$78,139 Hispanic or Latino race householdersMedian 2022 house value $575,149 White Non-Hispanic householders$391,728 Black or African American householders$479,347 American Indian or Alaska Native householders $450,368 Asian householders$468,779 Some other race householders$568,330 Two or more races householders$462,301 Hispanic or Latino householders
Median age by race in Holly Springs
36.7 Median age for White residents37.0 36.1 37.4 Median age for Black or African American residents38.2 36.0 37.9 Median age for American Indian / Alaska Native residents34.5 -679,313,459.1 39.7 Median age for Asian residents42.7 38.8 -609,884,331.7 Median age for Native Hawaiian / Pacific Islander residents-611,708,482.1 -612,403,100.2 35.3 Median age for Other race residents40.0 18.4 19.2 Median age for Two or more races residents18.9 20.8 36.6 Median age for White alone residents37.2 35.8 31.0 Median age for Hispanic or Latino residents24.7 37.0
Owner/renter occupied households by race in Holly Springs
House owners and renters - White residents 9,245 84.7% Owner occupied1,674 15.3% Renter occupiedHouse owners and renters - Black or African American residents 750 56.3% Owner occupied582 43.7% Renter occupiedHouse owners and renters - American Indian / Alaska Native residents 39 100.0% Owner occupiedHouse owners and renters - Asian residents 649 92.6% Owner occupied52 7.4% Renter occupiedHouse owners and renters - Native Hawaiian / Pacific Islander residents 3 100.0% Owner occupiedHouse owners and renters - Other race residents 298 85.6% Owner occupied50 14.4% Renter occupiedHouse owners and renters - Two or more races residents 594 89.6% Owner occupied69 10.4% Renter occupiedHouse owners and renters - White alone residents 9,084 85.1% Owner occupied1,590 14.9% Renter occupiedHouse owners and renters - Hispanic or Latino residents 647 78.5% Owner occupied177 21.5% Renter occupied
Language usage in Holly Springs
English speakers - Total 86.0% of residents of Holly Springs speak English at home.
3.5% of residents speak Spanish at home 1,023 71.4% Speak English very well410 28.6% Speak English less than very well10.5% of residents speak other language at home 3,618 84.6% Speak English very well658 15.4% Speak English less than very well
English speakers - Born in the United States 96.0% of residents of Holly Springs speak English at home.
0.9% of residents speak Spanish at home 216 100.0% Speak English very well2.7% of residents speak other language at home 577 93.2% Speak English very well42 6.8% Speak English less than very well
English speakers - Native, born elsewhere 81.6% of residents of Holly Springs speak English at home.
5.3% of residents speak Spanish at home 13 46.4% Speak English very well15 53.6% Speak English less than very well21.1% of residents speak other language at home 105 94.6% Speak English very well6 5.4% Speak English less than very well
English speakers - Foreign-born 23.9% of residents of Holly Springs speak English at home.
16.2% of residents speak Spanish at home 390 53.0% Speak English very well346 47.0% Speak English less than very well62.2% of residents speak other language at home 2,291 80.8% Speak English very well543 19.2% Speak English less than very well
White (Caucasian) - Speak only English Native:
97.7% (27,609)Foreign-born:
37.0% (463)
White (Caucasian) - Speak another language Native:
2.4% (683)Foreign-born:
62.7% (783)
Black or African American - Speak only English Native:
95.8% (3,516)Foreign-born:
35.5% (85)
Black or African American - Speak another language Native:
4.3% (158)Foreign-born:
58.2% (140)
Asian - Speak only English Native:
12.5% (104)Foreign-born:
18.2% (358)
Asian - Speak another language Native:
90.0% (749)Foreign-born:
82.0% (1,617)
Other race - Speak only English Native:
72.5% (477)Foreign-born:
23.1% (109)
Other race - Speak another language Native:
34.8% (229)Foreign-born:
77.5% (366)
Two or more races - Speak only English Native:
92.2% (2,212)Foreign-born:
14.2% (86)
Two or more races - Speak another language Native:
8.1% (194)Foreign-born:
84.3% (509)
White alone - Speak only English Native:
97.8% (27,495)Foreign-born:
38.1% (448)
White alone - Speak another language Native:
2.1% (591)Foreign-born:
61.8% (726)
Hispanic or Latino - Speak only English Native:
75.6% (1,339)Foreign-born:
9.7% (80)
Hispanic or Latino - Speak another language Native:
29.2% (517)Foreign-born:
89.9% (742)
Foreign-born residents in Holly Springs 4,335 residents are foreign born (4.9% Asia , 2.1% Latin America , 1.8% Europe ).
This city:
9.9%North Carolina:
8.3%
Marital status for residents in Holly Springs Marital status - White (Caucasian) population 15 years and over
Males 24.1% Never married69.2% Now married0.7% Separated0.4% Widowed5.6% DivorcedFemales 19.0% Never married63.9% Now married1.5% Separated3.4% Widowed12.3% DivorcedWomen who gave birth in the past 12 months Now married:
100.0% (308)Unmarried:
0.0% (0)
Women who did not give birth in the past 12 months Now married:
65.5% (4,912)Unmarried:
34.5% (2,591)
Marital status - Black or African American population 15 years and over
Males 21.1% Never married69.5% Now married1.5% Separated2.3% Widowed5.7% DivorcedFemales 40.2% Never married44.6% Now married0.7% Separated8.9% Widowed5.6% DivorcedWomen who gave birth in the past 12 months Now married:
0.0% (0)Unmarried:
100.0% (19)
Women who did not give birth in the past 12 months Now married:
47.4% (544)Unmarried:
52.6% (603)
Marital status - American Indian / Alaska Native population 15 years and over
Males 7.8% Never married41.2% Now married0.0% Separated0.0% Widowed51.0% DivorcedFemales 0.0% Never married100.0% Now married0.0% Separated0.0% Widowed0.0% DivorcedWomen who did not give birth in the past 12 months Now married:
100.0% (4)Unmarried:
0.0% (0)
Marital status - Asian population 15 years and over
Males 27.9% Never married72.1% Now married0.0% Separated0.0% Widowed0.0% DivorcedFemales 4.5% Never married87.8% Now married0.0% Separated0.0% Widowed7.7% DivorcedWomen who gave birth in the past 12 months Now married:
100.0% (28)Unmarried:
0.0% (0)
Women who did not give birth in the past 12 months Now married:
95.1% (510)Unmarried:
4.9% (26)
Marital status - Other race population 15 years and over
Males 37.6% Never married62.4% Now married0.0% Separated0.0% Widowed0.0% DivorcedFemales 18.1% Never married68.1% Now married8.3% Separated0.0% Widowed5.4% DivorcedWomen who did not give birth in the past 12 months Now married:
79.4% (318)Unmarried:
20.6% (83)
Marital status - Two or more races population 15 years and over
Males 45.8% Never married51.9% Now married0.0% Separated1.9% Widowed0.3% DivorcedFemales 54.4% Never married40.7% Now married0.0% Separated0.0% Widowed4.9% DivorcedWomen who gave birth in the past 12 months Now married:
100.0% (41)Unmarried:
0.0% (0)
Women who did not give birth in the past 12 months Now married:
28.8% (229)Unmarried:
71.2% (566)
Marital status - White alone, not Hispanic / Latino population 15 years and over
Males 23.2% Never married70.4% Now married0.7% Separated0.4% Widowed5.2% DivorcedFemales 18.6% Never married63.8% Now married1.5% Separated3.5% Widowed12.5% DivorcedWomen who gave birth in the past 12 months Now married:
100.0% (307)Unmarried:
0.0% (0)
Women who did not give birth in the past 12 months Now married:
65.8% (4,881)Unmarried:
34.2% (2,537)
Marital status - Hispanic or Latino population 15 years and over
Males 46.3% Never married47.7% Now married0.0% Separated0.0% Widowed6.0% DivorcedFemales 26.5% Never married62.7% Now married3.4% Separated0.0% Widowed7.4% DivorcedWomen who gave birth in the past 12 months Now married:
66.1% (39)Unmarried:
33.9% (20)
Women who did not give birth in the past 12 months Now married:
59.9% (400)Unmarried:
40.1% (268)
Ancestries in Holly Springs
3,067 15.2% English1,871 9.3% German1,611 8.0% Irish1,544 7.6% Italian1,073 5.3% American832 4.1% European433 2.1% Polish280 1.4% Scottish211 1.0% Scotch-Irish198 1.0% Russian141 0.7% Swiss120 0.6% Ethiopian107 0.5% Greek91 0.5% Moroccan91 0.5% Dutch87 0.4% Norwegian85 0.4% Portuguese81 0.4% French Canadian64 0.3% British64 0.3% Scandinavian63 0.3% Slovene61 0.3% Ukrainian59 0.3% Romanian58 0.3% African57 0.3% French57 0.3% Welsh55 0.3% Cajun53 0.3% Turkish51 0.3% Slovak49 0.2% Slavic48 0.2% Jamaican47 0.2% Canadian45 0.2% Swedish41 0.2% Austrian38 0.2% South African35 0.2% Serbian31 0.2% Eastern European25 0.1% Iranian24 0.1% Egyptian21 0.1% Palestinian21 0.1% Hungarian20 0.10% Macedonian19 0.09% Armenian16 0.08% Brazilian13 0.06% Danish13 0.06% Czechoslovakian9 0.04% Czech8 0.04% Lithuanian8 0.04% Icelander
Geographical mobility in Holly Springs Same house 1 year ago 27,886 89.4% White (Caucasian)3,747 92.6% Black or African American92 100.0% American Indian / Alaska Native2,564 87.4% Asian3 100.0% Native Hawaiian / Pacific Islander1,166 94.7% Other race3,135 93.0% Two or more races27,849 89.8% White alone, not Hispanic / Latino2,294 86.6% Hispanic or LatinoMoved within same county 1,975 6.3% White / Caucasian89 2.2% Black or African American183 6.2% Asian39 3.1% Other race73 2.2% Two or more races1,936 6.2% White alone, not Hispanic / Latino166 6.3% Hispanic or LatinoMoved within same state 407 1.3% White / Caucasian264 6.5% Black or African American91 3.1% Asian58 4.7% Other race41 1.2% Two or more races347 1.1% White alone, not Hispanic / Latino99 3.7% Hispanic or LatinoMoved from different state 707 2.3% White / Caucasian18 0.4% Black or African American130 4.4% Asian137 4.1% Two or more races699 2.3% White alone, not Hispanic / Latino57 2.1% Hispanic or LatinoMoved from abroad 233 0.7% White26 0.6% Black or African American9 0.3% Asian41 1.2% Two or more races234 0.8% White alone, not Hispanic / Latino
Children Nativity (place of birth) in Holly Springs
Children under 6 years - Living with two parents Both parents native 2,751 99.9% Native2 0.1% Foreign-bornBoth parents foreign-born 388 92.2% Native33 7.8% Foreign-bornOne native, one foreign-born parent 81 100.0% NativeChildren under 6 years - Living with one parent Native parent 217 100.0% NativeChildren 6 to 17 years - Living with two parents Both parents native 6,603 99.6% Native26 0.4% Foreign-bornBoth parents foreign-born 1,019 87.0% Native152 13.0% Foreign-bornOne native, one foreign-born parent 692 97.3% Native19 2.7% Foreign-bornChildren 6 to 17 years - Living with one parent Native parent 2,013 100.0% NativeForeign-born parent 60 56.3% Native47 43.7% Foreign-born
Grandparents responsible for own grandchildren in Holly Springs
Grandparents (30 to 59 years) White / Caucasian 7 12.7% Responsible for grandchildren50 87.3% Not responsible for grandchildrenAmerican Indian / Alaska Native 33 100.0% Not responsible for grandchildrenWhite alone, not Hispanic / Latino 8 13.3% Responsible for grandchildren50 86.7% Not responsible for grandchildrenGrandparents (60 years and over) White / Caucasian 61 32.1% Responsible for grandchildren129 67.9% Not responsible for grandchildrenWhite alone, not Hispanic / Latino 62 30.8% Responsible for grandchildren139 69.2% Not responsible for grandchildren