Races in Incline Village-Crystal Bay, Nevada (NV) Detailed Stats
Ancestries, Foreign-born residents, place of birth

Discuss Incline Village-Crystal Bay, Nevada races on our local forum with over 2,400,000 registered users
12.0% of Incline Village-Crystal Bay, NV residents are foreign-born (7.2% born in Latin America, 2.3% born in Europe, 1.2% born in North America), which is 50.0% less than the foreign-born rate of 18.0% across the entire state of Nevada.
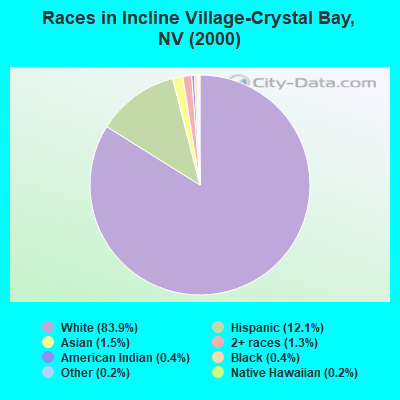
Race distribution in Incline Village-Crystal Bay

- 8,34783.9%White alone
- 1,20712.1%Hispanic
- 1541.5%Asian alone
- 1281.3%Two or more races
- 370.4%Black alone
- 430.4%American Indian alone
- 150.2%Native Hawaiian and Other
Pacific Islander alone - 210.2%Other race alone
2000
2022
-
- 1,303,00165.2%White alone
- 393,97019.7%Hispanic
- 131,5096.6%Black alone
- 88,5934.4%Asian alone
- 49,2312.5%Two or more races
- 21,3971.1%American Indian alone
- 7,7690.4%Native Hawaiian and Other
Pacific Islander alone - 2,7870.1%Other race alone

-
- 1,410,14544.4%White alone
- 961,35730.3%Hispanic
- 286,4719.0%Black alone
- 281,1498.8%Asian alone
- 182,1515.7%Two or more races
- 20,1020.6%Native Hawaiian and Other
Pacific Islander alone - 18,7810.6%Other race alone
- 17,6160.6%American Indian alone

Income and house value in Incline Village-Crystal Bay
- Median household income in 2022
- $124,134White non-Hispanic householders
- $90,060Black householders
- $112,421American Indian and Alaska Native householders
- over $200,000Asian householders
- $116,421Native Hawaiian and other Pacific Islander householders
- $96,820Some other race householders
- $14,854Two or more races householders
- $87,780Hispanic or Latino race householders
- Median 2022 house value
- over $1,000,000White Non-Hispanic householders
- over $1,000,000Asian householders
- over $1,000,000Some other race householders
- over $1,000,000Two or more races householders
- $833,739Hispanic or Latino householders
Household income for White non-Hispanic householders

Household income for Black householders

Household income for American Indian and Alaska Native householders

Household income for Asian householders

Household income for Native Hawaiian and other Pacific Islander householders

Household income for Two or more races householders

Household income for Hispanic or Latino race householders

Foreign-born residents in Incline Village-Crystal Bay
1,194 residents are foreign born (7.2% Latin America, 2.3% Europe, 1.2% North America).
| This city: | 12.0% |
| Nevada: | 15.8% |
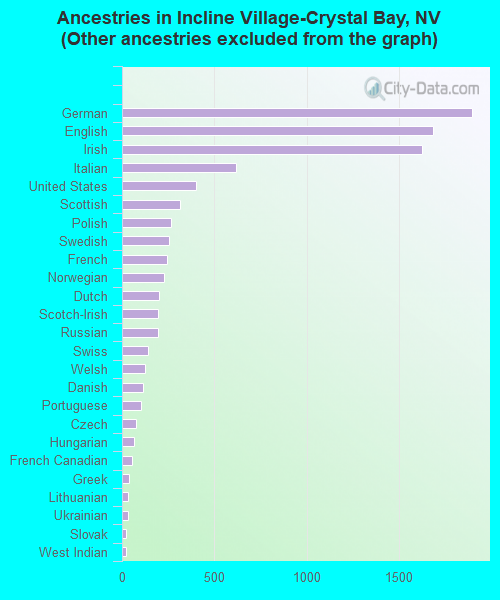
Ancestries in Incline Village-Crystal Bay

- 2,58922.4%Other
- 1,89416.4%German
- 1,68414.6%English
- 1,62714.1%Irish
- 6165.3%Italian
- 4003.5%United States
- 3122.7%Scottish
- 2682.3%Polish
- 2552.2%Swedish
- 2422.1%French
- 2282.0%Norwegian
- 2001.7%Dutch
- 1961.7%Scotch-Irish
- 1951.7%Russian
- 1411.2%Swiss
- 1231.1%Welsh
- 1151.0%Danish
- 1010.9%Portuguese
- 740.6%Czech
- 660.6%Hungarian
- 560.5%French Canadian
- 400.3%Greek
- 310.3%Lithuanian
- 300.3%Ukrainian
- 220.2%Slovak
- 210.2%West Indian
- 130.1%Subsaharan African
- 100.09%Arab
Zip codes: 89451.