Races in Independence, Kentucky (KY) Detailed Stats
Data:
Races - White alone (%)
Races - White alone (% change since 2000)
Races - Black alone (%)
Races - Black alone (% change since 2000)
Races - American Indian alone (%)
Races - American Indian alone (% change since 2000)
Races - Asian alone (%)
Races - Asian alone (% change since 2000)
Races - Hispanic (%)
Races - Hispanic (% change since 2000)
Races - Native Hawaiian and Other Pacific Islander alone (%)
Races - Native Hawaiian and Other Pacific Islander alone (% change since 2000)
Races - Two or more races(%)
Races - Two or more races(% change since 2000)
Races - Other race alone (%)
Races - Other race alone (% change since 2000)
Racial diversity
Place of birth - Born in state of residence (%)
Place of birth - Born in state of residence (%) - White
Place of birth - Born in state of residence (%) - Black or African American
Place of birth - Born in state of residence (%) - Asian
Place of birth - Born in state of residence (%) - Hispanic or Latino
Place of birth - Born in state of residence (%) - American Indian and Alaska Native
Place of birth - Born in state of residence (%) - Multirace
Place of birth - Born in state of residence (%) - Other Race
Place of birth - Born in other state (%)
Place of birth - Born in other state (%) - White
Place of birth - Born in other state (%) - Black or African American
Place of birth - Born in other state (%) - Asian
Place of birth - Born in other state (%) - Hispanic or Latino
Place of birth - Born in other state (%) - American Indian and Alaska Native
Place of birth - Born in other state (%) - Multirace
Place of birth - Born in other state (%) - Other Race
Place of birth - Native, outside of US (%)
Place of birth - Native, outside of US (%) - White
Place of birth - Native, outside of US (%) - Black or African American
Place of birth - Native, outside of US (%) - Asian
Place of birth - Native, outside of US (%) - Hispanic or Latino
Place of birth - Native, outside of US (%) - American Indian and Alaska Native
Place of birth - Native, outside of US (%) - Multirace
Place of birth - Native, outside of US (%) - Other Race
Place of birth - Foreign born (%)
Place of birth - Foreign born (%) - White
Place of birth - Foreign born (%) - Black or African American
Place of birth - Foreign born (%) - Asian
Place of birth - Foreign born (%) - Hispanic or Latino
Place of birth - Foreign born (%) - American Indian and Alaska Native
Place of birth - Foreign born (%) - Multirace
Place of birth - Foreign born (%) - Other Race
Residents speaking English at home (%)
Residents speaking English at home - Born in the United States (%)
Residents speaking English at home - Native, born elsewhere (%)
Residents speaking English at home - Foreign born (%)
Residents speaking Spanish at home (%)
Residents speaking Spanish at home - Born in the United States (%)
Residents speaking Spanish at home - Native, born elsewhere (%)
Residents speaking Spanish at home - Foreign born (%)
Residents speaking other language at home (%)
Residents speaking other language at home - Born in the United States (%)
Residents speaking other language at home - Native, born elsewhere (%)
Residents speaking other language at home - Foreign born (%)
Marital status - Never married (%)
Marital status - Now married (%)
Marital status - Separated (%)
Marital status - Widowed (%)
Marital status - Divorced (%)
Ancestries Reported - Arab (%)
Ancestries Reported - Czech (%)
Ancestries Reported - Danish (%)
Ancestries Reported - Dutch (%)
Ancestries Reported - English (%)
Ancestries Reported - French (%)
Ancestries Reported - French Canadian (%)
Ancestries Reported - German (%)
Ancestries Reported - Greek (%)
Ancestries Reported - Hungarian (%)
Ancestries Reported - Irish (%)
Ancestries Reported - Italian (%)
Ancestries Reported - Lithuanian (%)
Ancestries Reported - Norwegian (%)
Ancestries Reported - Polish (%)
Ancestries Reported - Portuguese (%)
Ancestries Reported - Russian (%)
Ancestries Reported - Scotch-Irish (%)
Ancestries Reported - Scottish (%)
Ancestries Reported - Slovak (%)
Ancestries Reported - Subsaharan African (%)
Ancestries Reported - Swedish (%)
Ancestries Reported - Swiss (%)
Ancestries Reported - Ukrainian (%)
Ancestries Reported - United States (%)
Ancestries Reported - Welsh (%)
Ancestries Reported - West Indian (%)
Ancestries Reported - Other (%)
Geographical mobility - Same house 1 year ago (%)
Geographical mobility - Same house 1 year ago (%) - White
Geographical mobility - Same house 1 year ago (%) - Black or African American
Geographical mobility - Same house 1 year ago (%) - Asian
Geographical mobility - Same house 1 year ago (%) - Hispanic or Latino
Geographical mobility - Same house 1 year ago (%) - American Indian and Alaska Native
Geographical mobility - Same house 1 year ago (%) - Multirace
Geographical mobility - Same house 1 year ago (%) - Other Race
Geographical mobility - Moved within same county (%)
Geographical mobility - Moved within same county (%) - White
Geographical mobility - Moved within same county (%) - Black or African American
Geographical mobility - Moved within same county (%) - Asian
Geographical mobility - Moved within same county (%) - Hispanic or Latino
Geographical mobility - Moved within same county (%) - American Indian and Alaska Native
Geographical mobility - Moved within same county (%) - Multirace
Geographical mobility - Moved within same county (%) - Other Race
Geographical mobility - Moved from different county within same state (%)
Geographical mobility - Moved from different county within same state (%) - White
Geographical mobility - Moved from different county within same state (%) - Black or African American
Geographical mobility - Moved from different county within same state (%) - Asian
Geographical mobility - Moved from different county within same state (%) - Hispanic or Latino
Geographical mobility - Moved from different county within same state (%) - American Indian and Alaska Native
Geographical mobility - Moved from different county within same state (%) - Multirace
Geographical mobility - Moved from different county within same state (%) - Other Race
Geographical mobility - Moved from different state (%)
Geographical mobility - Moved from different state (%) - White
Geographical mobility - Moved from different state (%) - Black or African American
Geographical mobility - Moved from different state (%) - Asian
Geographical mobility - Moved from different state (%) - Hispanic or Latino
Geographical mobility - Moved from different state (%) - American Indian and Alaska Native
Geographical mobility - Moved from different state (%) - Multirace
Geographical mobility - Moved from different state (%) - Other Race
Geographical mobility - Moved from abroad (%)
Geographical mobility - Moved from abroad (%) - White
Geographical mobility - Moved from abroad (%) - Black or African American
Geographical mobility - Moved from abroad (%) - Asian
Geographical mobility - Moved from abroad (%) - Hispanic or Latino
Geographical mobility - Moved from abroad (%) - American Indian and Alaska Native
Geographical mobility - Moved from abroad (%) - Multirace
Geographical mobility - Moved from abroad (%) - Other Race
Place of birth for the foreign-born population - Ireland (%)
Place of birth for the foreign-born population - Denmark (%)
Place of birth for the foreign-born population - Norway (%)
Place of birth for the foreign-born population - Sweden (%)
Place of birth for the foreign-born population - United Kingdom (%)
Place of birth for the foreign-born population - England (%)
Place of birth for the foreign-born population - Scotland (%)
Place of birth for the foreign-born population - Other Northern Europe (%)
Place of birth for the foreign-born population - Austria (%)
Place of birth for the foreign-born population - Belgium (%)
Place of birth for the foreign-born population - France (%)
Place of birth for the foreign-born population - Germany (%)
Place of birth for the foreign-born population - Netherlands (%)
Place of birth for the foreign-born population - Switzerland (%)
Place of birth for the foreign-born population - Other Western Europe (%)
Place of birth for the foreign-born population - Greece (%)
Place of birth for the foreign-born population - Italy (%)
Place of birth for the foreign-born population - Portugal (%)
Place of birth for the foreign-born population - Spain (%)
Place of birth for the foreign-born population - Other Southern Europe (%)
Place of birth for the foreign-born population - Albania (%)
Place of birth for the foreign-born population - Belarus (%)
Place of birth for the foreign-born population - Bosnia and Herzegovina (%)
Place of birth for the foreign-born population - Bulgaria (%)
Place of birth for the foreign-born population - Croatia (%)
Place of birth for the foreign-born population - Czechoslovakia (%)
Place of birth for the foreign-born population - Hungary (%)
Place of birth for the foreign-born population - Latvia (%)
Place of birth for the foreign-born population - Lithuania (%)
Place of birth for the foreign-born population - North Macedonia (Macedonia) (%)
Place of birth for the foreign-born population - Moldova (%)
Place of birth for the foreign-born population - Poland (%)
Place of birth for the foreign-born population - Romania (%)
Place of birth for the foreign-born population - Russia (%)
Place of birth for the foreign-born population - Serbia (%)
Place of birth for the foreign-born population - Ukraine (%)
Place of birth for the foreign-born population - Other Eastern Europe (%)
Place of birth for the foreign-born population - China (%)
Place of birth for the foreign-born population - Hong Kong (%)
Place of birth for the foreign-born population - Taiwan (%)
Place of birth for the foreign-born population - Japan (%)
Place of birth for the foreign-born population - Korea (%)
Place of birth for the foreign-born population - Other Eastern Asia (%)
Place of birth for the foreign-born population - Afghanistan (%)
Place of birth for the foreign-born population - Bangladesh (%)
Place of birth for the foreign-born population - India (%)
Place of birth for the foreign-born population - Iran (%)
Place of birth for the foreign-born population - Kazakhstan (%)
Place of birth for the foreign-born population - Nepal (%)
Place of birth for the foreign-born population - Pakistan (%)
Place of birth for the foreign-born population - Sri Lanka (%)
Place of birth for the foreign-born population - Uzbekistan (%)
Place of birth for the foreign-born population - Other South Central Asia (%)
Place of birth for the foreign-born population - Burma (%)
Place of birth for the foreign-born population - Cambodia (%)
Place of birth for the foreign-born population - Indonesia (%)
Place of birth for the foreign-born population - Laos (%)
Place of birth for the foreign-born population - Malaysia (%)
Place of birth for the foreign-born population - Philippines (%)
Place of birth for the foreign-born population - Singapore (%)
Place of birth for the foreign-born population - Thailand (%)
Place of birth for the foreign-born population - Vietnam (%)
Place of birth for the foreign-born population - Other South Eastern Asia (%)
Place of birth for the foreign-born population - Armenia (%)
Place of birth for the foreign-born population - Iraq (%)
Place of birth for the foreign-born population - Israel (%)
Place of birth for the foreign-born population - Jordan (%)
Place of birth for the foreign-born population - Kuwait (%)
Place of birth for the foreign-born population - Lebanon (%)
Place of birth for the foreign-born population - Saudi Arabia (%)
Place of birth for the foreign-born population - Syria (%)
Place of birth for the foreign-born population - Turkey (%)
Place of birth for the foreign-born population - Yemen (%)
Place of birth for the foreign-born population - Other Western Asia (%)
Place of birth for the foreign-born population - Eritrea (%)
Place of birth for the foreign-born population - Ethiopia (%)
Place of birth for the foreign-born population - Kenya (%)
Place of birth for the foreign-born population - Somalia (%)
Place of birth for the foreign-born population - Uganda (%)
Place of birth for the foreign-born population - Zimbabwe (%)
Place of birth for the foreign-born population - Other Eastern Africa (%)
Place of birth for the foreign-born population - Cameroon (%)
Place of birth for the foreign-born population - Congo (%)
Place of birth for the foreign-born population - Democratic Republic of Congo (Zaire) (%)
Place of birth for the foreign-born population - Other Middle Africa (%)
Place of birth for the foreign-born population - Egypt (%)
Place of birth for the foreign-born population - Morocco (%)
Place of birth for the foreign-born population - Sudan (%)
Place of birth for the foreign-born population - Other Northern Africa (%)
Place of birth for the foreign-born population - South Africa (%)
Place of birth for the foreign-born population - Other Southern Africa (%)
Place of birth for the foreign-born population - Cabo Verde (%)
Place of birth for the foreign-born population - Ghana (%)
Place of birth for the foreign-born population - Liberia (%)
Place of birth for the foreign-born population - Nigeria (%)
Place of birth for the foreign-born population - Senegal (%)
Place of birth for the foreign-born population - Sierra Leone (%)
Place of birth for the foreign-born population - Other Western Africa (%)
Place of birth for the foreign-born population - Australia (%)
Place of birth for the foreign-born population - New Zealand (%)
Place of birth for the foreign-born population - Fiji (%)
Place of birth for the foreign-born population - Micronesia (%)
Place of birth for the foreign-born population - Bahamas (%)
Place of birth for the foreign-born population - Barbados (%)
Place of birth for the foreign-born population - Cuba (%)
Place of birth for the foreign-born population - Dominica (%)
Place of birth for the foreign-born population - Dominican Republic (%)
Place of birth for the foreign-born population - Grenada (%)
Place of birth for the foreign-born population - Haiti (%)
Place of birth for the foreign-born population - Jamaica (%)
Place of birth for the foreign-born population - St. Vincent and the Grenadines (%)
Place of birth for the foreign-born population - Trinidad and Tobago (%)
Place of birth for the foreign-born population - West Indies (%)
Place of birth for the foreign-born population - Other Caribbean (%)
Place of birth for the foreign-born population - Belize (%)
Place of birth for the foreign-born population - Costa Rica (%)
Place of birth for the foreign-born population - El Salvador (%)
Place of birth for the foreign-born population - Guatemala (%)
Place of birth for the foreign-born population - Honduras (%)
Place of birth for the foreign-born population - Mexico (%)
Place of birth for the foreign-born population - Nicaragua (%)
Place of birth for the foreign-born population - Panama (%)
Place of birth for the foreign-born population - Other Central America (%)
Place of birth for the foreign-born population - Argentina (%)
Place of birth for the foreign-born population - Bolivia (%)
Place of birth for the foreign-born population - Brazil (%)
Place of birth for the foreign-born population - Chile (%)
Place of birth for the foreign-born population - Colombia (%)
Place of birth for the foreign-born population - Ecuador (%)
Place of birth for the foreign-born population - Guyana (%)
Place of birth for the foreign-born population - Peru (%)
Place of birth for the foreign-born population - Uruguay (%)
Place of birth for the foreign-born population - Venezuela (%)
Place of birth for the foreign-born population - Other South America (%)
Place of birth for the foreign-born population - Canada (%)
Place of birth for the foreign-born population - Other Northern America (%)
Place of birth for the foreign-born population - Other (%)
Latest news about races in Independence, KY collected exclusively by city-data.com from local newspapers, TV, and radio stations
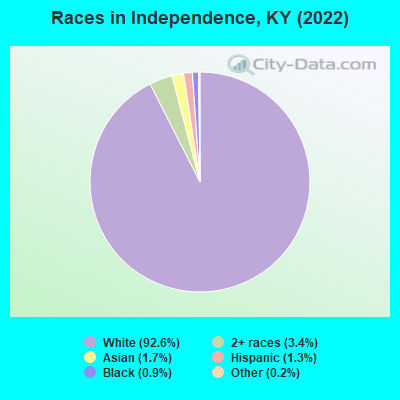
According to 2022 data, the most numerous races in Independence, KY are White alone (26,785 residents), Black alone (248 residents), and Hispanic (383 residents). 97.5% of Independence residents speak English at home. 2.2% of Independence, KY residents are foreign-born (1.6% born in Asia, 0.4% born in Europe), which is 80.3% less than the foreign-born rate of 4.0% across the entire state of Kentucky.
Race distribution in Independence
2000 2022
3,608,013 89.3% White alone 293,639 7.3% Black alone 59,939 1.5% Hispanic 37,750 0.9% Two or more races 29,368 0.7% Asian alone 7,939 0.2% American Indian alone 3,846 0.10% Other race alone 1,275 0.03% Native Hawaiian and Other
3,710,998 82.2% White alone 343,194 7.6% Black alone 187,483 4.2% Hispanic 187,394 4.2% Two or more races 62,240 1.4% Asian alone 13,529 0.3% Other race alone 4,302 0.10% American Indian alone 3,170 0.07% Native Hawaiian and Other
Income and house value in Independence Median household income in 2022 $90,779 White non-Hispanic householders$117,919 Black householders$120,330 Asian householders$147,646 Two or more races householdersMedian 2022 house value $249,401 White Non-Hispanic householders$229,815 Black or African American householders$75,516 Two or more races householders$278,781 Hispanic or Latino householders
Median age by race in Independence
35.1 Median age for White residents34.9 35.6 28.1 Median age for Black or African American residents38.8 -459,259,258.8 -521,556,256.1 Median age for American Indian / Alaska Native residents-607,449,856.1 -630,065,358.8 36.7 Median age for Asian residents34.4 46.3 -666,666,666.0 Median age for Native Hawaiian / Pacific Islander residents-666,666,666.0 -666,666,666.0 27.8 Median age for Other race residents21.0 -736,990,154.0 18.5 Median age for Two or more races residents12.8 26.6 35.3 Median age for White alone residents35.0 35.7 23.8 Median age for Hispanic or Latino residents22.3 29.7
Owner/renter occupied households by race in Independence
House owners and renters - White residents 8,083 83.3% Owner occupied1,621 16.7% Renter occupiedHouse owners and renters - Black or African American residents 59 78.9% Owner occupied16 21.1% Renter occupiedHouse owners and renters - American Indian / Alaska Native residents 6 68.7% Owner occupied3 31.3% Renter occupiedHouse owners and renters - Asian residents 85 58.7% Owner occupied60 41.3% Renter occupiedHouse owners and renters - Two or more races residents 173 82.5% Owner occupied37 17.5% Renter occupiedHouse owners and renters - White alone residents 8,123 83.4% Owner occupied1,617 16.6% Renter occupiedHouse owners and renters - Hispanic or Latino residents 25 66.8% Owner occupied12 33.2% Renter occupied
Language usage in Independence
English speakers - Total 97.5% of residents of Independence speak English at home.
0.9% of residents speak Spanish at home 137 56.6% Speak English very well105 43.4% Speak English less than very well2.2% of residents speak other language at home 352 60.0% Speak English very well235 40.0% Speak English less than very well
English speakers - Born in the United States 98.8% of residents of Independence speak English at home.
0.9% of residents speak Spanish at home 45 47.9% Speak English very well49 52.1% Speak English less than very well0.6% of residents speak other language at home 59 89.4% Speak English very well7 10.6% Speak English less than very well
English speakers - Native, born elsewhere 93.9% of residents of Independence speak English at home.
7.9% of residents speak Spanish at home 31 100.0% Speak English very well
English speakers - Foreign-born 33.4% of residents of Independence speak English at home.
3.6% of residents speak Spanish at home 21 100.0% Speak English very well70.5% of residents speak other language at home 191 46.2% Speak English very well222 53.8% Speak English less than very well
White (Caucasian) - Speak only English Native:
99.3% (24,540)Foreign-born:
12.1% (34)
White (Caucasian) - Speak another language Native:
0.8% (200)Foreign-born:
87.8% (247)
Black or African American - Speak only English Native:
100.0% (293)Foreign-born:
61.5% (25)
Asian - Speak only English Native:
45.2% (31)Foreign-born:
16.5% (55)
Asian - Speak another language Native:
29.9% (21)Foreign-born:
79.7% (269)
Two or more races - Speak only English Native:
91.5% (1,125)Foreign-born:
100.0% (61)
White alone - Speak only English Native:
99.0% (24,314)Foreign-born:
11.7% (35)
White alone - Speak another language Native:
1.0% (247)Foreign-born:
89.8% (265)
Hispanic or Latino - Speak only English Native:
100.0% (436)Foreign-born:
100.0% (20)
Hispanic or Latino - Speak another language Native:
6.9% (30)Foreign-born:
36.0% (7)
Foreign-born residents in Independence 642 residents are foreign born (1.6% Asia , 0.4% Europe ).
This city:
2.2%Kentucky:
4.1%
Marital status for residents in Independence Marital status - White (Caucasian) population 15 years and over
Males 29.7% Never married57.6% Now married0.8% Separated2.0% Widowed9.9% DivorcedFemales 28.4% Never married53.8% Now married1.8% Separated5.6% Widowed10.5% DivorcedWomen who gave birth in the past 12 months Now married:
100.0% (349)Unmarried:
0.0% (0)
Women who did not give birth in the past 12 months Now married:
51.7% (3,505)Unmarried:
48.3% (3,270)
Marital status - Black or African American population 15 years and over
Males 9.7% Never married59.5% Now married0.0% Separated8.6% Widowed22.2% DivorcedFemales 89.1% Never married10.9% Now married0.0% Separated0.0% Widowed0.0% DivorcedWomen who did not give birth in the past 12 months Now married:
0.0% (0)Unmarried:
100.0% (123)
Marital status - Asian population 15 years and over
Males 12.9% Never married43.5% Now married0.0% Separated0.0% Widowed43.5% DivorcedFemales 29.3% Never married70.7% Now married0.0% Separated0.0% Widowed0.0% DivorcedWomen who gave birth in the past 12 months Now married:
100.0% (51)Unmarried:
0.0% (0)
Women who did not give birth in the past 12 months Now married:
97.5% (69)Unmarried:
2.5% (2)
Marital status - Two or more races population 15 years and over
Males 46.7% Never married36.3% Now married0.0% Separated0.0% Widowed17.0% DivorcedFemales 56.4% Never married38.7% Now married0.0% Separated1.1% Widowed3.9% DivorcedWomen who did not give birth in the past 12 months Now married:
27.3% (59)Unmarried:
72.7% (156)
Marital status - White alone, not Hispanic / Latino population 15 years and over
Males 29.4% Never married57.8% Now married0.9% Separated2.0% Widowed9.9% DivorcedFemales 28.5% Never married53.6% Now married1.8% Separated5.7% Widowed10.4% DivorcedWomen who gave birth in the past 12 months Now married:
100.0% (347)Unmarried:
0.0% (0)
Women who did not give birth in the past 12 months Now married:
51.6% (3,442)Unmarried:
48.4% (3,226)
Marital status - Hispanic or Latino population 15 years and over
Males 45.8% Never married35.9% Now married0.0% Separated14.8% Widowed3.5% DivorcedFemales 35.7% Never married50.0% Now married0.0% Separated5.8% Widowed8.4% DivorcedWomen who did not give birth in the past 12 months Now married:
45.6% (62)Unmarried:
54.4% (74)
Ancestries in Independence
3,335 29.0% German2,097 18.2% English1,838 16.0% American911 7.9% Irish589 5.1% European247 2.1% Italian229 2.0% Lebanese169 1.5% Dutch138 1.2% Polish117 1.0% French84 0.7% Scotch-Irish55 0.5% Lithuanian23 0.2% Haitian22 0.2% British22 0.2% Scottish21 0.2% Greek20 0.2% Turkish19 0.2% Danish18 0.2% Austrian15 0.1% Portuguese15 0.1% Russian15 0.1% Welsh13 0.1% Slavic10 0.09% Norwegian10 0.09% Serbian6 0.05% Hungarian
Geographical mobility in Independence Same house 1 year ago 25,024 93.4% White (Caucasian)292 88.5% Black or African American12 91.6% American Indian / Alaska Native334 97.9% Asian96 100.0% Other race1,218 98.1% Two or more races24,774 93.2% White alone, not Hispanic / Latino340 90.8% Hispanic or LatinoMoved within same county 603 2.2% White / Caucasian11 3.4% Black or African American26 2.1% Two or more races625 2.4% White alone, not Hispanic / LatinoMoved within same state 1,044 3.9% White / Caucasian16 5.0% Black or African American12 1.0% Two or more races1,052 4.0% White alone, not Hispanic / LatinoMoved from different state 333 1.2% White / Caucasian12 3.7% Black or African American68 5.4% Two or more races290 1.1% White alone, not Hispanic / Latino41 11.0% Hispanic or LatinoMoved from abroad 12 0.0% White12 0.0% White alone, not Hispanic / Latino
Children Nativity (place of birth) in Independence
Children under 6 years - Living with two parents Both parents native 1,804 100.0% NativeBoth parents foreign-born 42 100.0% NativeChildren under 6 years - Living with one parent Native parent 472 100.0% Native
Children 6 to 17 years - Living with two parents Both parents native 3,623 99.4% Native23 0.6% Foreign-bornBoth parents foreign-born 33 100.0% NativeOne native, one foreign-born parent 52 100.0% NativeChildren 6 to 17 years - Living with one parent Native parent 1,133 100.0% Native
Grandparents responsible for own grandchildren in Independence
Grandparents (30 to 59 years) White / Caucasian 200 37.4% Responsible for grandchildren336 62.6% Not responsible for grandchildrenWhite alone, not Hispanic / Latino 200 37.4% Responsible for grandchildren336 62.6% Not responsible for grandchildrenGrandparents (60 years and over) White / Caucasian 61 36.0% Responsible for grandchildren108 64.0% Not responsible for grandchildrenWhite alone, not Hispanic / Latino 61 36.0% Responsible for grandchildren108 64.0% Not responsible for grandchildren