Races in James Island, South Carolina (SC) Detailed Stats
Ancestries, Foreign-born residents, place of birth
Data:
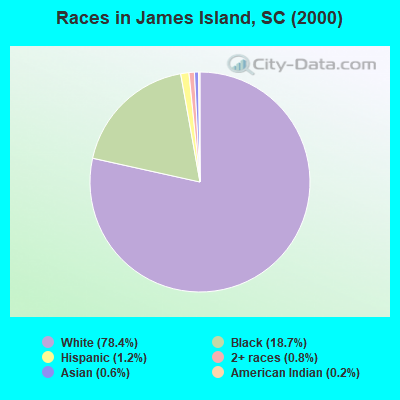
Race distribution in James Island

- 26,55378.4%White alone
- 6,34318.7%Black alone
- 4131.2%Hispanic
- 2610.8%Two or more races
- 2090.6%Asian alone
- 640.2%American Indian alone
- 210.06%Other race alone
- 70.02%Native Hawaiian and Other
Pacific Islander alone
2000
2022
-
- 2,652,29166.1%White alone
- 1,178,48629.4%Black alone
- 95,0762.4%Hispanic
- 35,5680.9%Asian alone
- 33,2900.8%Two or more races
- 12,7650.3%American Indian alone
- 3,2660.08%Other race alone
- 1,2700.03%Native Hawaiian and Other
Pacific Islander alone
-
- 3,301,73962.5%White alone
- 1,313,29024.9%Black alone
- 343,7836.5%Hispanic
- 190,5083.6%Two or more races
- 89,8881.7%Asian alone
- 29,3900.6%Other race alone
- 12,1120.2%American Indian alone
- 1,9240.04%Native Hawaiian and Other
Pacific Islander alone
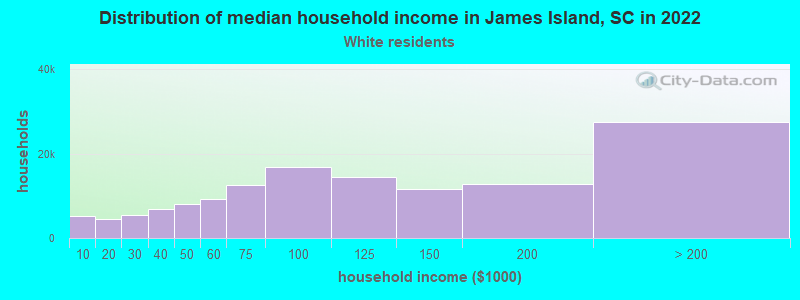
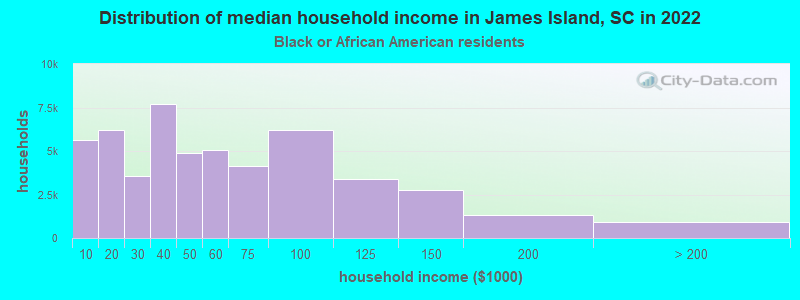
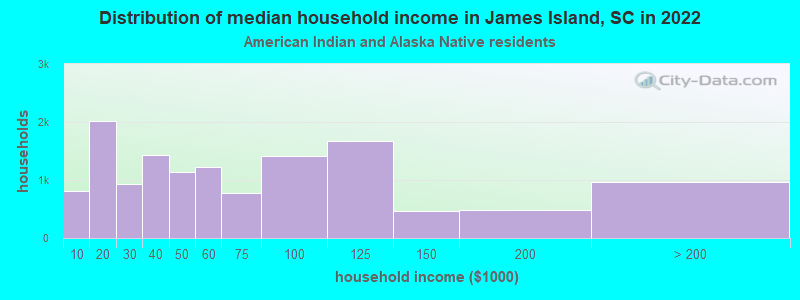
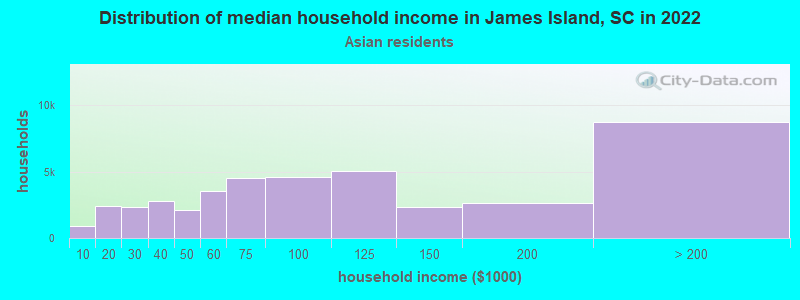
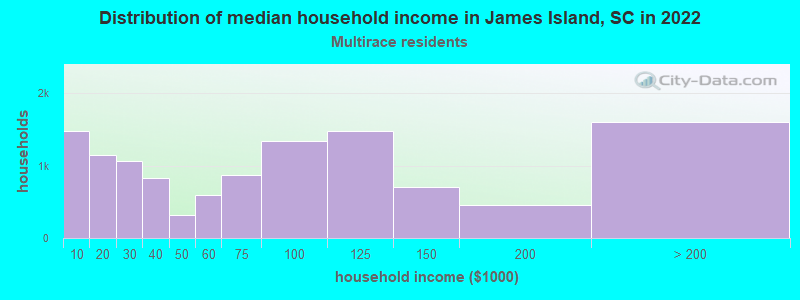
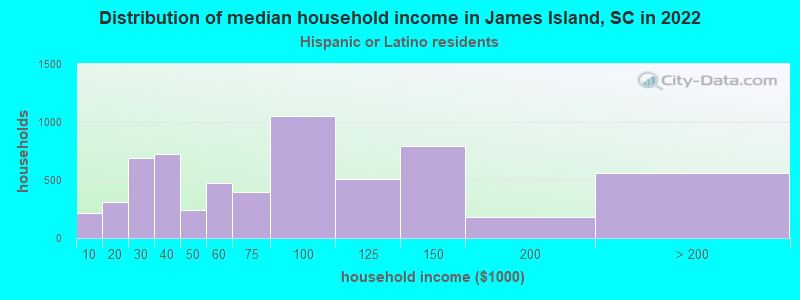
Income and house value in James Island
- Median household income in 2022
- $105,792White non-Hispanic householders
- $61,281Black householders
- $147,806American Indian and Alaska Native householders
- $87,527Asian householders
- $57,006Some other race householders
- $104,203Two or more races householders
- $84,806Hispanic or Latino race householders
- Median 2022 house value
- $596,472White Non-Hispanic householders
- $350,964Black or African American householders
- $361,385American Indian or Alaska Native householders
- $422,657Asian householders
- $395,981Two or more races householders
- $487,265Hispanic or Latino householders