Races in Jupiter, Florida (FL) Detailed Stats
Data:
Races - White alone (%)
Races - White alone (% change since 2000)
Races - Black alone (%)
Races - Black alone (% change since 2000)
Races - American Indian alone (%)
Races - American Indian alone (% change since 2000)
Races - Asian alone (%)
Races - Asian alone (% change since 2000)
Races - Hispanic (%)
Races - Hispanic (% change since 2000)
Races - Native Hawaiian and Other Pacific Islander alone (%)
Races - Native Hawaiian and Other Pacific Islander alone (% change since 2000)
Races - Two or more races(%)
Races - Two or more races(% change since 2000)
Races - Other race alone (%)
Races - Other race alone (% change since 2000)
Racial diversity
Place of birth - Born in state of residence (%)
Place of birth - Born in state of residence (%) - White
Place of birth - Born in state of residence (%) - Black or African American
Place of birth - Born in state of residence (%) - Asian
Place of birth - Born in state of residence (%) - Hispanic or Latino
Place of birth - Born in state of residence (%) - American Indian and Alaska Native
Place of birth - Born in state of residence (%) - Multirace
Place of birth - Born in state of residence (%) - Other Race
Place of birth - Born in other state (%)
Place of birth - Born in other state (%) - White
Place of birth - Born in other state (%) - Black or African American
Place of birth - Born in other state (%) - Asian
Place of birth - Born in other state (%) - Hispanic or Latino
Place of birth - Born in other state (%) - American Indian and Alaska Native
Place of birth - Born in other state (%) - Multirace
Place of birth - Born in other state (%) - Other Race
Place of birth - Native, outside of US (%)
Place of birth - Native, outside of US (%) - White
Place of birth - Native, outside of US (%) - Black or African American
Place of birth - Native, outside of US (%) - Asian
Place of birth - Native, outside of US (%) - Hispanic or Latino
Place of birth - Native, outside of US (%) - American Indian and Alaska Native
Place of birth - Native, outside of US (%) - Multirace
Place of birth - Native, outside of US (%) - Other Race
Place of birth - Foreign born (%)
Place of birth - Foreign born (%) - White
Place of birth - Foreign born (%) - Black or African American
Place of birth - Foreign born (%) - Asian
Place of birth - Foreign born (%) - Hispanic or Latino
Place of birth - Foreign born (%) - American Indian and Alaska Native
Place of birth - Foreign born (%) - Multirace
Place of birth - Foreign born (%) - Other Race
Residents speaking English at home (%)
Residents speaking English at home - Born in the United States (%)
Residents speaking English at home - Native, born elsewhere (%)
Residents speaking English at home - Foreign born (%)
Residents speaking Spanish at home (%)
Residents speaking Spanish at home - Born in the United States (%)
Residents speaking Spanish at home - Native, born elsewhere (%)
Residents speaking Spanish at home - Foreign born (%)
Residents speaking other language at home (%)
Residents speaking other language at home - Born in the United States (%)
Residents speaking other language at home - Native, born elsewhere (%)
Residents speaking other language at home - Foreign born (%)
Marital status - Never married (%)
Marital status - Now married (%)
Marital status - Separated (%)
Marital status - Widowed (%)
Marital status - Divorced (%)
Ancestries Reported - Arab (%)
Ancestries Reported - Czech (%)
Ancestries Reported - Danish (%)
Ancestries Reported - Dutch (%)
Ancestries Reported - English (%)
Ancestries Reported - French (%)
Ancestries Reported - French Canadian (%)
Ancestries Reported - German (%)
Ancestries Reported - Greek (%)
Ancestries Reported - Hungarian (%)
Ancestries Reported - Irish (%)
Ancestries Reported - Italian (%)
Ancestries Reported - Lithuanian (%)
Ancestries Reported - Norwegian (%)
Ancestries Reported - Polish (%)
Ancestries Reported - Portuguese (%)
Ancestries Reported - Russian (%)
Ancestries Reported - Scotch-Irish (%)
Ancestries Reported - Scottish (%)
Ancestries Reported - Slovak (%)
Ancestries Reported - Subsaharan African (%)
Ancestries Reported - Swedish (%)
Ancestries Reported - Swiss (%)
Ancestries Reported - Ukrainian (%)
Ancestries Reported - United States (%)
Ancestries Reported - Welsh (%)
Ancestries Reported - West Indian (%)
Ancestries Reported - Other (%)
Geographical mobility - Same house 1 year ago (%)
Geographical mobility - Same house 1 year ago (%) - White
Geographical mobility - Same house 1 year ago (%) - Black or African American
Geographical mobility - Same house 1 year ago (%) - Asian
Geographical mobility - Same house 1 year ago (%) - Hispanic or Latino
Geographical mobility - Same house 1 year ago (%) - American Indian and Alaska Native
Geographical mobility - Same house 1 year ago (%) - Multirace
Geographical mobility - Same house 1 year ago (%) - Other Race
Geographical mobility - Moved within same county (%)
Geographical mobility - Moved within same county (%) - White
Geographical mobility - Moved within same county (%) - Black or African American
Geographical mobility - Moved within same county (%) - Asian
Geographical mobility - Moved within same county (%) - Hispanic or Latino
Geographical mobility - Moved within same county (%) - American Indian and Alaska Native
Geographical mobility - Moved within same county (%) - Multirace
Geographical mobility - Moved within same county (%) - Other Race
Geographical mobility - Moved from different county within same state (%)
Geographical mobility - Moved from different county within same state (%) - White
Geographical mobility - Moved from different county within same state (%) - Black or African American
Geographical mobility - Moved from different county within same state (%) - Asian
Geographical mobility - Moved from different county within same state (%) - Hispanic or Latino
Geographical mobility - Moved from different county within same state (%) - American Indian and Alaska Native
Geographical mobility - Moved from different county within same state (%) - Multirace
Geographical mobility - Moved from different county within same state (%) - Other Race
Geographical mobility - Moved from different state (%)
Geographical mobility - Moved from different state (%) - White
Geographical mobility - Moved from different state (%) - Black or African American
Geographical mobility - Moved from different state (%) - Asian
Geographical mobility - Moved from different state (%) - Hispanic or Latino
Geographical mobility - Moved from different state (%) - American Indian and Alaska Native
Geographical mobility - Moved from different state (%) - Multirace
Geographical mobility - Moved from different state (%) - Other Race
Geographical mobility - Moved from abroad (%)
Geographical mobility - Moved from abroad (%) - White
Geographical mobility - Moved from abroad (%) - Black or African American
Geographical mobility - Moved from abroad (%) - Asian
Geographical mobility - Moved from abroad (%) - Hispanic or Latino
Geographical mobility - Moved from abroad (%) - American Indian and Alaska Native
Geographical mobility - Moved from abroad (%) - Multirace
Geographical mobility - Moved from abroad (%) - Other Race
Place of birth for the foreign-born population - Ireland (%)
Place of birth for the foreign-born population - Denmark (%)
Place of birth for the foreign-born population - Norway (%)
Place of birth for the foreign-born population - Sweden (%)
Place of birth for the foreign-born population - United Kingdom (%)
Place of birth for the foreign-born population - England (%)
Place of birth for the foreign-born population - Scotland (%)
Place of birth for the foreign-born population - Other Northern Europe (%)
Place of birth for the foreign-born population - Austria (%)
Place of birth for the foreign-born population - Belgium (%)
Place of birth for the foreign-born population - France (%)
Place of birth for the foreign-born population - Germany (%)
Place of birth for the foreign-born population - Netherlands (%)
Place of birth for the foreign-born population - Switzerland (%)
Place of birth for the foreign-born population - Other Western Europe (%)
Place of birth for the foreign-born population - Greece (%)
Place of birth for the foreign-born population - Italy (%)
Place of birth for the foreign-born population - Portugal (%)
Place of birth for the foreign-born population - Spain (%)
Place of birth for the foreign-born population - Other Southern Europe (%)
Place of birth for the foreign-born population - Albania (%)
Place of birth for the foreign-born population - Belarus (%)
Place of birth for the foreign-born population - Bosnia and Herzegovina (%)
Place of birth for the foreign-born population - Bulgaria (%)
Place of birth for the foreign-born population - Croatia (%)
Place of birth for the foreign-born population - Czechoslovakia (%)
Place of birth for the foreign-born population - Hungary (%)
Place of birth for the foreign-born population - Latvia (%)
Place of birth for the foreign-born population - Lithuania (%)
Place of birth for the foreign-born population - North Macedonia (Macedonia) (%)
Place of birth for the foreign-born population - Moldova (%)
Place of birth for the foreign-born population - Poland (%)
Place of birth for the foreign-born population - Romania (%)
Place of birth for the foreign-born population - Russia (%)
Place of birth for the foreign-born population - Serbia (%)
Place of birth for the foreign-born population - Ukraine (%)
Place of birth for the foreign-born population - Other Eastern Europe (%)
Place of birth for the foreign-born population - China (%)
Place of birth for the foreign-born population - Hong Kong (%)
Place of birth for the foreign-born population - Taiwan (%)
Place of birth for the foreign-born population - Japan (%)
Place of birth for the foreign-born population - Korea (%)
Place of birth for the foreign-born population - Other Eastern Asia (%)
Place of birth for the foreign-born population - Afghanistan (%)
Place of birth for the foreign-born population - Bangladesh (%)
Place of birth for the foreign-born population - India (%)
Place of birth for the foreign-born population - Iran (%)
Place of birth for the foreign-born population - Kazakhstan (%)
Place of birth for the foreign-born population - Nepal (%)
Place of birth for the foreign-born population - Pakistan (%)
Place of birth for the foreign-born population - Sri Lanka (%)
Place of birth for the foreign-born population - Uzbekistan (%)
Place of birth for the foreign-born population - Other South Central Asia (%)
Place of birth for the foreign-born population - Burma (%)
Place of birth for the foreign-born population - Cambodia (%)
Place of birth for the foreign-born population - Indonesia (%)
Place of birth for the foreign-born population - Laos (%)
Place of birth for the foreign-born population - Malaysia (%)
Place of birth for the foreign-born population - Philippines (%)
Place of birth for the foreign-born population - Singapore (%)
Place of birth for the foreign-born population - Thailand (%)
Place of birth for the foreign-born population - Vietnam (%)
Place of birth for the foreign-born population - Other South Eastern Asia (%)
Place of birth for the foreign-born population - Armenia (%)
Place of birth for the foreign-born population - Iraq (%)
Place of birth for the foreign-born population - Israel (%)
Place of birth for the foreign-born population - Jordan (%)
Place of birth for the foreign-born population - Kuwait (%)
Place of birth for the foreign-born population - Lebanon (%)
Place of birth for the foreign-born population - Saudi Arabia (%)
Place of birth for the foreign-born population - Syria (%)
Place of birth for the foreign-born population - Turkey (%)
Place of birth for the foreign-born population - Yemen (%)
Place of birth for the foreign-born population - Other Western Asia (%)
Place of birth for the foreign-born population - Eritrea (%)
Place of birth for the foreign-born population - Ethiopia (%)
Place of birth for the foreign-born population - Kenya (%)
Place of birth for the foreign-born population - Somalia (%)
Place of birth for the foreign-born population - Uganda (%)
Place of birth for the foreign-born population - Zimbabwe (%)
Place of birth for the foreign-born population - Other Eastern Africa (%)
Place of birth for the foreign-born population - Cameroon (%)
Place of birth for the foreign-born population - Congo (%)
Place of birth for the foreign-born population - Democratic Republic of Congo (Zaire) (%)
Place of birth for the foreign-born population - Other Middle Africa (%)
Place of birth for the foreign-born population - Egypt (%)
Place of birth for the foreign-born population - Morocco (%)
Place of birth for the foreign-born population - Sudan (%)
Place of birth for the foreign-born population - Other Northern Africa (%)
Place of birth for the foreign-born population - South Africa (%)
Place of birth for the foreign-born population - Other Southern Africa (%)
Place of birth for the foreign-born population - Cabo Verde (%)
Place of birth for the foreign-born population - Ghana (%)
Place of birth for the foreign-born population - Liberia (%)
Place of birth for the foreign-born population - Nigeria (%)
Place of birth for the foreign-born population - Senegal (%)
Place of birth for the foreign-born population - Sierra Leone (%)
Place of birth for the foreign-born population - Other Western Africa (%)
Place of birth for the foreign-born population - Australia (%)
Place of birth for the foreign-born population - New Zealand (%)
Place of birth for the foreign-born population - Fiji (%)
Place of birth for the foreign-born population - Micronesia (%)
Place of birth for the foreign-born population - Bahamas (%)
Place of birth for the foreign-born population - Barbados (%)
Place of birth for the foreign-born population - Cuba (%)
Place of birth for the foreign-born population - Dominica (%)
Place of birth for the foreign-born population - Dominican Republic (%)
Place of birth for the foreign-born population - Grenada (%)
Place of birth for the foreign-born population - Haiti (%)
Place of birth for the foreign-born population - Jamaica (%)
Place of birth for the foreign-born population - St. Vincent and the Grenadines (%)
Place of birth for the foreign-born population - Trinidad and Tobago (%)
Place of birth for the foreign-born population - West Indies (%)
Place of birth for the foreign-born population - Other Caribbean (%)
Place of birth for the foreign-born population - Belize (%)
Place of birth for the foreign-born population - Costa Rica (%)
Place of birth for the foreign-born population - El Salvador (%)
Place of birth for the foreign-born population - Guatemala (%)
Place of birth for the foreign-born population - Honduras (%)
Place of birth for the foreign-born population - Mexico (%)
Place of birth for the foreign-born population - Nicaragua (%)
Place of birth for the foreign-born population - Panama (%)
Place of birth for the foreign-born population - Other Central America (%)
Place of birth for the foreign-born population - Argentina (%)
Place of birth for the foreign-born population - Bolivia (%)
Place of birth for the foreign-born population - Brazil (%)
Place of birth for the foreign-born population - Chile (%)
Place of birth for the foreign-born population - Colombia (%)
Place of birth for the foreign-born population - Ecuador (%)
Place of birth for the foreign-born population - Guyana (%)
Place of birth for the foreign-born population - Peru (%)
Place of birth for the foreign-born population - Uruguay (%)
Place of birth for the foreign-born population - Venezuela (%)
Place of birth for the foreign-born population - Other South America (%)
Place of birth for the foreign-born population - Canada (%)
Place of birth for the foreign-born population - Other Northern America (%)
Place of birth for the foreign-born population - Other (%)
Latest news about races in Jupiter, FL collected exclusively by city-data.com from local newspapers, TV, and radio stations
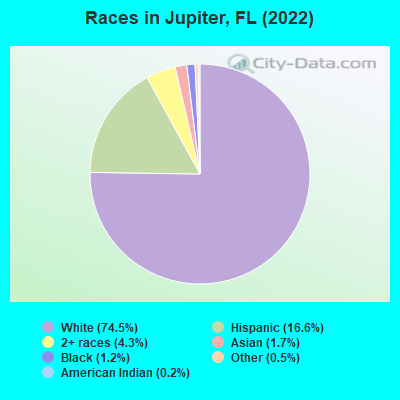
According to 2022 data, the most numerous races in Jupiter, FL are White alone (46,086 residents), Hispanic (10,266 residents), and Black alone (756 residents). 81.5% of Jupiter residents speak English at home. 15.2% of Jupiter, FL residents are foreign-born (8.9% born in Latin America, 3.2% born in Europe, 1.5% born in Asia), which is 38.3% less than the foreign-born rate of 21.0% across the entire state of Florida.
Race distribution in Jupiter
2000 2022
10,458,509 65.4% White alone 2,682,715 16.8% Hispanic 2,264,268 14.2% Black alone 261,693 1.6% Asian alone 236,954 1.5% Two or more races 42,358 0.3% American Indian alone 28,994 0.2% Other race alone 6,887 0.04% Native Hawaiian and Other
11,309,403 50.8% White alone 6,025,039 27.1% Hispanic 3,241,015 14.6% Black alone 861,630 3.9% Two or more races 623,692 2.8% Asian alone 152,054 0.7% Other race alone 22,504 0.1% American Indian alone 9,486 0.04% Native Hawaiian and Other
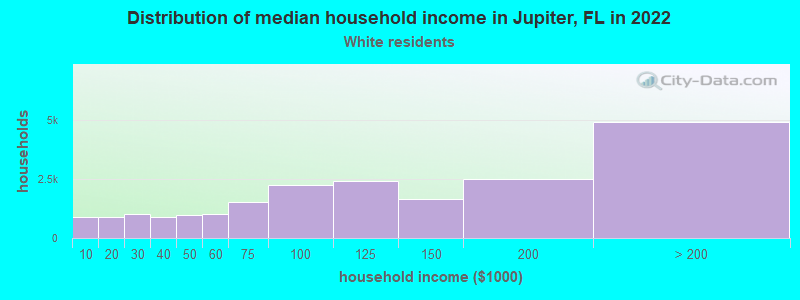
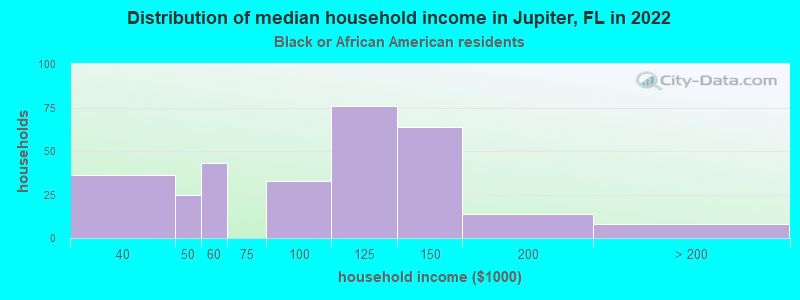
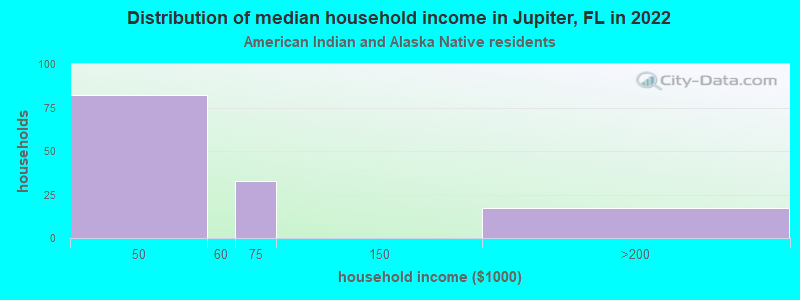
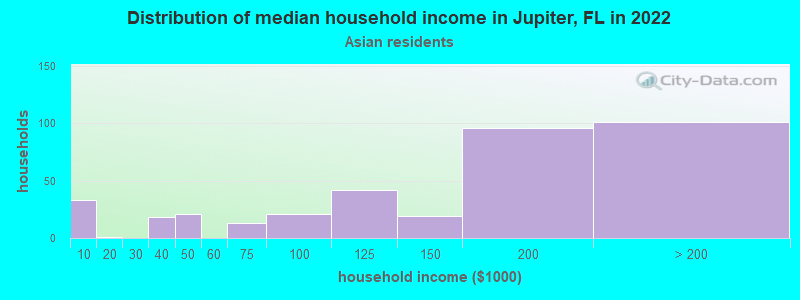
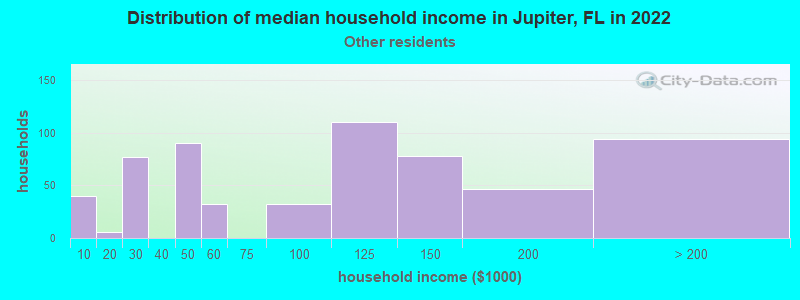
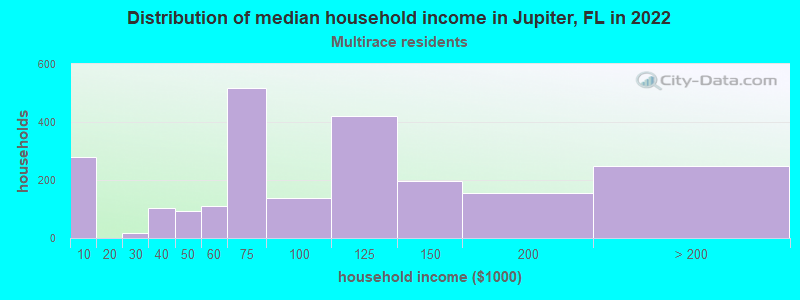
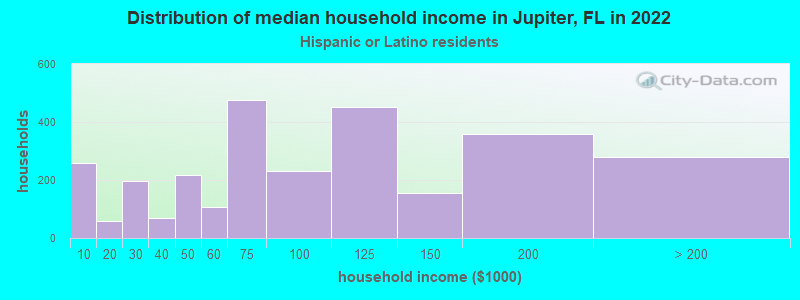
Income and house value in Jupiter Median household income in 2022 $106,887 White non-Hispanic householders$102,752 Black householders$52,840 American Indian and Alaska Native householders$146,381 Asian householders$123,145 Some other race householders$87,558 Two or more races householders$80,360 Hispanic or Latino race householdersMedian 2022 house value $620,361 White Non-Hispanic householders$643,614 Black or African American householders$311,426 American Indian or Alaska Native householders $625,344 Asian householders$483,749 Some other race householders$467,139 Two or more races householders$617,454 Hispanic or Latino householders
Median age by race in Jupiter
53.1 Median age for White residents53.1 52.9 52.7 Median age for Black or African American residents51.3 54.1 15.9 Median age for American Indian / Alaska Native residents17.8 8.7 41.3 Median age for Asian residents46.4 38.4 -674,285,713.6 Median age for Native Hawaiian / Pacific Islander residents-674,264,006.9 -672,397,325.0 45.1 Median age for Other race residents49.0 42.9 29.9 Median age for Two or more races residents24.7 34.5 52.3 Median age for White alone residents52.8 51.8 33.0 Median age for Hispanic or Latino residents28.4 41.1
Owner/renter occupied households by race in Jupiter
House owners and renters - White residents 16,948 80.8% Owner occupied4,028 19.2% Renter occupiedHouse owners and renters - Black or African American residents 250 82.0% Owner occupied55 18.0% Renter occupiedHouse owners and renters - American Indian / Alaska Native residents 39 44.1% Owner occupied50 55.9% Renter occupiedHouse owners and renters - Asian residents 306 81.9% Owner occupied68 18.1% Renter occupiedHouse owners and renters - Other race residents 255 41.2% Owner occupied364 58.8% Renter occupiedHouse owners and renters - Two or more races residents 1,491 64.4% Owner occupied824 35.6% Renter occupiedHouse owners and renters - White alone residents 16,959 79.8% Owner occupied4,291 20.2% Renter occupiedHouse owners and renters - Hispanic or Latino residents 1,677 59.7% Owner occupied1,130 40.3% Renter occupied
Language usage in Jupiter
English speakers - Total 81.5% of residents of Jupiter speak English at home.
12.1% of residents speak Spanish at home 4,108 56.9% Speak English very well3,116 43.1% Speak English less than very well6.0% of residents speak other language at home 2,591 72.4% Speak English very well987 27.6% Speak English less than very well
English speakers - Born in the United States 95.9% of residents of Jupiter speak English at home.
2.7% of residents speak Spanish at home 700 80.8% Speak English very well166 19.2% Speak English less than very well1.5% of residents speak other language at home 470 97.1% Speak English very well14 2.9% Speak English less than very well
English speakers - Native, born elsewhere 54.8% of residents of Jupiter speak English at home.
36.9% of residents speak Spanish at home 393 81.4% Speak English very well90 18.6% Speak English less than very well9.1% of residents speak other language at home 119 100.0% Speak English very well
English speakers - Foreign-born 22.3% of residents of Jupiter speak English at home.
49.3% of residents speak Spanish at home 1,871 40.8% Speak English very well2,719 59.2% Speak English less than very well27.8% of residents speak other language at home 1,653 63.9% Speak English very well935 36.1% Speak English less than very well
White (Caucasian) - Speak only English Native:
98.2% (41,447)Foreign-born:
47.9% (1,281)
White (Caucasian) - Speak another language Native:
3.5% (1,493)Foreign-born:
58.5% (1,566)
Black or African American - Speak only English Native:
99.1% (595)Foreign-born:
77.1% (128)
American Indian / Alaska Native - Speak another language Native:
62.2% (203)Foreign-born:
100.0% (113)
Asian - Speak only English Native:
68.1% (182)Foreign-born:
22.3% (158)
Asian - Speak another language Native:
33.1% (88)Foreign-born:
77.7% (552)
Other race - Speak only English Native:
33.4% (275)Foreign-born:
9.4% (111)
Other race - Speak another language Native:
66.4% (547)Foreign-born:
90.5% (1,071)
Two or more races - Speak only English Native:
78.8% (3,579)Foreign-born:
9.2% (388)
Two or more races - Speak another language Native:
18.8% (855)Foreign-born:
90.3% (3,825)
White alone - Speak only English Native:
98.0% (41,486)Foreign-born:
50.3% (1,297)
White alone - Speak another language Native:
2.3% (971)Foreign-born:
50.8% (1,310)
Hispanic or Latino - Speak only English Native:
45.8% (1,996)Foreign-born:
5.7% (294)
Hispanic or Latino - Speak another language Native:
54.5% (2,378)Foreign-born:
94.2% (4,822)
Foreign-born residents in Jupiter 9,396 residents are foreign born (8.9% Latin America , 3.2% Europe , 1.5% Asia ).
This city:
15.2%Florida:
21.1%
Marital status for residents in Jupiter Marital status - White (Caucasian) population 15 years and over
Males 29.5% Never married56.2% Now married0.6% Separated2.9% Widowed10.8% DivorcedFemales 22.3% Never married51.3% Now married1.5% Separated10.9% Widowed14.0% DivorcedWomen who gave birth in the past 12 months Now married:
88.8% (203)Unmarried:
11.2% (26)
Women who did not give birth in the past 12 months Now married:
45.1% (3,624)Unmarried:
54.9% (4,408)
Marital status - Black or African American population 15 years and over
Males 35.2% Never married54.4% Now married0.0% Separated0.0% Widowed10.5% DivorcedFemales 50.1% Never married17.9% Now married0.0% Separated20.8% Widowed11.1% DivorcedWomen who did not give birth in the past 12 months Now married:
0.0% (0)Unmarried:
100.0% (139)
Marital status - American Indian / Alaska Native population 15 years and over
Males 19.0% Never married81.0% Now married0.0% Separated0.0% Widowed0.0% DivorcedFemales 0.0% Never married100.0% Now married0.0% Separated0.0% Widowed0.0% DivorcedWomen who did not give birth in the past 12 months Now married:
100.0% (69)Unmarried:
0.0% (0)
Marital status - Asian population 15 years and over
Males 24.9% Never married70.9% Now married0.0% Separated4.2% Widowed0.0% DivorcedFemales 31.4% Never married61.4% Now married0.0% Separated1.8% Widowed5.5% DivorcedWomen who gave birth in the past 12 months Now married:
100.0% (8)Unmarried:
0.0% (0)
Women who did not give birth in the past 12 months Now married:
54.0% (208)Unmarried:
46.0% (177)
Marital status - Other race population 15 years and over
Males 47.7% Never married50.1% Now married0.0% Separated0.0% Widowed2.2% DivorcedFemales 38.2% Never married49.5% Now married0.0% Separated0.0% Widowed12.3% DivorcedWomen who did not give birth in the past 12 months Now married:
43.5% (231)Unmarried:
56.5% (300)
Marital status - Two or more races population 15 years and over
Males 40.6% Never married53.4% Now married3.2% Separated0.5% Widowed2.4% DivorcedFemales 30.2% Never married43.9% Now married0.7% Separated11.7% Widowed13.4% DivorcedWomen who gave birth in the past 12 months Now married:
100.0% (28)Unmarried:
0.0% (0)
Women who did not give birth in the past 12 months Now married:
40.5% (943)Unmarried:
59.5% (1,388)
Marital status - White alone, not Hispanic / Latino population 15 years and over
Males 27.7% Never married57.1% Now married0.6% Separated3.1% Widowed11.5% DivorcedFemales 22.1% Never married51.4% Now married1.6% Separated10.9% Widowed13.9% DivorcedWomen who gave birth in the past 12 months Now married:
88.8% (237)Unmarried:
11.2% (30)
Women who did not give birth in the past 12 months Now married:
43.5% (3,698)Unmarried:
56.5% (4,808)
Marital status - Hispanic or Latino population 15 years and over
Males 43.9% Never married52.3% Now married2.0% Separated0.3% Widowed1.5% DivorcedFemales 26.8% Never married53.0% Now married0.5% Separated11.0% Widowed8.7% DivorcedWomen who gave birth in the past 12 months Now married:
100.0% (21)Unmarried:
0.0% (0)
Women who did not give birth in the past 12 months Now married:
55.0% (1,351)Unmarried:
45.0% (1,104)
Ancestries in Jupiter
3,226 11.5% American3,052 10.9% Italian3,031 10.8% Irish1,921 6.9% German1,604 5.7% English802 2.9% European582 2.1% Polish537 1.9% Russian412 1.5% Eastern European314 1.1% Greek288 1.0% French283 1.0% French Canadian263 0.9% Scottish224 0.8% Czech213 0.8% Hungarian210 0.8% Swedish184 0.7% Canadian181 0.6% Portuguese175 0.6% Albanian165 0.6% Norwegian146 0.5% Ukrainian146 0.5% Scotch-Irish129 0.5% Belgian126 0.5% Brazilian125 0.4% Jamaican122 0.4% Dutch116 0.4% Haitian110 0.4% British92 0.3% Iranian89 0.3% Scandinavian77 0.3% Slovak73 0.3% Czechoslovakian72 0.3% Austrian60 0.2% Danish56 0.2% Finnish50 0.2% Romanian48 0.2% Lebanese41 0.1% Swiss38 0.1% Northern European34 0.1% Israeli34 0.1% Croatian30 0.1% Welsh26 0.09% Lithuanian23 0.08% Latvian23 0.08% Syrian21 0.08% Egyptian19 0.07% African18 0.06% West Indian11 0.04% Armenian11 0.04% Bahamian10 0.04% Australian9 0.03% Macedonian9 0.03% Alsatian7 0.03% Turkish6 0.02% Moroccan
Geographical mobility in Jupiter Same house 1 year ago 40,376 90.0% White (Caucasian)620 79.7% Black or African American544 100.0% American Indian / Alaska Native831 79.7% Asian27 100.0% Native Hawaiian / Pacific Islander1,826 90.1% Other race7,654 80.3% Two or more races41,210 89.6% White alone, not Hispanic / Latino8,485 83.2% Hispanic or LatinoMoved within same county 2,002 4.5% White / Caucasian74 9.5% Black or African American14 1.3% Asian52 2.6% Other race408 4.3% Two or more races2,200 4.8% White alone, not Hispanic / Latino475 4.7% Hispanic or LatinoMoved within same state 730 1.6% White / Caucasian41 5.2% Black or African American69 6.7% Asian87 4.3% Other race344 3.6% Two or more races781 1.7% White alone, not Hispanic / Latino287 2.8% Hispanic or LatinoMoved from different state 1,665 3.7% White / Caucasian23 3.0% Black or African American211 20.2% Asian35 1.7% Other race972 10.2% Two or more races1,684 3.7% White alone, not Hispanic / Latino621 6.1% Hispanic or LatinoMoved from abroad 179 0.4% White22 1.1% Other race316 3.3% Two or more races165 0.4% White alone, not Hispanic / Latino426 4.2% Hispanic or Latino
Children Nativity (place of birth) in Jupiter
Children under 6 years - Living with two parents Both parents native 1,445 100.0% NativeBoth parents foreign-born 362 84.7% Native65 15.3% Foreign-bornOne native, one foreign-born parent 523 95.4% Native25 4.6% Foreign-bornChildren under 6 years - Living with one parent Native parent 390 100.0% NativeChildren 6 to 17 years - Living with two parents Both parents native 4,319 99.6% Native19 0.4% Foreign-bornBoth parents foreign-born 647 83.2% Native131 16.8% Foreign-bornOne native, one foreign-born parent 1,326 100.0% NativeChildren 6 to 17 years - Living with one parent Native parent 1,321 100.0% NativeForeign-born parent 360 61.3% Native227 38.7% Foreign-born
Grandparents responsible for own grandchildren in Jupiter
Grandparents (30 to 59 years) White / Caucasian 14 18.9% Responsible for grandchildren60 81.1% Not responsible for grandchildrenTwo or more races 78 100.0% Not responsible for grandchildrenWhite alone, not Hispanic / Latino 16 100.0% Responsible for grandchildrenHispanic or Latino 179 100.0% Not responsible for grandchildrenGrandparents (60 years and over) White / Caucasian 64 29.5% Responsible for grandchildren153 70.5% Not responsible for grandchildrenTwo or more races 23 16.9% Responsible for grandchildren111 83.1% Not responsible for grandchildrenWhite alone, not Hispanic / Latino 76 30.6% Responsible for grandchildren172 69.4% Not responsible for grandchildrenHispanic or Latino 89 100.0% Not responsible for grandchildren