Races in Kenai, Alaska (AK) Detailed Stats
Ancestries, Foreign-born residents, place of birth
Settings
X


Recent posts about races in Kenai, Alaska on our local forum with over 2,400,000 registered users:
 | Air BNB in Mat-Su Valley or Kenai Peninsula? (4 replies) |
| Areas in the Lower 48 that remind you of Alaska? (102 replies) |
| Kenai/Soldotna Help! (3 replies) |
| Moving to Kenai/Soldotna area, when is the best time to look for a rental house? (3 replies) |
| Anchorage Trip this Monday! Suggestions Please ASAP! (50 replies) |
| Navigability of AK, phones, GPS, map (23 replies) |
Latest news about races in Kenai, AK collected exclusively by city-data.com from local newspapers, TV, and radio stations
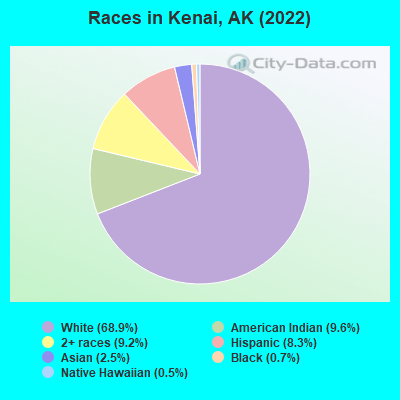
According to 2022 data, the most numerous races in Kenai, AK are White alone (5,213 residents), American Indian alone (959 residents), and Two or more races (478 residents). 90.1% of Kenai residents speak English at home. 4.7% of Kenai, AK residents are foreign-born (2.1% born in Latin America, 2.0% born in Asia, 0.5% born in Europe), which is 48.6% less than the foreign-born rate of 7.0% across the entire state of Alaska.
Race distribution in Kenai
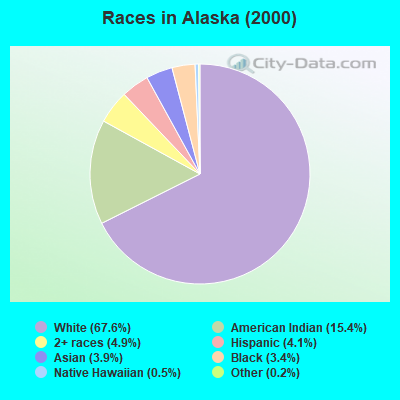
2000
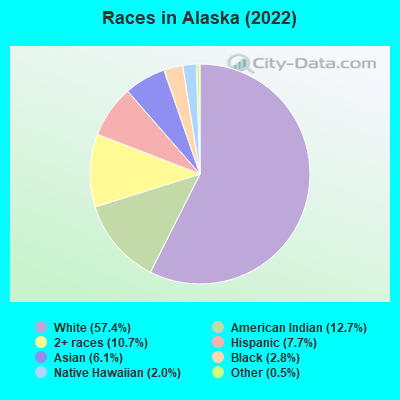
2022

- 5,60280.7%White alone
- 5938.5%American Indian alone
- 3094.5%Two or more races
- 2653.8%Hispanic
- 1111.6%Asian alone
- 340.5%Black alone
- 160.2%Native Hawaiian and Other
Pacific Islander alone - 120.2%Other race alone

-
- 5,21368.1%White alone
- 95912.5%American Indian alone
- 5417.1%Hispanic
- 4786.2%Two or more races
- 2092.7%Asian alone
- 1331.7%Native Hawaiian and Other
Pacific Islander alone - 280.4%Black alone
2000
2022
-
- 423,78867.6%White alone
- 96,50515.4%American Indian alone
- 30,4544.9%Two or more races
- 25,8524.1%Hispanic
- 24,7413.9%Asian alone
- 21,0733.4%Black alone
- 3,1810.5%Native Hawaiian and Other
Pacific Islander alone - 1,3380.2%Other race alone
-
- 421,10457.4%White alone
- 93,29412.7%American Indian alone
- 78,55210.7%Two or more races
- 56,4917.7%Hispanic
- 44,9056.1%Asian alone
- 20,6642.8%Black alone
- 14,5392.0%Native Hawaiian and Other
Pacific Islander alone - 4,0340.5%Other race alone
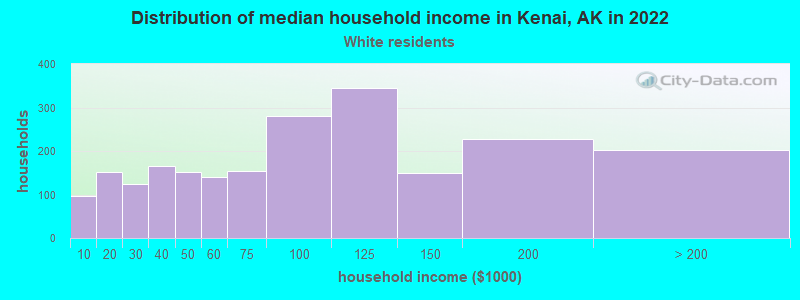
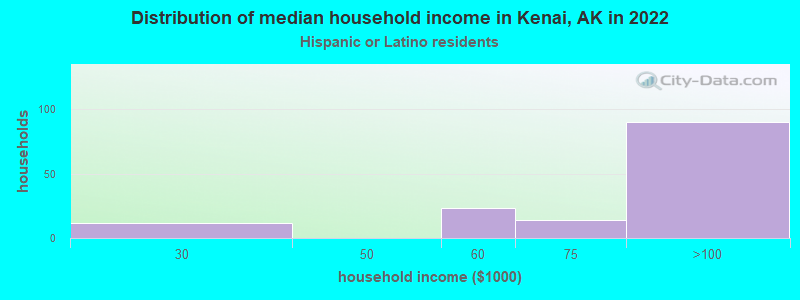
Income and house value in Kenai
- Median household income in 2022
- $70,445White non-Hispanic householders
- $58,443Black householders
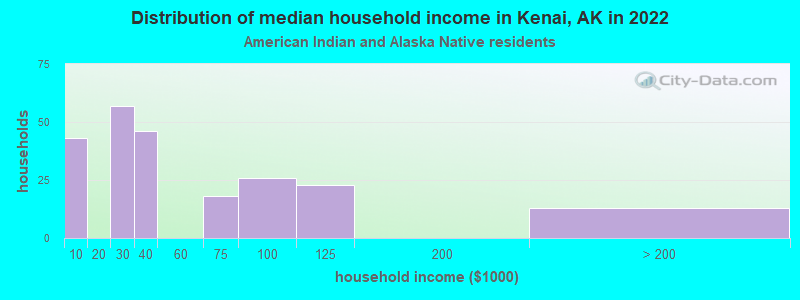
- $35,587American Indian and Alaska Native householders
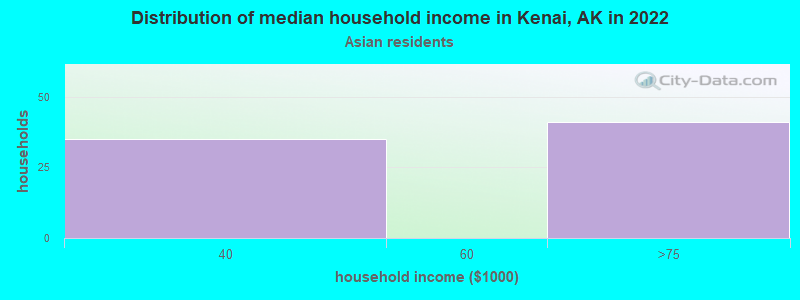
- $65,372Asian householders
- $102,350Native Hawaiian and other Pacific Islander householders
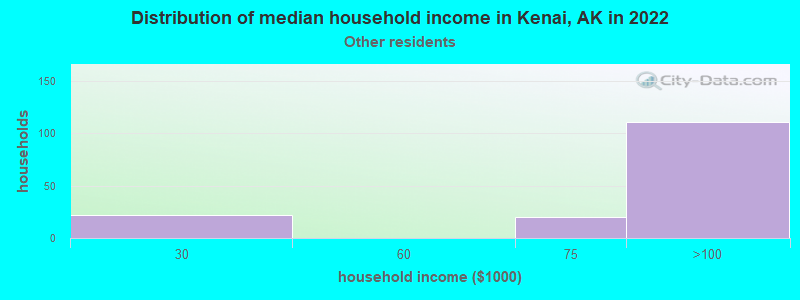
- $54,998Some other race householders
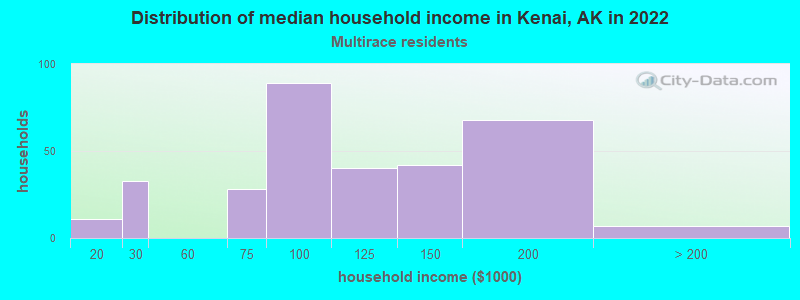
- $108,700Two or more races householders
- $32,727Hispanic or Latino race householders
- Median 2022 house value
- $283,692White Non-Hispanic householders
- $208,417Black or African American householders
- $221,412American Indian or Alaska Native householders
- $224,845Asian householders
- $398,444Some other race householders
- $241,028Two or more races householders
- $398,444Hispanic or Latino householders
Household income for White non-Hispanic householders
Household income for American Indian and Alaska Native householders
Household income for Asian householders
Household income for Some other race householders
Household income for Two or more races householders
Household income for Hispanic or Latino race householders
Median age by race in Kenai
- 42.8Median age for White residents
- 40.9Males
- 44.3Females
- 81.5Median age for Black or African American residents
- 30.7Median age for American Indian / Alaska Native residents
- 28.9Males
- 43.3Females
- 31.6Median age for Asian residents
- 27.9Males
- 55.8Females
- 25.2Median age for Native Hawaiian / Pacific Islander residents
- 26.4Males
- 29.9Females
- 38.9Median age for Other race residents
- 17.4Median age for Two or more races residents
- 14.1Males
- 24.4Females
- 41.2Median age for White alone residents
- 40.3Males
- 43.9Females
- 42.4Median age for Hispanic or Latino residents
- 42.0Males
- 44.1Females
Owner/renter occupied households by race in Kenai
- House owners and renters - White residents
- 1,77767.6%Owner occupied
- 85332.4%Renter occupied
- House owners and renters - Black or African American residents
- 22100.0%Owner occupied
- House owners and renters - American Indian / Alaska Native residents
- 11148.0%Owner occupied
- 12052.0%Renter occupied
- House owners and renters - Asian residents
- 1251.4%Owner occupied
- 1248.6%Renter occupied
- House owners and renters - Native Hawaiian / Pacific Islander residents
- 15100.0%Renter occupied
- House owners and renters - Other race residents
- 7465.4%Owner occupied
- 3934.6%Renter occupied
- House owners and renters - Two or more races residents
- 11970.7%Owner occupied
- 4929.3%Renter occupied
- House owners and renters - White alone residents
- 1,70768.8%Owner occupied
- 77331.2%Renter occupied
- House owners and renters - Hispanic or Latino residents
- 14552.9%Owner occupied
- 13047.1%Renter occupied
Language usage in Kenai
- English speakers - Total
- 90.1% of residents of Kenai speak English at home.
- 6.3% of residents speak Spanish at home
- 35276.5%Speak English very well
- 10823.5%Speak English less than very well
- 3.7% of residents speak other language at home
- 26197.4%Speak English very well
- 72.6%Speak English less than very well
- English speakers - Born in the United States
- 93.0% of residents of Kenai speak English at home.
- 4.2% of residents speak Spanish at home
- 160100.0%Speak English very well
- 2.5% of residents speak other language at home
- 8591.4%Speak English very well
- 88.6%Speak English less than very well
- English speakers - Native, born elsewhere
- 73.4% of residents of Kenai speak English at home.
- 25.9% of residents speak Spanish at home
- 36100.0%Speak English less than very well
- English speakers - Foreign-born
- 35.2% of residents of Kenai speak English at home.
- 40.2% of residents speak Spanish at home
- 8961.8%Speak English very well
- 5538.2%Speak English less than very well
- 20.9% of residents speak other language at home
- 7397.3%Speak English very well
- 22.7%Speak English less than very well
White (Caucasian) - Speak only English
| Native: | 95.9% (4,703) |
| Foreign-born: | 21.1% (40) |
White (Caucasian) - Speak another language
| Native: | 4.0% (198) |
| Foreign-born: | 73.0% (137) |
Asian - Speak only English
| Native: | 100.0% (71) |
| Foreign-born: | 54.9% (77) |
Two or more races - Speak only English
| Native: | 86.9% (537) |
| Foreign-born: | 100.0% (13) |
White alone - Speak only English
| Native: | 97.4% (4,677) |
| Foreign-born: | 37.8% (43) |
White alone - Speak another language
| Native: | 2.6% (123) |
| Foreign-born: | 57.0% (65) |
Hispanic or Latino - Speak another language
| Native: | 52.5% (250) |
| Foreign-born: | 99.7% (81) |
Foreign-born residents in Kenai
361 residents are foreign born (2.1% Latin America, 2.0% Asia, 0.5% Europe).
| This city: | 4.7% |
| Alaska: | 100.0% |


Marital status for residents in Kenai
Marital status - White (Caucasian) population 15 years and over
- Males
- 30.9%Never married
- 50.1%Now married
- 2.2%Separated
- 2.4%Widowed
- 14.4%Divorced
- Females
- 18.9%Never married
- 46.5%Now married
- 2.7%Separated
- 10.6%Widowed
- 21.3%Divorced
Women who gave birth in the past 12 months
| Now married: | 100.0% (43) |
| Unmarried: | 0.0% (0) |
Women who did not give birth in the past 12 months
| Now married: | 55.3% (596) |
| Unmarried: | 44.7% (482) |
Marital status - American Indian / Alaska Native population 15 years and over
- Males
- 48.8%Never married
- 41.1%Now married
- 0.0%Separated
- 0.0%Widowed
- 10.1%Divorced
- Females
- 28.6%Never married
- 51.3%Now married
- 6.0%Separated
- 0.0%Widowed
- 14.1%Divorced
Women who gave birth in the past 12 months
| Now married: | 76.9% (40) |
| Unmarried: | 23.1% (12) |
Women who did not give birth in the past 12 months
| Now married: | 54.8% (67) |
| Unmarried: | 45.2% (55) |
Marital status - Asian population 15 years and over
- Males
- 68.6%Never married
- 31.4%Now married
- 0.0%Separated
- 0.0%Widowed
- 0.0%Divorced
- Females
- 34.9%Never married
- 65.1%Now married
- 0.0%Separated
- 0.0%Widowed
- 0.0%Divorced
Women who did not give birth in the past 12 months
| Now married: | 0.0% (0) |
| Unmarried: | 100.0% (21) |
Marital status - Native Hawaiian / Pacific Islander population 15 years and over
- Males
- 54.2%Never married
- 45.8%Now married
- 0.0%Separated
- 0.0%Widowed
- 0.0%Divorced
- Females
- 66.7%Never married
- 33.3%Now married
- 0.0%Separated
- 0.0%Widowed
- 0.0%Divorced
Women who did not give birth in the past 12 months
| Now married: | 33.3% (14) |
| Unmarried: | 66.7% (28) |
Marital status - Two or more races population 15 years and over
- Males
- 71.8%Never married
- 5.3%Now married
- 0.0%Separated
- 0.0%Widowed
- 22.9%Divorced
- Females
- 53.8%Never married
- 35.3%Now married
- 0.0%Separated
- 0.0%Widowed
- 11.0%Divorced
Women who did not give birth in the past 12 months
| Now married: | 39.6% (81) |
| Unmarried: | 60.4% (123) |
Marital status - White alone, not Hispanic / Latino population 15 years and over
- Males
- 31.7%Never married
- 50.5%Now married
- 0.6%Separated
- 2.5%Widowed
- 14.7%Divorced
- Females
- 18.8%Never married
- 46.8%Now married
- 2.2%Separated
- 11.2%Widowed
- 21.0%Divorced
Women who gave birth in the past 12 months
| Now married: | 100.0% (44) |
| Unmarried: | 0.0% (0) |
Women who did not give birth in the past 12 months
| Now married: | 54.4% (541) |
| Unmarried: | 45.6% (454) |
Marital status - Hispanic or Latino population 15 years and over
- Males
- 37.3%Never married
- 29.2%Now married
- 13.7%Separated
- 7.7%Widowed
- 12.2%Divorced
- Females
- 27.3%Never married
- 43.6%Now married
- 8.7%Separated
- 0.0%Widowed
- 20.3%Divorced
Women who did not give birth in the past 12 months
| Now married: | 60.8% (89) |
| Unmarried: | 39.2% (57) |
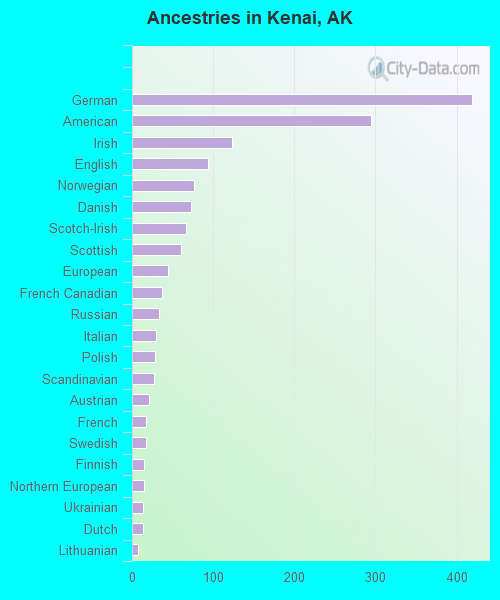
Ancestries in Kenai

- 2559.1%German
- 1645.8%Irish
- 1324.7%European
- 1304.6%American
- 1264.5%English
- 752.7%Norwegian
- 622.2%Scottish
- 612.2%Dutch
- 421.5%Polish
- 421.5%Scotch-Irish
- 401.4%French Canadian
- 381.3%Scandinavian
- 291.0%Swedish
- 220.8%French
- 190.7%Italian
- 160.6%Danish
- 150.5%Austrian
- 150.5%Romanian
- 130.5%Finnish
- 130.5%Swiss
- 120.4%Lithuanian
- 120.4%Russian
- 100.4%Sudanese
- 20.07%Bulgarian
Geographical mobility in Kenai

- Same house 1 year ago
- 4,75788.8%White (Caucasian)
- 6093.5%Black or African American
- 69478.5%American Indian / Alaska Native
- 227100.0%Asian
- 1814.4%Native Hawaiian / Pacific Islander
- 227100.0%Other race
- 55578.8%Two or more races
- 4,58686.5%White alone, not Hispanic / Latino
- 560100.0%Hispanic or Latino

-
- Moved within same county
- 3145.9%White / Caucasian
- 14015.9%American Indian / Alaska Native
- 52.2%Asian
- 8465.3%Native Hawaiian / Pacific Islander
- 10414.7%Two or more races
- 4127.8%White alone, not Hispanic / Latino

-
- Moved within same state
- 1292.4%White / Caucasian
- 20.3%American Indian / Alaska Native
- 202.8%Two or more races
- 1603.0%White alone, not Hispanic / Latino

-
- Moved from different state
- 1683.1%White / Caucasian
- 913.8%Black or African American
- 232.6%American Indian / Alaska Native
- 1462.8%White alone, not Hispanic / Latino

-
- Moved from abroad
- 30.1%White
- 40.1%White alone, not Hispanic / Latino

Children Nativity (place of birth) in Kenai
Place of birth for residents in Kenai
![Place of birth for the foreign-born population - Regions]()
- 167Americas
- 167Latin America
- 167Central America
- 155Asia
- 124South Eastern Asia
- 38Europe
- 23South Central Asia
- 20Eastern Europe
- 18Northern Europe
- 7Eastern Asia

![Place of birth for the foreign-born population - Countries]()
- 129Mexico
- 124Philippines
- 37Honduras
- 23Bangladesh
- 18Sweden
- 17Czechoslovakia
- 7Korea
- 3Bulgaria

Grandparents responsible for own grandchildren in Kenai
Zip codes: 99611.