Races in Kent, Ohio (OH) Detailed Stats
Data:
Races - White alone (%)
Races - White alone (% change since 2000)
Races - Black alone (%)
Races - Black alone (% change since 2000)
Races - American Indian alone (%)
Races - American Indian alone (% change since 2000)
Races - Asian alone (%)
Races - Asian alone (% change since 2000)
Races - Hispanic (%)
Races - Hispanic (% change since 2000)
Races - Native Hawaiian and Other Pacific Islander alone (%)
Races - Native Hawaiian and Other Pacific Islander alone (% change since 2000)
Races - Two or more races(%)
Races - Two or more races(% change since 2000)
Races - Other race alone (%)
Races - Other race alone (% change since 2000)
Racial diversity
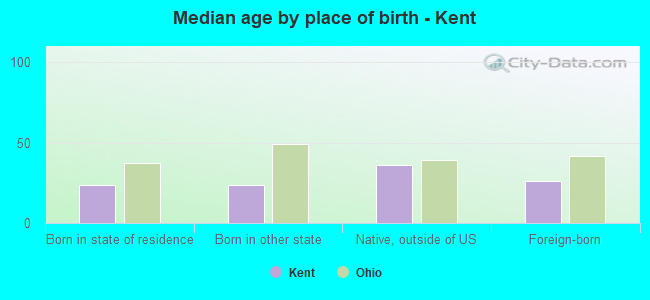
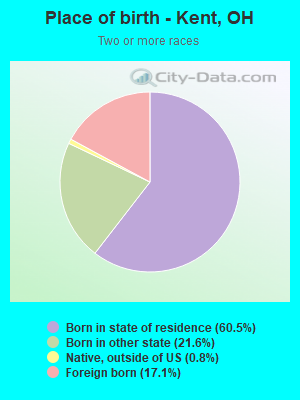
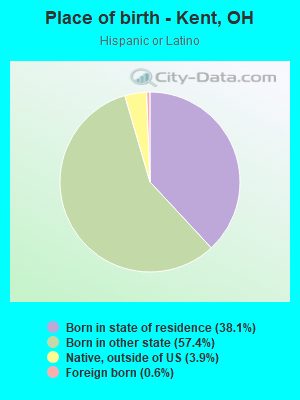
Place of birth - Born in state of residence (%)
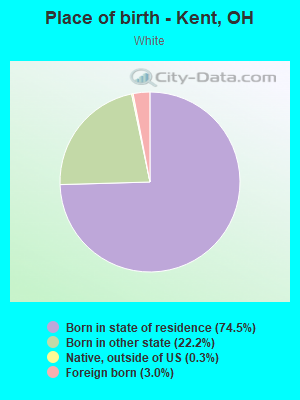
Place of birth - Born in state of residence (%) - White
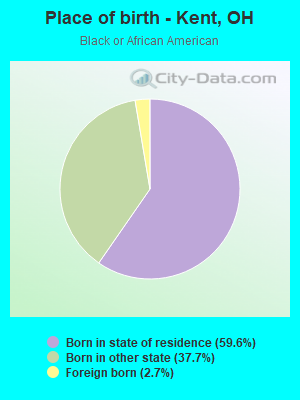
Place of birth - Born in state of residence (%) - Black or African American
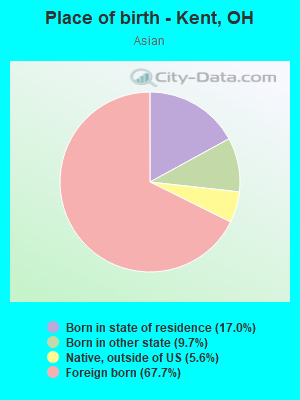
Place of birth - Born in state of residence (%) - Asian
Place of birth - Born in state of residence (%) - Hispanic or Latino
Place of birth - Born in state of residence (%) - American Indian and Alaska Native
Place of birth - Born in state of residence (%) - Multirace
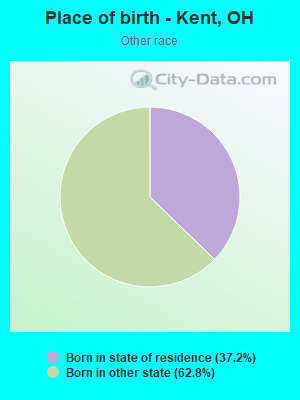
Place of birth - Born in state of residence (%) - Other Race
Place of birth - Born in other state (%)
Place of birth - Born in other state (%) - White
Place of birth - Born in other state (%) - Black or African American
Place of birth - Born in other state (%) - Asian
Place of birth - Born in other state (%) - Hispanic or Latino
Place of birth - Born in other state (%) - American Indian and Alaska Native
Place of birth - Born in other state (%) - Multirace
Place of birth - Born in other state (%) - Other Race
Place of birth - Native, outside of US (%)
Place of birth - Native, outside of US (%) - White
Place of birth - Native, outside of US (%) - Black or African American
Place of birth - Native, outside of US (%) - Asian
Place of birth - Native, outside of US (%) - Hispanic or Latino
Place of birth - Native, outside of US (%) - American Indian and Alaska Native
Place of birth - Native, outside of US (%) - Multirace
Place of birth - Native, outside of US (%) - Other Race
Place of birth - Foreign born (%)
Place of birth - Foreign born (%) - White
Place of birth - Foreign born (%) - Black or African American
Place of birth - Foreign born (%) - Asian
Place of birth - Foreign born (%) - Hispanic or Latino
Place of birth - Foreign born (%) - American Indian and Alaska Native
Place of birth - Foreign born (%) - Multirace
Place of birth - Foreign born (%) - Other Race
Residents speaking English at home (%)
Residents speaking English at home - Born in the United States (%)
Residents speaking English at home - Native, born elsewhere (%)
Residents speaking English at home - Foreign born (%)
Residents speaking Spanish at home (%)
Residents speaking Spanish at home - Born in the United States (%)
Residents speaking Spanish at home - Native, born elsewhere (%)
Residents speaking Spanish at home - Foreign born (%)
Residents speaking other language at home (%)
Residents speaking other language at home - Born in the United States (%)
Residents speaking other language at home - Native, born elsewhere (%)
Residents speaking other language at home - Foreign born (%)
Marital status - Never married (%)
Marital status - Now married (%)
Marital status - Separated (%)
Marital status - Widowed (%)
Marital status - Divorced (%)
Ancestries Reported - Arab (%)
Ancestries Reported - Czech (%)
Ancestries Reported - Danish (%)
Ancestries Reported - Dutch (%)
Ancestries Reported - English (%)
Ancestries Reported - French (%)
Ancestries Reported - French Canadian (%)
Ancestries Reported - German (%)
Ancestries Reported - Greek (%)
Ancestries Reported - Hungarian (%)
Ancestries Reported - Irish (%)
Ancestries Reported - Italian (%)
Ancestries Reported - Lithuanian (%)
Ancestries Reported - Norwegian (%)
Ancestries Reported - Polish (%)
Ancestries Reported - Portuguese (%)
Ancestries Reported - Russian (%)
Ancestries Reported - Scotch-Irish (%)
Ancestries Reported - Scottish (%)
Ancestries Reported - Slovak (%)
Ancestries Reported - Subsaharan African (%)
Ancestries Reported - Swedish (%)
Ancestries Reported - Swiss (%)
Ancestries Reported - Ukrainian (%)
Ancestries Reported - United States (%)
Ancestries Reported - Welsh (%)
Ancestries Reported - West Indian (%)
Ancestries Reported - Other (%)
Geographical mobility - Same house 1 year ago (%)
Geographical mobility - Same house 1 year ago (%) - White
Geographical mobility - Same house 1 year ago (%) - Black or African American
Geographical mobility - Same house 1 year ago (%) - Asian
Geographical mobility - Same house 1 year ago (%) - Hispanic or Latino
Geographical mobility - Same house 1 year ago (%) - American Indian and Alaska Native
Geographical mobility - Same house 1 year ago (%) - Multirace
Geographical mobility - Same house 1 year ago (%) - Other Race
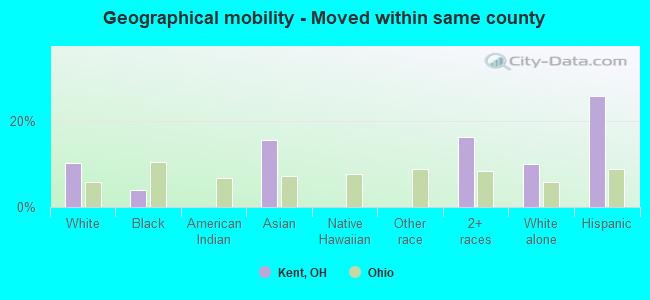
Geographical mobility - Moved within same county (%)
Geographical mobility - Moved within same county (%) - White
Geographical mobility - Moved within same county (%) - Black or African American
Geographical mobility - Moved within same county (%) - Asian
Geographical mobility - Moved within same county (%) - Hispanic or Latino
Geographical mobility - Moved within same county (%) - American Indian and Alaska Native
Geographical mobility - Moved within same county (%) - Multirace
Geographical mobility - Moved within same county (%) - Other Race
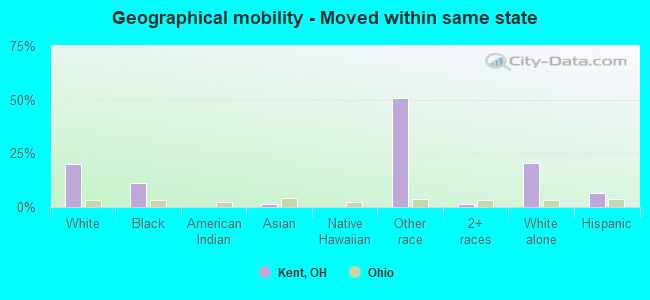
Geographical mobility - Moved from different county within same state (%)
Geographical mobility - Moved from different county within same state (%) - White
Geographical mobility - Moved from different county within same state (%) - Black or African American
Geographical mobility - Moved from different county within same state (%) - Asian
Geographical mobility - Moved from different county within same state (%) - Hispanic or Latino
Geographical mobility - Moved from different county within same state (%) - American Indian and Alaska Native
Geographical mobility - Moved from different county within same state (%) - Multirace
Geographical mobility - Moved from different county within same state (%) - Other Race
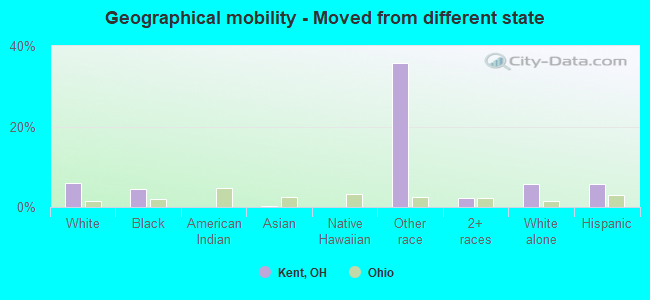
Geographical mobility - Moved from different state (%)
Geographical mobility - Moved from different state (%) - White
Geographical mobility - Moved from different state (%) - Black or African American
Geographical mobility - Moved from different state (%) - Asian
Geographical mobility - Moved from different state (%) - Hispanic or Latino
Geographical mobility - Moved from different state (%) - American Indian and Alaska Native
Geographical mobility - Moved from different state (%) - Multirace
Geographical mobility - Moved from different state (%) - Other Race
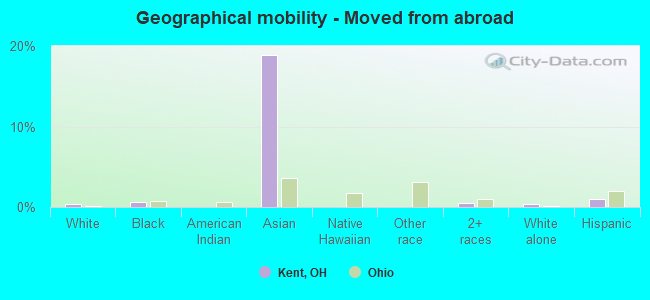
Geographical mobility - Moved from abroad (%)
Geographical mobility - Moved from abroad (%) - White
Geographical mobility - Moved from abroad (%) - Black or African American
Geographical mobility - Moved from abroad (%) - Asian
Geographical mobility - Moved from abroad (%) - Hispanic or Latino
Geographical mobility - Moved from abroad (%) - American Indian and Alaska Native
Geographical mobility - Moved from abroad (%) - Multirace
Geographical mobility - Moved from abroad (%) - Other Race
Place of birth for the foreign-born population - Ireland (%)
Place of birth for the foreign-born population - Denmark (%)
Place of birth for the foreign-born population - Norway (%)
Place of birth for the foreign-born population - Sweden (%)
Place of birth for the foreign-born population - United Kingdom (%)
Place of birth for the foreign-born population - England (%)
Place of birth for the foreign-born population - Scotland (%)
Place of birth for the foreign-born population - Other Northern Europe (%)
Place of birth for the foreign-born population - Austria (%)
Place of birth for the foreign-born population - Belgium (%)
Place of birth for the foreign-born population - France (%)
Place of birth for the foreign-born population - Germany (%)
Place of birth for the foreign-born population - Netherlands (%)
Place of birth for the foreign-born population - Switzerland (%)
Place of birth for the foreign-born population - Other Western Europe (%)
Place of birth for the foreign-born population - Greece (%)
Place of birth for the foreign-born population - Italy (%)
Place of birth for the foreign-born population - Portugal (%)
Place of birth for the foreign-born population - Spain (%)
Place of birth for the foreign-born population - Other Southern Europe (%)
Place of birth for the foreign-born population - Albania (%)
Place of birth for the foreign-born population - Belarus (%)
Place of birth for the foreign-born population - Bosnia and Herzegovina (%)
Place of birth for the foreign-born population - Bulgaria (%)
Place of birth for the foreign-born population - Croatia (%)
Place of birth for the foreign-born population - Czechoslovakia (%)
Place of birth for the foreign-born population - Hungary (%)
Place of birth for the foreign-born population - Latvia (%)
Place of birth for the foreign-born population - Lithuania (%)
Place of birth for the foreign-born population - North Macedonia (Macedonia) (%)
Place of birth for the foreign-born population - Moldova (%)
Place of birth for the foreign-born population - Poland (%)
Place of birth for the foreign-born population - Romania (%)
Place of birth for the foreign-born population - Russia (%)
Place of birth for the foreign-born population - Serbia (%)
Place of birth for the foreign-born population - Ukraine (%)
Place of birth for the foreign-born population - Other Eastern Europe (%)
Place of birth for the foreign-born population - China (%)
Place of birth for the foreign-born population - Hong Kong (%)
Place of birth for the foreign-born population - Taiwan (%)
Place of birth for the foreign-born population - Japan (%)
Place of birth for the foreign-born population - Korea (%)
Place of birth for the foreign-born population - Other Eastern Asia (%)
Place of birth for the foreign-born population - Afghanistan (%)
Place of birth for the foreign-born population - Bangladesh (%)
Place of birth for the foreign-born population - India (%)
Place of birth for the foreign-born population - Iran (%)
Place of birth for the foreign-born population - Kazakhstan (%)
Place of birth for the foreign-born population - Nepal (%)
Place of birth for the foreign-born population - Pakistan (%)
Place of birth for the foreign-born population - Sri Lanka (%)
Place of birth for the foreign-born population - Uzbekistan (%)
Place of birth for the foreign-born population - Other South Central Asia (%)
Place of birth for the foreign-born population - Burma (%)
Place of birth for the foreign-born population - Cambodia (%)
Place of birth for the foreign-born population - Indonesia (%)
Place of birth for the foreign-born population - Laos (%)
Place of birth for the foreign-born population - Malaysia (%)
Place of birth for the foreign-born population - Philippines (%)
Place of birth for the foreign-born population - Singapore (%)
Place of birth for the foreign-born population - Thailand (%)
Place of birth for the foreign-born population - Vietnam (%)
Place of birth for the foreign-born population - Other South Eastern Asia (%)
Place of birth for the foreign-born population - Armenia (%)
Place of birth for the foreign-born population - Iraq (%)
Place of birth for the foreign-born population - Israel (%)
Place of birth for the foreign-born population - Jordan (%)
Place of birth for the foreign-born population - Kuwait (%)
Place of birth for the foreign-born population - Lebanon (%)
Place of birth for the foreign-born population - Saudi Arabia (%)
Place of birth for the foreign-born population - Syria (%)
Place of birth for the foreign-born population - Turkey (%)
Place of birth for the foreign-born population - Yemen (%)
Place of birth for the foreign-born population - Other Western Asia (%)
Place of birth for the foreign-born population - Eritrea (%)
Place of birth for the foreign-born population - Ethiopia (%)
Place of birth for the foreign-born population - Kenya (%)
Place of birth for the foreign-born population - Somalia (%)
Place of birth for the foreign-born population - Uganda (%)
Place of birth for the foreign-born population - Zimbabwe (%)
Place of birth for the foreign-born population - Other Eastern Africa (%)
Place of birth for the foreign-born population - Cameroon (%)
Place of birth for the foreign-born population - Congo (%)
Place of birth for the foreign-born population - Democratic Republic of Congo (Zaire) (%)
Place of birth for the foreign-born population - Other Middle Africa (%)
Place of birth for the foreign-born population - Egypt (%)
Place of birth for the foreign-born population - Morocco (%)
Place of birth for the foreign-born population - Sudan (%)
Place of birth for the foreign-born population - Other Northern Africa (%)
Place of birth for the foreign-born population - South Africa (%)
Place of birth for the foreign-born population - Other Southern Africa (%)
Place of birth for the foreign-born population - Cabo Verde (%)
Place of birth for the foreign-born population - Ghana (%)
Place of birth for the foreign-born population - Liberia (%)
Place of birth for the foreign-born population - Nigeria (%)
Place of birth for the foreign-born population - Senegal (%)
Place of birth for the foreign-born population - Sierra Leone (%)
Place of birth for the foreign-born population - Other Western Africa (%)
Place of birth for the foreign-born population - Australia (%)
Place of birth for the foreign-born population - New Zealand (%)
Place of birth for the foreign-born population - Fiji (%)
Place of birth for the foreign-born population - Micronesia (%)
Place of birth for the foreign-born population - Bahamas (%)
Place of birth for the foreign-born population - Barbados (%)
Place of birth for the foreign-born population - Cuba (%)
Place of birth for the foreign-born population - Dominica (%)
Place of birth for the foreign-born population - Dominican Republic (%)
Place of birth for the foreign-born population - Grenada (%)
Place of birth for the foreign-born population - Haiti (%)
Place of birth for the foreign-born population - Jamaica (%)
Place of birth for the foreign-born population - St. Vincent and the Grenadines (%)
Place of birth for the foreign-born population - Trinidad and Tobago (%)
Place of birth for the foreign-born population - West Indies (%)
Place of birth for the foreign-born population - Other Caribbean (%)
Place of birth for the foreign-born population - Belize (%)
Place of birth for the foreign-born population - Costa Rica (%)
Place of birth for the foreign-born population - El Salvador (%)
Place of birth for the foreign-born population - Guatemala (%)
Place of birth for the foreign-born population - Honduras (%)
Place of birth for the foreign-born population - Mexico (%)
Place of birth for the foreign-born population - Nicaragua (%)
Place of birth for the foreign-born population - Panama (%)
Place of birth for the foreign-born population - Other Central America (%)
Place of birth for the foreign-born population - Argentina (%)
Place of birth for the foreign-born population - Bolivia (%)
Place of birth for the foreign-born population - Brazil (%)
Place of birth for the foreign-born population - Chile (%)
Place of birth for the foreign-born population - Colombia (%)
Place of birth for the foreign-born population - Ecuador (%)
Place of birth for the foreign-born population - Guyana (%)
Place of birth for the foreign-born population - Peru (%)
Place of birth for the foreign-born population - Uruguay (%)
Place of birth for the foreign-born population - Venezuela (%)
Place of birth for the foreign-born population - Other South America (%)
Place of birth for the foreign-born population - Canada (%)
Place of birth for the foreign-born population - Other Northern America (%)
Place of birth for the foreign-born population - Other (%)
Latest news about races in Kent, OH collected exclusively by city-data.com from local newspapers, TV, and radio stations
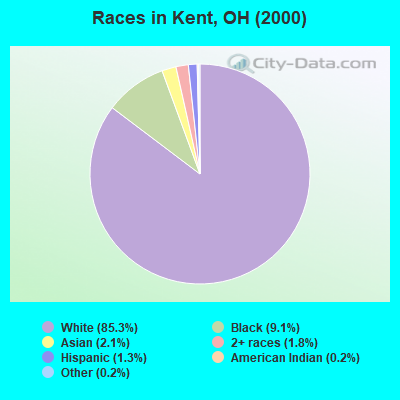
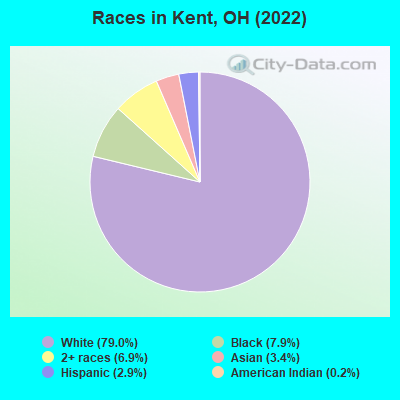
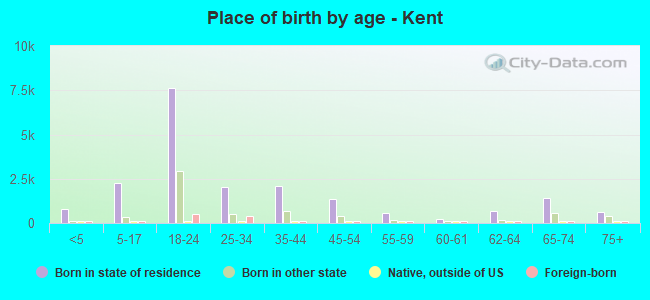
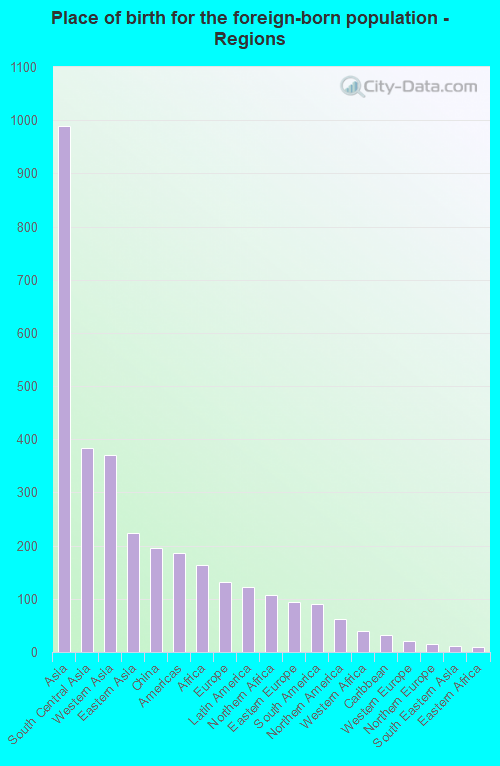
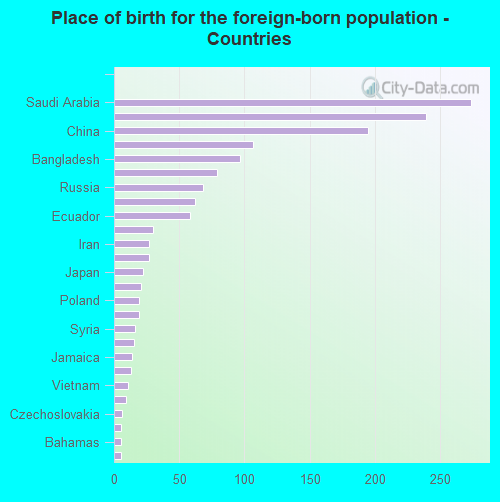
According to 2022 data, the most numerous races in Kent, OH are White alone (21,571 residents), Black alone (2,158 residents), and Two or more races (1,892 residents). 93.3% of Kent residents speak English at home. 5.4% of Kent, OH residents are foreign-born (3.5% born in Asia, 0.6% born in Africa), which is 25.4% greater than the foreign-born rate of 4.0% across the entire state of Ohio.
Race distribution in Kent
2000 2022
9,538,111 84.0% White alone 1,290,662 11.4% Black alone 217,123 1.9% Hispanic 137,770 1.2% Two or more races 131,670 1.2% Asian alone 21,985 0.2% American Indian alone 13,483 0.1% Other race alone 2,336 0.02% Native Hawaiian and Other
8,948,793 76.1% White alone 1,401,403 11.9% Black alone 529,291 4.5% Two or more races 517,232 4.4% Hispanic 293,387 2.5% Asian alone 52,805 0.4% Other race alone 9,785 0.08% American Indian alone 3,362 0.03% Native Hawaiian and Other
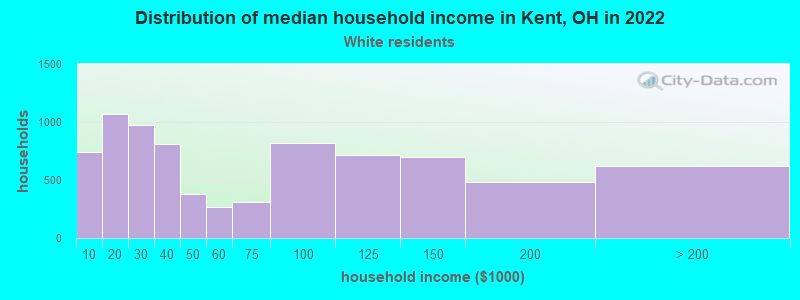
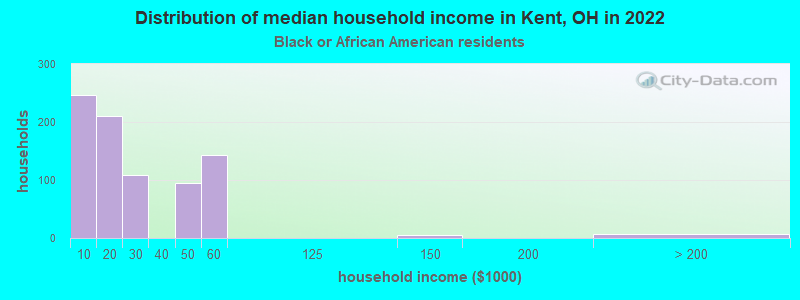
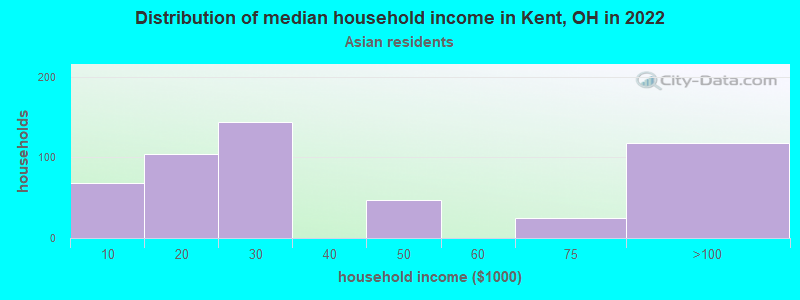
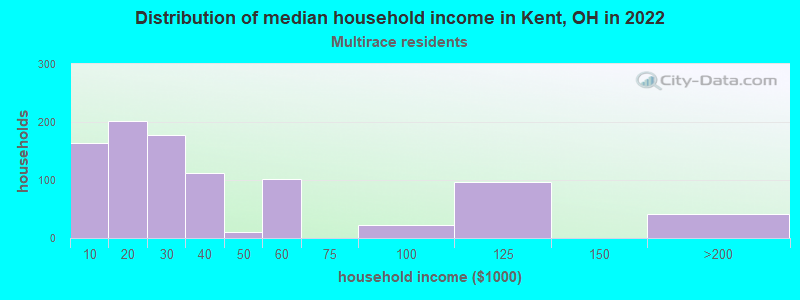
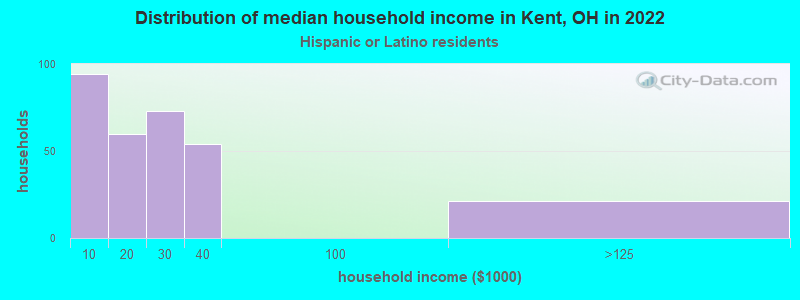
Income and house value in Kent Median household income in 2022 $46,937 White non-Hispanic householders$14,967 Black householders$23,171 Asian householders$28,444 Two or more races householders$20,514 Hispanic or Latino race householdersMedian 2022 house value $219,424 White Non-Hispanic householders$192,068 Black or African American householders$216,727 American Indian or Alaska Native householders $220,194 Asian householders$173,381 Some other race householders$327,499 Two or more races householders$144,484 Hispanic or Latino householders
Median age by race in Kent
24.3 Median age for White residents24.9 23.8 24.0 Median age for Black or African American residents29.4 23.6 -676,818,950.3 Median age for American Indian / Alaska Native residents-685,185,184.5 -666,666,666.0 34.8 Median age for Asian residents28.3 33.4 -800,387,596.1 Median age for Native Hawaiian / Pacific Islander residents-666,666,666.0 -805,394,989.6 37.9 Median age for Other race residents32.6 -947,481,242.4 24.0 Median age for Two or more races residents30.8 22.0 24.5 Median age for White alone residents25.2 24.0 30.3 Median age for Hispanic or Latino residents33.1 18.4
Owner/renter occupied households by race in Kent
House owners and renters - White residents 3,860 47.6% Owner occupied4,255 52.4% Renter occupiedHouse owners and renters - Black or African American residents 256 27.2% Owner occupied686 72.8% Renter occupiedHouse owners and renters - American Indian / Alaska Native residents 50 100.0% Owner occupiedHouse owners and renters - Asian residents 104 20.3% Owner occupied408 79.7% Renter occupiedHouse owners and renters - Two or more races residents 212 38.7% Owner occupied336 61.3% Renter occupiedHouse owners and renters - White alone residents 3,842 48.2% Owner occupied4,125 51.8% Renter occupiedHouse owners and renters - Hispanic or Latino residents 134 43.2% Owner occupied176 56.8% Renter occupied
Language usage in Kent
English speakers - Total 93.3% of residents of Kent speak English at home.
0.9% of residents speak Spanish at home 178 73.9% Speak English very well63 26.1% Speak English less than very well5.7% of residents speak other language at home 1,078 71.3% Speak English very well434 28.7% Speak English less than very well
English speakers - Born in the United States 97.9% of residents of Kent speak English at home.
0.6% of residents speak Spanish at home 38 100.0% Speak English very well1.3% of residents speak other language at home 64 83.1% Speak English very well13 16.9% Speak English less than very well
English speakers - Native, born elsewhere 78.0% of residents of Kent speak English at home.
13.1% of residents speak Spanish at home 34 100.0% Speak English very well8.5% of residents speak other language at home 22 100.0% Speak English very well
English speakers - Foreign-born 9.4% of residents of Kent speak English at home.
4.7% of residents speak Spanish at home 5 7.5% Speak English very well62 92.5% Speak English less than very well86.2% of residents speak other language at home 860 69.4% Speak English very well379 30.6% Speak English less than very well
White (Caucasian) - Speak only English Native:
99.1% (20,615)Foreign-born:
16.0% (103)
White (Caucasian) - Speak another language Native:
0.8% (176)Foreign-born:
94.1% (602)
Black or African American - Speak only English Native:
99.1% (2,118)Foreign-born:
45.8% (29)
Black or African American - Speak another language Native:
0.7% (16)Foreign-born:
56.1% (35)
Asian - Speak another language Native:
11.9% (37)Foreign-born:
100.0% (610)
Two or more races - Speak only English Native:
96.4% (1,774)Foreign-born:
1.3% (5)
Two or more races - Speak another language Native:
2.8% (52)Foreign-born:
100.0% (375)
White alone - Speak only English Native:
99.2% (20,310)Foreign-born:
15.5% (103)
White alone - Speak another language Native:
0.8% (167)Foreign-born:
96.7% (640)
Hispanic or Latino - Speak another language Native:
10.9% (87)Foreign-born:
100.0% (5)
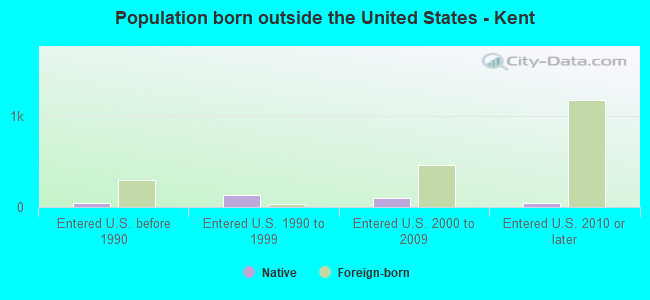
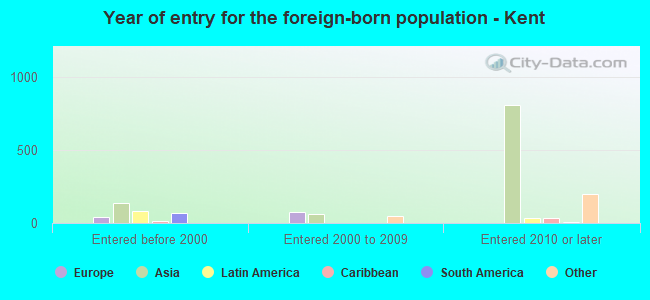
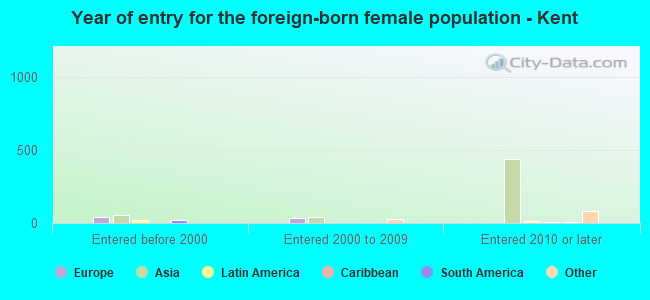
Foreign-born residents in Kent 1,470 residents are foreign born (3.5% Asia , 0.6% Africa ).
Marital status for residents in Kent Marital status - White (Caucasian) population 15 years and over
Males 61.3% Never married28.8% Now married0.6% Separated0.9% Widowed8.5% DivorcedFemales 57.5% Never married26.7% Now married0.7% Separated8.3% Widowed6.9% DivorcedWomen who gave birth in the past 12 months Now married:
0.0% (0)Unmarried:
100.0% (78)
Women who did not give birth in the past 12 months Now married:
17.9% (1,358)Unmarried:
82.1% (6,216)
Marital status - Black or African American population 15 years and over
Males 74.7% Never married22.8% Now married2.5% Separated0.0% Widowed0.0% DivorcedFemales 76.1% Never married13.5% Now married0.0% Separated2.2% Widowed8.3% DivorcedWomen who did not give birth in the past 12 months Now married:
12.6% (114)Unmarried:
87.4% (791)
Marital status - Asian population 15 years and over
Males 44.0% Never married49.9% Now married6.2% Separated0.0% Widowed0.0% DivorcedFemales 81.9% Never married18.1% Now married0.0% Separated0.0% Widowed0.0% DivorcedWomen who gave birth in the past 12 months Now married:
100.0% (20)Unmarried:
0.0% (0)
Women who did not give birth in the past 12 months Now married:
14.7% (70)Unmarried:
85.3% (406)
Marital status - Other race population 15 years and over
Males 100.0% Never married0.0% Now married0.0% Separated0.0% Widowed0.0% DivorcedFemales 100.0% Never married0.0% Now married0.0% Separated0.0% Widowed0.0% DivorcedWomen who did not give birth in the past 12 months Now married:
0.0% (0)Unmarried:
100.0% (16)
Marital status - Two or more races population 15 years and over
Males 73.1% Never married17.8% Now married4.6% Separated3.1% Widowed1.5% DivorcedFemales 51.3% Never married26.2% Now married0.0% Separated7.6% Widowed14.9% DivorcedWomen who gave birth in the past 12 months Now married:
100.0% (12)Unmarried:
0.0% (0)
Women who did not give birth in the past 12 months Now married:
29.5% (160)Unmarried:
70.5% (383)
Marital status - White alone, not Hispanic / Latino population 15 years and over
Males 61.2% Never married28.9% Now married0.6% Separated0.9% Widowed8.4% DivorcedFemales 56.8% Never married27.1% Now married0.7% Separated8.4% Widowed7.0% DivorcedWomen who gave birth in the past 12 months Now married:
0.0% (0)Unmarried:
100.0% (78)
Women who did not give birth in the past 12 months Now married:
18.3% (1,354)Unmarried:
81.7% (6,044)
Marital status - Hispanic or Latino population 15 years and over
Males 77.8% Never married13.2% Now married0.0% Separated0.0% Widowed9.0% DivorcedFemales 68.0% Never married0.0% Now married0.0% Separated12.4% Widowed19.6% DivorcedWomen who did not give birth in the past 12 months Now married:
0.0% (0)Unmarried:
100.0% (218)
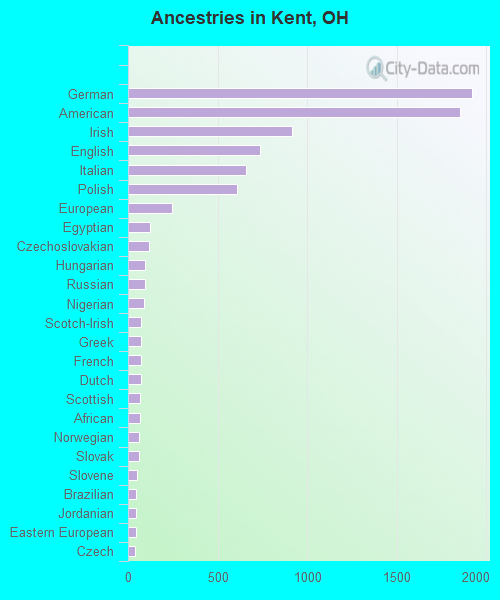
Ancestries in Kent
1,920 16.3% German1,856 15.8% American915 7.8% Irish739 6.3% English660 5.6% Italian609 5.2% Polish244 2.1% European122 1.0% Egyptian116 1.0% Czechoslovakian96 0.8% Hungarian96 0.8% Russian92 0.8% Nigerian75 0.6% Scotch-Irish74 0.6% Greek73 0.6% French70 0.6% Dutch67 0.6% Scottish65 0.6% African63 0.5% Norwegian63 0.5% Slovak52 0.4% Slovene46 0.4% Brazilian45 0.4% Jordanian42 0.4% Eastern European41 0.3% Czech40 0.3% Arab38 0.3% Ukrainian37 0.3% British34 0.3% French Canadian31 0.3% Iranian19 0.2% Welsh17 0.1% Austrian17 0.1% Serbian13 0.1% Bulgarian13 0.1% Swiss10 0.09% Danish10 0.09% Ghanaian10 0.09% Lithuanian7 0.06% Jamaican3 0.03% Swedish
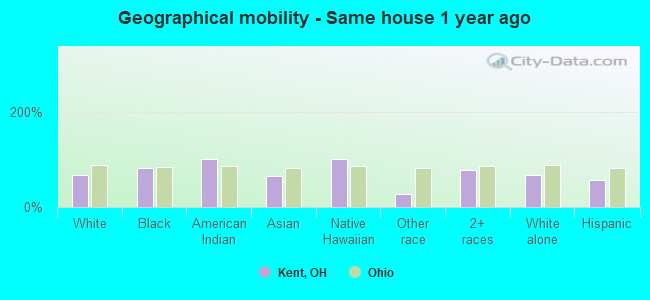
Geographical mobility in Kent Same house 1 year ago 14,815 67.4% White (Caucasian)1,927 82.3% Black or African American59 100.0% American Indian / Alaska Native594 64.4% Asian5 100.0% Native Hawaiian / Pacific Islander9 26.6% Other race1,774 78.0% Two or more races14,665 67.8% White alone, not Hispanic / Latino459 57.1% Hispanic or LatinoMoved within same county 2,260 10.3% White / Caucasian90 3.9% Black or African American144 15.6% Asian372 16.4% Two or more races2,143 9.9% White alone, not Hispanic / Latino208 25.9% Hispanic or LatinoMoved within same state 4,378 19.9% White / Caucasian258 11.0% Black or African American15 1.6% Asian16 50.7% Other race28 1.2% Two or more races4,383 20.3% White alone, not Hispanic / Latino54 6.7% Hispanic or LatinoMoved from different state 1,318 6.0% White / Caucasian103 4.4% Black or African American2 0.2% Asian12 35.7% Other race51 2.3% Two or more races1,232 5.7% White alone, not Hispanic / Latino45 5.6% Hispanic or LatinoMoved from abroad 73 0.3% White15 0.6% Black or African American174 18.8% Asian10 0.4% Two or more races73 0.3% White alone, not Hispanic / Latino8 1.0% Hispanic or Latino
Children Nativity (place of birth) in Kent
Children under 6 years - Living with two parents Both parents native 496 100.0% NativeBoth parents foreign-born 25 100.0% Foreign-bornChildren under 6 years - Living with one parent Native parent 566 100.0% NativeChildren 6 to 17 years - Living with two parents Both parents native 1,738 100.0% NativeBoth parents foreign-born 11 100.0% Foreign-bornChildren 6 to 17 years - Living with one parent Native parent 517 100.0% NativeForeign-born parent 90 65.6% Native47 34.4% Foreign-born
Grandparents responsible for own grandchildren in Kent
Grandparents (30 to 59 years) White / Caucasian 28 50.7% Responsible for grandchildren27 49.3% Not responsible for grandchildrenWhite alone, not Hispanic / Latino 28 50.1% Responsible for grandchildren28 49.9% Not responsible for grandchildrenGrandparents (60 years and over) White / Caucasian 73 38.7% Responsible for grandchildren116 61.3% Not responsible for grandchildrenWhite alone, not Hispanic / Latino 73 38.5% Responsible for grandchildren117 61.5% Not responsible for grandchildren