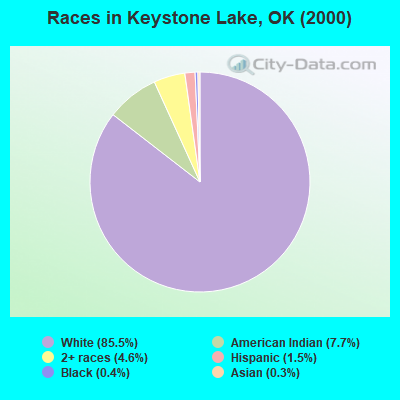
Races in Keystone Lake, Oklahoma (OK) Detailed Stats
Ancestries, Foreign-born residents, place of birth
Race distribution in Keystone Lake

- 9,45885.5%White alone
- 8517.7%American Indian alone
- 5044.6%Two or more races
- 1681.5%Hispanic
- 470.4%Black alone
- 350.3%Asian alone
- 50.05%Native Hawaiian and Other
Pacific Islander alone
2000
2022
-
- 2,556,36874.1%White alone
- 266,1587.7%American Indian alone
- 257,9817.5%Black alone
- 179,3045.2%Hispanic
- 140,2494.1%Two or more races
- 46,1721.3%Asian alone
- 2,3220.07%Other race alone
- 2,1000.06%Native Hawaiian and Other
Pacific Islander alone

-
- 2,517,40362.6%White alone
- 486,69212.1%Hispanic
- 364,4539.1%Two or more races
- 273,6506.8%American Indian alone
- 268,5436.7%Black alone
- 92,6722.3%Asian alone
- 10,7860.3%Other race alone
- 5,6010.1%Native Hawaiian and Other
Pacific Islander alone

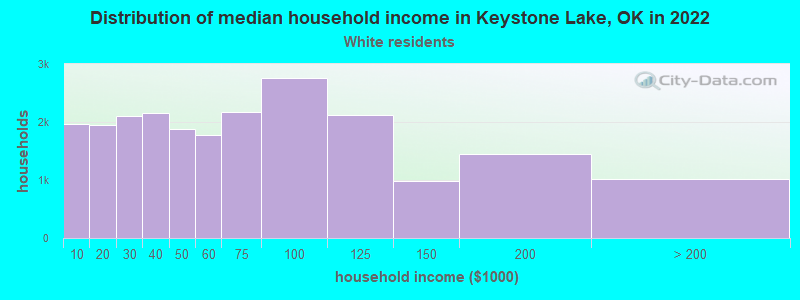
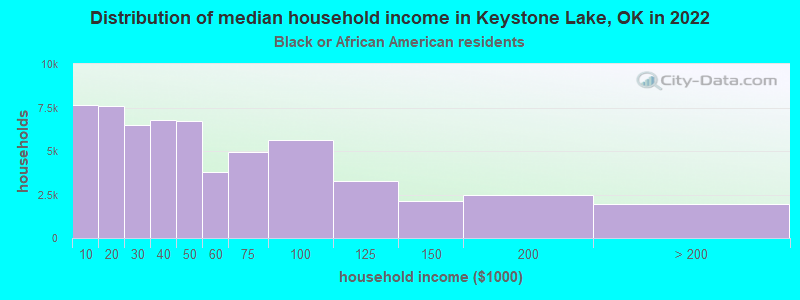
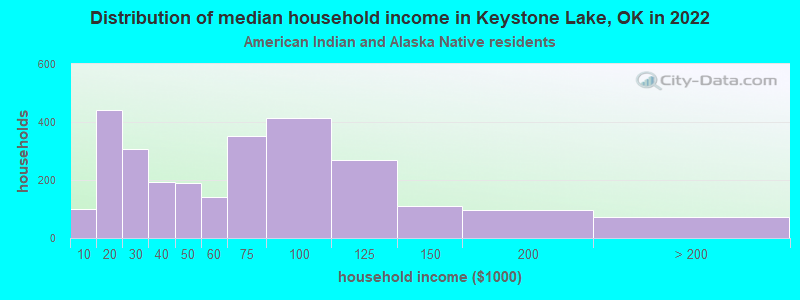
Income and house value in Keystone Lake
- Median household income in 2022
- $53,042White non-Hispanic householders
- $59,110Black householders
- $62,741American Indian and Alaska Native householders
- $114,806Some other race householders
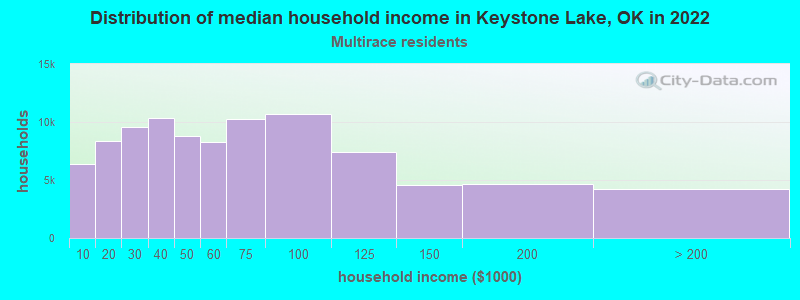
- $64,405Two or more races householders
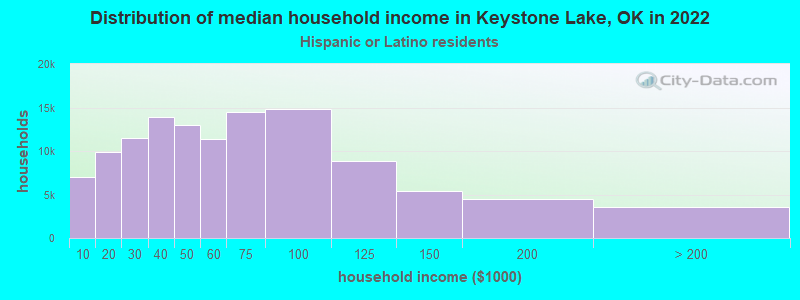
- $124,362Hispanic or Latino race householders
- Median 2022 house value
- $189,098White Non-Hispanic householders
- $46,740Black or African American householders
- $177,079American Indian or Alaska Native householders
- $33,386Some other race householders
- $275,368Two or more races householders
- $709,387Hispanic or Latino householders
Household income for White non-Hispanic householders
Household income for Black householders
Household income for American Indian and Alaska Native householders
Household income for Two or more races householders
Household income for Hispanic or Latino race householders
Zip code: 74044