Races in Killingly, Connecticut (CT) Detailed Stats
Ancestries, Foreign-born residents, place of birth
3.0% of Killingly, CT residents are foreign-born (1.5% born in Europe, 0.8% born in Asia, 0.4% born in North America, 0.3% born in Latin America), which is 401.2% less than the foreign-born rate of 15.0% across the entire state of Connecticut.
Race distribution in Killingly

- 15,25392.6%White alone
- 3702.2%Hispanic
- 2851.7%Two or more races
- 2621.6%Asian alone
- 2111.3%Black alone
- 800.5%American Indian alone
- 110.07%Other race alone

2000
2022
-
- 2,638,84577.5%White alone
- 320,3239.4%Hispanic
- 295,5718.7%Black alone
- 81,5642.4%Asian alone
- 52,8961.6%Two or more races
- 8,1410.2%Other race alone
- 7,2670.2%American Indian alone
- 9580.03%Native Hawaiian and Other
Pacific Islander alone

-
- 2,246,91362.0%White alone
- 658,97818.2%Hispanic
- 353,9739.8%Black alone
- 172,9294.8%Asian alone
- 159,6314.4%Two or more races
- 29,7610.8%Other race alone
- 3,4280.09%American Indian alone
- 5920.02%Native Hawaiian and Other
Pacific Islander alone

Income and house value in Killingly
- Median household income in 2022
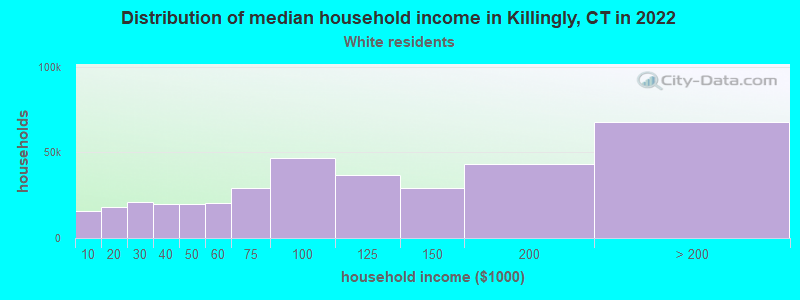
- $70,816White non-Hispanic householders
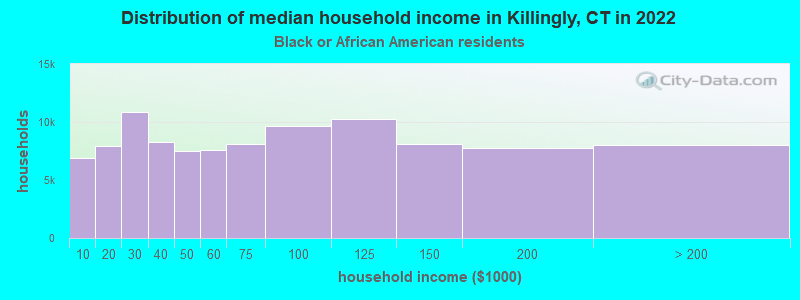
- $41,914Black householders
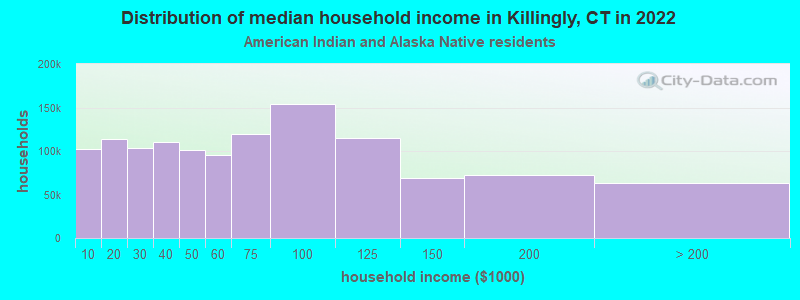
- $40,561American Indian and Alaska Native householders
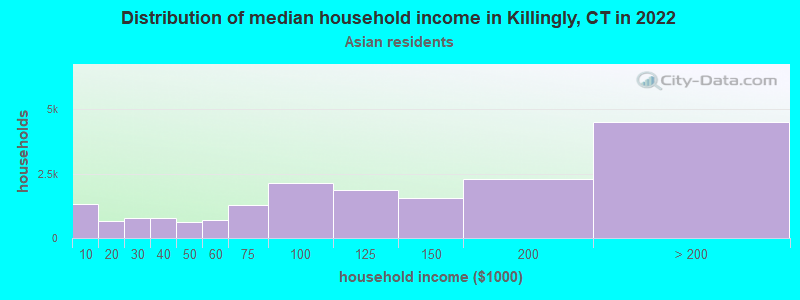
- $37,871Asian householders
- $39,987Some other race householders
- $74,016Two or more races householders
- $35,193Hispanic or Latino race householders
- Median 2022 house value
- $235,646White Non-Hispanic householders
- $251,211American Indian or Alaska Native householders
- $297,260Asian householders
- $297,260Some other race householders
- $189,598Two or more races householders
- $270,236Hispanic or Latino householders
Household income for White non-Hispanic householders
Household income for Black householders
Household income for American Indian and Alaska Native householders
Household income for Asian householders
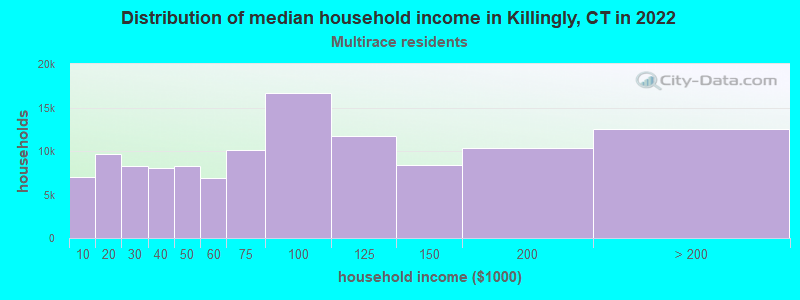
Household income for Two or more races householders
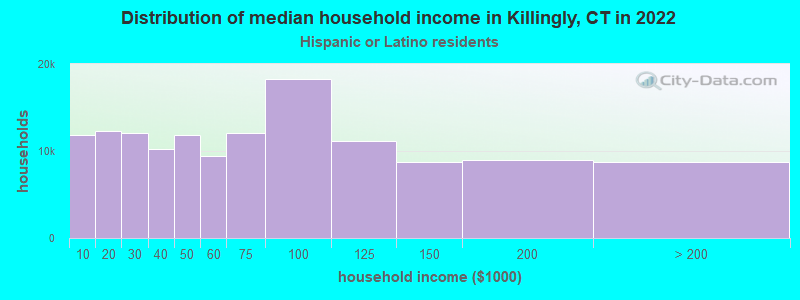
Household income for Hispanic or Latino race householders
Foreign-born residents in Killingly
493 residents are foreign born (1.5% Europe, 0.8% Asia, 0.4% North America, 0.3% Latin America).
| This city: | 3.0% |
| Connecticut: | 10.9% |
Ancestries in Killingly

- 4,27321.7%French
- 2,43012.3%Irish
- 2,42812.3%French Canadian
- 2,18511.1%Other
- 1,9099.7%English
- 1,3727.0%Polish
- 1,2946.6%Italian
- 1,2626.4%German
- 5202.6%United States
- 3161.6%Scottish
- 2981.5%Portuguese
- 2611.3%Swedish
- 1981.0%Scotch-Irish
- 1941.0%Dutch
- 1340.7%Welsh
- 1270.6%Russian
- 970.5%Ukrainian
- 720.4%Greek
- 640.3%Danish
- 620.3%Norwegian
- 520.3%Lithuanian
- 510.3%Czech
- 280.1%Hungarian
- 260.1%Slovak
- 240.1%Arab
- 200.1%Swiss
- 190.10%Subsaharan African
- 150.08%West Indian

Zip codes: 06239.