Races in La Quinta, California (CA) Detailed Stats
Data:
Races - White alone (%)
Races - White alone (% change since 2000)
Races - Black alone (%)
Races - Black alone (% change since 2000)
Races - American Indian alone (%)
Races - American Indian alone (% change since 2000)
Races - Asian alone (%)
Races - Asian alone (% change since 2000)
Races - Hispanic (%)
Races - Hispanic (% change since 2000)
Races - Native Hawaiian and Other Pacific Islander alone (%)
Races - Native Hawaiian and Other Pacific Islander alone (% change since 2000)
Races - Two or more races(%)
Races - Two or more races(% change since 2000)
Races - Other race alone (%)
Races - Other race alone (% change since 2000)
Racial diversity
Place of birth - Born in state of residence (%)
Place of birth - Born in state of residence (%) - White
Place of birth - Born in state of residence (%) - Black or African American
Place of birth - Born in state of residence (%) - Asian
Place of birth - Born in state of residence (%) - Hispanic or Latino
Place of birth - Born in state of residence (%) - American Indian and Alaska Native
Place of birth - Born in state of residence (%) - Multirace
Place of birth - Born in state of residence (%) - Other Race
Place of birth - Born in other state (%)
Place of birth - Born in other state (%) - White
Place of birth - Born in other state (%) - Black or African American
Place of birth - Born in other state (%) - Asian
Place of birth - Born in other state (%) - Hispanic or Latino
Place of birth - Born in other state (%) - American Indian and Alaska Native
Place of birth - Born in other state (%) - Multirace
Place of birth - Born in other state (%) - Other Race
Place of birth - Native, outside of US (%)
Place of birth - Native, outside of US (%) - White
Place of birth - Native, outside of US (%) - Black or African American
Place of birth - Native, outside of US (%) - Asian
Place of birth - Native, outside of US (%) - Hispanic or Latino
Place of birth - Native, outside of US (%) - American Indian and Alaska Native
Place of birth - Native, outside of US (%) - Multirace
Place of birth - Native, outside of US (%) - Other Race
Place of birth - Foreign born (%)
Place of birth - Foreign born (%) - White
Place of birth - Foreign born (%) - Black or African American
Place of birth - Foreign born (%) - Asian
Place of birth - Foreign born (%) - Hispanic or Latino
Place of birth - Foreign born (%) - American Indian and Alaska Native
Place of birth - Foreign born (%) - Multirace
Place of birth - Foreign born (%) - Other Race
Residents speaking English at home (%)
Residents speaking English at home - Born in the United States (%)
Residents speaking English at home - Native, born elsewhere (%)
Residents speaking English at home - Foreign born (%)
Residents speaking Spanish at home (%)
Residents speaking Spanish at home - Born in the United States (%)
Residents speaking Spanish at home - Native, born elsewhere (%)
Residents speaking Spanish at home - Foreign born (%)
Residents speaking other language at home (%)
Residents speaking other language at home - Born in the United States (%)
Residents speaking other language at home - Native, born elsewhere (%)
Residents speaking other language at home - Foreign born (%)
Marital status - Never married (%)
Marital status - Now married (%)
Marital status - Separated (%)
Marital status - Widowed (%)
Marital status - Divorced (%)
Ancestries Reported - Arab (%)
Ancestries Reported - Czech (%)
Ancestries Reported - Danish (%)
Ancestries Reported - Dutch (%)
Ancestries Reported - English (%)
Ancestries Reported - French (%)
Ancestries Reported - French Canadian (%)
Ancestries Reported - German (%)
Ancestries Reported - Greek (%)
Ancestries Reported - Hungarian (%)
Ancestries Reported - Irish (%)
Ancestries Reported - Italian (%)
Ancestries Reported - Lithuanian (%)
Ancestries Reported - Norwegian (%)
Ancestries Reported - Polish (%)
Ancestries Reported - Portuguese (%)
Ancestries Reported - Russian (%)
Ancestries Reported - Scotch-Irish (%)
Ancestries Reported - Scottish (%)
Ancestries Reported - Slovak (%)
Ancestries Reported - Subsaharan African (%)
Ancestries Reported - Swedish (%)
Ancestries Reported - Swiss (%)
Ancestries Reported - Ukrainian (%)
Ancestries Reported - United States (%)
Ancestries Reported - Welsh (%)
Ancestries Reported - West Indian (%)
Ancestries Reported - Other (%)
Geographical mobility - Same house 1 year ago (%)
Geographical mobility - Same house 1 year ago (%) - White
Geographical mobility - Same house 1 year ago (%) - Black or African American
Geographical mobility - Same house 1 year ago (%) - Asian
Geographical mobility - Same house 1 year ago (%) - Hispanic or Latino
Geographical mobility - Same house 1 year ago (%) - American Indian and Alaska Native
Geographical mobility - Same house 1 year ago (%) - Multirace
Geographical mobility - Same house 1 year ago (%) - Other Race
Geographical mobility - Moved within same county (%)
Geographical mobility - Moved within same county (%) - White
Geographical mobility - Moved within same county (%) - Black or African American
Geographical mobility - Moved within same county (%) - Asian
Geographical mobility - Moved within same county (%) - Hispanic or Latino
Geographical mobility - Moved within same county (%) - American Indian and Alaska Native
Geographical mobility - Moved within same county (%) - Multirace
Geographical mobility - Moved within same county (%) - Other Race
Geographical mobility - Moved from different county within same state (%)
Geographical mobility - Moved from different county within same state (%) - White
Geographical mobility - Moved from different county within same state (%) - Black or African American
Geographical mobility - Moved from different county within same state (%) - Asian
Geographical mobility - Moved from different county within same state (%) - Hispanic or Latino
Geographical mobility - Moved from different county within same state (%) - American Indian and Alaska Native
Geographical mobility - Moved from different county within same state (%) - Multirace
Geographical mobility - Moved from different county within same state (%) - Other Race
Geographical mobility - Moved from different state (%)
Geographical mobility - Moved from different state (%) - White
Geographical mobility - Moved from different state (%) - Black or African American
Geographical mobility - Moved from different state (%) - Asian
Geographical mobility - Moved from different state (%) - Hispanic or Latino
Geographical mobility - Moved from different state (%) - American Indian and Alaska Native
Geographical mobility - Moved from different state (%) - Multirace
Geographical mobility - Moved from different state (%) - Other Race
Geographical mobility - Moved from abroad (%)
Geographical mobility - Moved from abroad (%) - White
Geographical mobility - Moved from abroad (%) - Black or African American
Geographical mobility - Moved from abroad (%) - Asian
Geographical mobility - Moved from abroad (%) - Hispanic or Latino
Geographical mobility - Moved from abroad (%) - American Indian and Alaska Native
Geographical mobility - Moved from abroad (%) - Multirace
Geographical mobility - Moved from abroad (%) - Other Race
Place of birth for the foreign-born population - Ireland (%)
Place of birth for the foreign-born population - Denmark (%)
Place of birth for the foreign-born population - Norway (%)
Place of birth for the foreign-born population - Sweden (%)
Place of birth for the foreign-born population - United Kingdom (%)
Place of birth for the foreign-born population - England (%)
Place of birth for the foreign-born population - Scotland (%)
Place of birth for the foreign-born population - Other Northern Europe (%)
Place of birth for the foreign-born population - Austria (%)
Place of birth for the foreign-born population - Belgium (%)
Place of birth for the foreign-born population - France (%)
Place of birth for the foreign-born population - Germany (%)
Place of birth for the foreign-born population - Netherlands (%)
Place of birth for the foreign-born population - Switzerland (%)
Place of birth for the foreign-born population - Other Western Europe (%)
Place of birth for the foreign-born population - Greece (%)
Place of birth for the foreign-born population - Italy (%)
Place of birth for the foreign-born population - Portugal (%)
Place of birth for the foreign-born population - Spain (%)
Place of birth for the foreign-born population - Other Southern Europe (%)
Place of birth for the foreign-born population - Albania (%)
Place of birth for the foreign-born population - Belarus (%)
Place of birth for the foreign-born population - Bosnia and Herzegovina (%)
Place of birth for the foreign-born population - Bulgaria (%)
Place of birth for the foreign-born population - Croatia (%)
Place of birth for the foreign-born population - Czechoslovakia (%)
Place of birth for the foreign-born population - Hungary (%)
Place of birth for the foreign-born population - Latvia (%)
Place of birth for the foreign-born population - Lithuania (%)
Place of birth for the foreign-born population - North Macedonia (Macedonia) (%)
Place of birth for the foreign-born population - Moldova (%)
Place of birth for the foreign-born population - Poland (%)
Place of birth for the foreign-born population - Romania (%)
Place of birth for the foreign-born population - Russia (%)
Place of birth for the foreign-born population - Serbia (%)
Place of birth for the foreign-born population - Ukraine (%)
Place of birth for the foreign-born population - Other Eastern Europe (%)
Place of birth for the foreign-born population - China (%)
Place of birth for the foreign-born population - Hong Kong (%)
Place of birth for the foreign-born population - Taiwan (%)
Place of birth for the foreign-born population - Japan (%)
Place of birth for the foreign-born population - Korea (%)
Place of birth for the foreign-born population - Other Eastern Asia (%)
Place of birth for the foreign-born population - Afghanistan (%)
Place of birth for the foreign-born population - Bangladesh (%)
Place of birth for the foreign-born population - India (%)
Place of birth for the foreign-born population - Iran (%)
Place of birth for the foreign-born population - Kazakhstan (%)
Place of birth for the foreign-born population - Nepal (%)
Place of birth for the foreign-born population - Pakistan (%)
Place of birth for the foreign-born population - Sri Lanka (%)
Place of birth for the foreign-born population - Uzbekistan (%)
Place of birth for the foreign-born population - Other South Central Asia (%)
Place of birth for the foreign-born population - Burma (%)
Place of birth for the foreign-born population - Cambodia (%)
Place of birth for the foreign-born population - Indonesia (%)
Place of birth for the foreign-born population - Laos (%)
Place of birth for the foreign-born population - Malaysia (%)
Place of birth for the foreign-born population - Philippines (%)
Place of birth for the foreign-born population - Singapore (%)
Place of birth for the foreign-born population - Thailand (%)
Place of birth for the foreign-born population - Vietnam (%)
Place of birth for the foreign-born population - Other South Eastern Asia (%)
Place of birth for the foreign-born population - Armenia (%)
Place of birth for the foreign-born population - Iraq (%)
Place of birth for the foreign-born population - Israel (%)
Place of birth for the foreign-born population - Jordan (%)
Place of birth for the foreign-born population - Kuwait (%)
Place of birth for the foreign-born population - Lebanon (%)
Place of birth for the foreign-born population - Saudi Arabia (%)
Place of birth for the foreign-born population - Syria (%)
Place of birth for the foreign-born population - Turkey (%)
Place of birth for the foreign-born population - Yemen (%)
Place of birth for the foreign-born population - Other Western Asia (%)
Place of birth for the foreign-born population - Eritrea (%)
Place of birth for the foreign-born population - Ethiopia (%)
Place of birth for the foreign-born population - Kenya (%)
Place of birth for the foreign-born population - Somalia (%)
Place of birth for the foreign-born population - Uganda (%)
Place of birth for the foreign-born population - Zimbabwe (%)
Place of birth for the foreign-born population - Other Eastern Africa (%)
Place of birth for the foreign-born population - Cameroon (%)
Place of birth for the foreign-born population - Congo (%)
Place of birth for the foreign-born population - Democratic Republic of Congo (Zaire) (%)
Place of birth for the foreign-born population - Other Middle Africa (%)
Place of birth for the foreign-born population - Egypt (%)
Place of birth for the foreign-born population - Morocco (%)
Place of birth for the foreign-born population - Sudan (%)
Place of birth for the foreign-born population - Other Northern Africa (%)
Place of birth for the foreign-born population - South Africa (%)
Place of birth for the foreign-born population - Other Southern Africa (%)
Place of birth for the foreign-born population - Cabo Verde (%)
Place of birth for the foreign-born population - Ghana (%)
Place of birth for the foreign-born population - Liberia (%)
Place of birth for the foreign-born population - Nigeria (%)
Place of birth for the foreign-born population - Senegal (%)
Place of birth for the foreign-born population - Sierra Leone (%)
Place of birth for the foreign-born population - Other Western Africa (%)
Place of birth for the foreign-born population - Australia (%)
Place of birth for the foreign-born population - New Zealand (%)
Place of birth for the foreign-born population - Fiji (%)
Place of birth for the foreign-born population - Micronesia (%)
Place of birth for the foreign-born population - Bahamas (%)
Place of birth for the foreign-born population - Barbados (%)
Place of birth for the foreign-born population - Cuba (%)
Place of birth for the foreign-born population - Dominica (%)
Place of birth for the foreign-born population - Dominican Republic (%)
Place of birth for the foreign-born population - Grenada (%)
Place of birth for the foreign-born population - Haiti (%)
Place of birth for the foreign-born population - Jamaica (%)
Place of birth for the foreign-born population - St. Vincent and the Grenadines (%)
Place of birth for the foreign-born population - Trinidad and Tobago (%)
Place of birth for the foreign-born population - West Indies (%)
Place of birth for the foreign-born population - Other Caribbean (%)
Place of birth for the foreign-born population - Belize (%)
Place of birth for the foreign-born population - Costa Rica (%)
Place of birth for the foreign-born population - El Salvador (%)
Place of birth for the foreign-born population - Guatemala (%)
Place of birth for the foreign-born population - Honduras (%)
Place of birth for the foreign-born population - Mexico (%)
Place of birth for the foreign-born population - Nicaragua (%)
Place of birth for the foreign-born population - Panama (%)
Place of birth for the foreign-born population - Other Central America (%)
Place of birth for the foreign-born population - Argentina (%)
Place of birth for the foreign-born population - Bolivia (%)
Place of birth for the foreign-born population - Brazil (%)
Place of birth for the foreign-born population - Chile (%)
Place of birth for the foreign-born population - Colombia (%)
Place of birth for the foreign-born population - Ecuador (%)
Place of birth for the foreign-born population - Guyana (%)
Place of birth for the foreign-born population - Peru (%)
Place of birth for the foreign-born population - Uruguay (%)
Place of birth for the foreign-born population - Venezuela (%)
Place of birth for the foreign-born population - Other South America (%)
Place of birth for the foreign-born population - Canada (%)
Place of birth for the foreign-born population - Other Northern America (%)
Place of birth for the foreign-born population - Other (%)
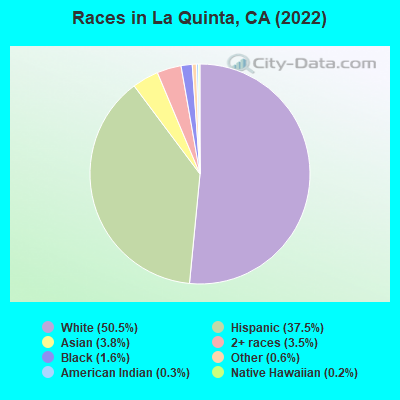
According to 2022 data, the most numerous races in La Quinta, CA are Hispanic (15,205 residents), White alone (21,948 residents), and Asian alone (1,597 residents). 73.5% of La Quinta residents speak English at home. 15.3% of La Quinta, CA residents are foreign-born (8.4% born in Latin America, 2.3% born in Asia, 2.1% born in Europe, 2.0% born in North America), which is 70.0% less than the foreign-born rate of 26.0% across the entire state of California.
Race distribution in La Quinta
2000 2022
15,816,790 46.7% White alone 10,966,556 32.4% Hispanic 3,648,860 10.8% Asian alone 2,181,926 6.4% Black alone 903,115 2.7% Two or more races 178,984 0.5% American Indian alone 103,736 0.3% Native Hawaiian and Other 71,681 0.2% Other race alone
15,732,184 40.3% Hispanic 13,160,426 33.7% White alone 5,957,867 15.3% Asian alone 2,025,218 5.2% Black alone 1,663,222 4.3% Two or more races 251,618 0.6% Other race alone 135,777 0.3% Native Hawaiian and Other 103,030 0.3% American Indian alone
Income and house value in La Quinta Median household income in 2022 $120,539 White non-Hispanic householders$52,914 Black householders$156,060 American Indian and Alaska Native householders$97,411 Asian householders$67,706 Some other race householders$108,629 Two or more races householders$74,314 Hispanic or Latino race householdersMedian 2022 house value $689,265 White Non-Hispanic householders$481,585 Black or African American householders$400,601 American Indian or Alaska Native householders $713,020 Asian householders$400,241 Some other race householders$678,467 Two or more races householders$389,803 Hispanic or Latino householders
Median age by race in La Quinta
56.3 Median age for White residents54.7 57.5 43.4 Median age for Black or African American residents54.0 22.3 19.5 Median age for American Indian / Alaska Native residents50.0 Median age for Asian residents45.1 54.6 13.1 Median age for Native Hawaiian / Pacific Islander residents31.1 Median age for Other race residents31.1 31.0 22.2 Median age for Two or more races residents24.4 20.7 61.6 Median age for White alone residents60.2 62.8 32.0 Median age for Hispanic or Latino residents30.6 33.7
Owner/renter occupied households by race in La Quinta
House owners and renters - White residents 9,412 78.5% Owner occupied2,576 21.5% Renter occupiedHouse owners and renters - Black or African American residents 57 21.2% Owner occupied213 78.8% Renter occupiedHouse owners and renters - American Indian / Alaska Native residents 38 100.0% Owner occupiedHouse owners and renters - Asian residents 409 60.7% Owner occupied265 39.3% Renter occupiedHouse owners and renters - Other race residents 1,140 65.2% Owner occupied609 34.8% Renter occupiedHouse owners and renters - Two or more races residents 668 84.0% Owner occupied128 16.0% Renter occupiedHouse owners and renters - White alone residents 8,512 81.9% Owner occupied1,883 18.1% Renter occupiedHouse owners and renters - Hispanic or Latino residents 2,575 60.1% Owner occupied1,708 39.9% Renter occupied
Language usage in La Quinta
English speakers - Total 73.5% of residents of La Quinta speak English at home.
21.4% of residents speak Spanish at home 5,883 69.8% Speak English very well2,540 30.2% Speak English less than very well5.3% of residents speak other language at home 1,429 68.5% Speak English very well658 31.5% Speak English less than very well
English speakers - Born in the United States 94.6% of residents of La Quinta speak English at home.
3.1% of residents speak Spanish at home 320 87.4% Speak English very well46 12.6% Speak English less than very well2.0% of residents speak other language at home 195 82.3% Speak English very well42 17.7% Speak English less than very well
English speakers - Native, born elsewhere 65.1% of residents of La Quinta speak English at home.
21.0% of residents speak Spanish at home 98 97.0% Speak English very well3 3.0% Speak English less than very well13.9% of residents speak other language at home 67 100.0% Speak English very well
English speakers - Foreign-born 32.8% of residents of La Quinta speak English at home.
46.6% of residents speak Spanish at home 1,086 36.9% Speak English very well1,855 63.1% Speak English less than very well22.5% of residents speak other language at home 831 58.5% Speak English very well589 41.5% Speak English less than very well
White (Caucasian) - Speak only English Native:
91.5% (21,405)Foreign-born:
46.1% (1,181)
White (Caucasian) - Speak another language Native:
10.0% (2,344)Foreign-born:
60.6% (1,554)
Black or African American - Speak only English Native:
98.1% (660)Foreign-born:
44.6% (52)
Black or African American - Speak another language Native:
2.1% (14)Foreign-born:
55.4% (64)
American Indian / Alaska Native - Speak only English Native:
83.5% (42)Foreign-born:
89.9% (28)
Asian - Speak only English Native:
70.3% (431)Foreign-born:
21.3% (204)
Asian - Speak another language Native:
30.1% (185)Foreign-born:
80.4% (770)
Other race - Speak only English Native:
35.0% (1,491)Foreign-born:
20.8% (338)
Other race - Speak another language Native:
65.4% (2,790)Foreign-born:
84.5% (1,372)
Two or more races - Speak only English Native:
67.2% (2,253)Foreign-born:
57.9% (89)
White alone - Speak only English Native:
96.6% (18,889)Foreign-born:
63.7% (1,191)
White alone - Speak another language Native:
3.3% (654)Foreign-born:
34.4% (644)
Hispanic or Latino - Speak only English Native:
50.1% (5,560)Foreign-born:
12.7% (424)
Hispanic or Latino - Speak another language Native:
50.6% (5,608)Foreign-born:
88.7% (2,961)
Foreign-born residents in La Quinta 6,450 residents are foreign born (8.4% Latin America , 2.3% Asia , 2.1% Europe , 2.0% North America ).
This city:
15.3%California:
100.0%
Marital status for residents in La Quinta Marital status - White (Caucasian) population 15 years and over
Males 25.0% Never married61.5% Now married1.1% Separated2.5% Widowed9.8% DivorcedFemales 18.3% Never married57.8% Now married2.4% Separated8.2% Widowed13.3% DivorcedWomen who gave birth in the past 12 months Now married:
66.2% (103)Unmarried:
33.8% (53)
Women who did not give birth in the past 12 months Now married:
51.5% (2,160)Unmarried:
48.5% (2,031)
Marital status - Black or African American population 15 years and over
Males 43.4% Never married43.4% Now married0.0% Separated0.0% Widowed13.2% DivorcedFemales 65.1% Never married25.8% Now married0.0% Separated0.0% Widowed9.1% DivorcedWomen who gave birth in the past 12 months Now married:
0.0% (0)Unmarried:
100.0% (26)
Women who did not give birth in the past 12 months Now married:
3.6% (7)Unmarried:
96.4% (185)
Marital status - Asian population 15 years and over
Males 35.6% Never married64.4% Now married0.0% Separated0.0% Widowed0.0% DivorcedFemales 7.4% Never married48.2% Now married9.0% Separated20.2% Widowed15.1% DivorcedWomen who gave birth in the past 12 months Now married:
100.0% (30)Unmarried:
0.0% (0)
Women who did not give birth in the past 12 months Now married:
57.8% (201)Unmarried:
42.2% (147)
Marital status - Other race population 15 years and over
Males 40.4% Never married45.4% Now married1.2% Separated0.3% Widowed12.6% DivorcedFemales 41.3% Never married44.8% Now married3.3% Separated1.7% Widowed8.8% DivorcedWomen who gave birth in the past 12 months Now married:
33.8% (29)Unmarried:
66.2% (58)
Women who did not give birth in the past 12 months Now married:
38.4% (532)Unmarried:
61.6% (853)
Marital status - Two or more races population 15 years and over
Males 73.4% Never married19.5% Now married0.0% Separated0.0% Widowed7.1% DivorcedFemales 50.5% Never married40.2% Now married0.0% Separated4.9% Widowed4.4% DivorcedWomen who gave birth in the past 12 months Now married:
0.0% (0)Unmarried:
100.0% (29)
Women who did not give birth in the past 12 months Now married:
15.2% (94)Unmarried:
84.8% (528)
Marital status - White alone, not Hispanic / Latino population 15 years and over
Males 19.3% Never married67.1% Now married0.7% Separated3.1% Widowed9.7% DivorcedFemales 12.4% Never married63.2% Now married1.5% Separated8.9% Widowed14.0% DivorcedWomen who gave birth in the past 12 months Now married:
45.5% (49)Unmarried:
54.5% (59)
Women who did not give birth in the past 12 months Now married:
60.2% (1,633)Unmarried:
39.8% (1,080)
Marital status - Hispanic or Latino population 15 years and over
Males 44.6% Never married42.1% Now married2.1% Separated0.3% Widowed10.8% DivorcedFemales 39.3% Never married41.9% Now married4.9% Separated4.1% Widowed9.7% DivorcedWomen who gave birth in the past 12 months Now married:
66.4% (107)Unmarried:
33.6% (54)
Women who did not give birth in the past 12 months Now married:
38.6% (1,445)Unmarried:
61.4% (2,297)
Ancestries in La Quinta
1,332 6.2% English1,251 5.8% American1,238 5.7% German798 3.7% European755 3.5% Irish656 3.0% Italian234 1.1% Canadian233 1.1% Norwegian212 1.0% Scottish194 0.9% British181 0.8% Swedish171 0.8% Polish164 0.8% Dutch141 0.7% Austrian134 0.6% Palestinian125 0.6% Eastern European116 0.5% Northern European112 0.5% Romanian106 0.5% Serbian92 0.4% Scotch-Irish91 0.4% Russian81 0.4% Greek80 0.4% French Canadian72 0.3% French70 0.3% African65 0.3% Czech61 0.3% Scandinavian60 0.3% Armenian57 0.3% Croatian53 0.2% Iranian47 0.2% Portuguese37 0.2% Ukrainian32 0.1% Czechoslovakian27 0.1% Lebanese27 0.1% Danish26 0.1% Slovene24 0.1% Welsh18 0.08% Slovak17 0.08% Swiss13 0.06% Finnish13 0.06% Israeli12 0.06% German Russian11 0.05% Hungarian8 0.04% Estonian6 0.03% Egyptian3 0.01% New Zealander
Geographical mobility in La Quinta Same house 1 year ago 23,946 90.9% White (Caucasian)651 81.4% Black or African American78 100.0% American Indian / Alaska Native1,355 83.8% Asian26 100.0% Native Hawaiian / Pacific Islander5,363 88.7% Other race3,662 94.4% Two or more races20,023 90.0% White alone, not Hispanic / Latino12,992 90.4% Hispanic or LatinoMoved within same county 1,166 4.4% White / Caucasian39 4.9% Black or African American187 11.6% Asian470 7.8% Other race227 5.8% Two or more races1,069 4.8% White alone, not Hispanic / Latino950 6.6% Hispanic or LatinoMoved within same state 545 2.1% White / Caucasian104 13.0% Black or African American11 0.7% Asian82 1.4% Other race21 0.6% Two or more races435 2.0% White alone, not Hispanic / Latino252 1.8% Hispanic or LatinoMoved from different state 622 2.4% White / Caucasian16 1.9% Black or African American13 0.8% Asian88 1.5% Other race41 1.1% Two or more races634 2.9% White alone, not Hispanic / Latino128 0.9% Hispanic or LatinoMoved from abroad 223 0.8% White9 0.5% Asian14 0.2% Other race135 0.6% White alone, not Hispanic / Latino47 0.3% Hispanic or Latino
Children Nativity (place of birth) in La Quinta
Children under 6 years - Living with two parents Both parents native 940 100.0% NativeBoth parents foreign-born 309 100.0% NativeOne native, one foreign-born parent 264 100.0% NativeChildren under 6 years - Living with one parent Native parent 676 100.0% NativeForeign-born parent 93 100.0% NativeChildren 6 to 17 years - Living with two parents Both parents native 2,013 100.0% Native1 0.0% Foreign-bornBoth parents foreign-born 624 87.0% Native94 13.0% Foreign-bornOne native, one foreign-born parent 741 100.0% NativeChildren 6 to 17 years - Living with one parent Native parent 1,330 100.0% NativeForeign-born parent 294 51.5% Native276 48.5% Foreign-born
Grandparents responsible for own grandchildren in La Quinta
Grandparents (30 to 59 years) White / Caucasian 23 14.5% Responsible for grandchildren137 85.5% Not responsible for grandchildrenBlack or African American 20 100.0% Responsible for grandchildrenOther race 29 100.0% Not responsible for grandchildrenTwo or more races 59 100.0% Not responsible for grandchildrenWhite alone, not Hispanic / Latino 26 67.9% Responsible for grandchildren12 32.1% Not responsible for grandchildrenHispanic or Latino 18 7.2% Responsible for grandchildren231 92.8% Not responsible for grandchildrenGrandparents (60 years and over) White / Caucasian 91 23.9% Responsible for grandchildren290 76.1% Not responsible for grandchildrenOther race 14 9.9% Responsible for grandchildren132 90.1% Not responsible for grandchildrenWhite alone, not Hispanic / Latino 59 24.7% Responsible for grandchildren180 75.3% Not responsible for grandchildrenHispanic or Latino 74 19.2% Responsible for grandchildren309 80.8% Not responsible for grandchildren