Races in Lake Arbor, Maryland (MD) Detailed Stats
Ancestries, Foreign-born residents, place of birth
Settings
X


Recent posts about races in Lake Arbor, Maryland on our local forum with over 2,400,000 registered users:

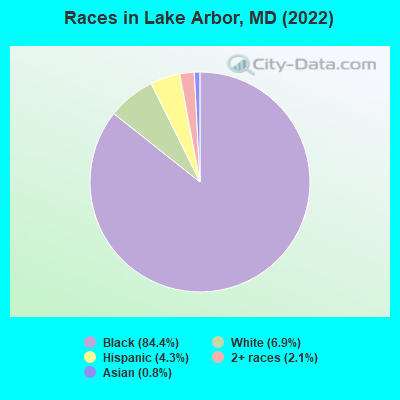
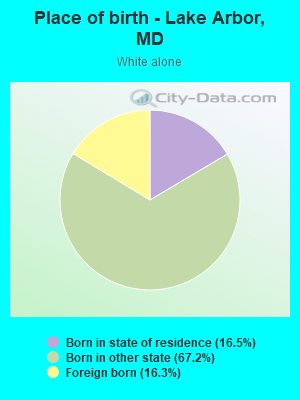
According to 2022 data, the most numerous races in Lake Arbor, MD are White alone (1,010 residents), Black alone (12,442 residents), and Hispanic (631 residents). 77.6% of Lake Arbor residents speak English at home. 21.8% of Lake Arbor, MD residents are foreign-born (11.3% born in Africa, 6.7% born in Latin America), which is 26.6% greater than the foreign-born rate of 16.0% across the entire state of Maryland.
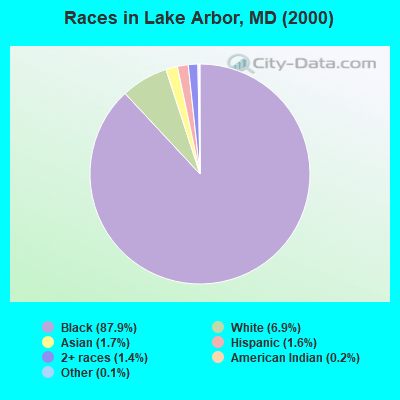
Race distribution in Lake Arbor
2000
2022

- 7,50387.9%Black alone
- 5916.9%White alone
- 1451.7%Asian alone
- 1401.6%Hispanic
- 1191.4%Two or more races
- 210.2%American Indian alone
- 120.1%Other race alone
- 20.02%Native Hawaiian and Other
Pacific Islander alone
-
- 12,44284.4%Black alone
- 1,0106.9%White alone
- 6314.3%Hispanic
- 3122.1%Two or more races
- 1230.8%Asian alone
- 100.07%American Indian alone
2000
2022
-
- 3,286,54762.1%White alone
- 1,464,73527.7%Black alone
- 227,9164.3%Hispanic
- 209,7384.0%Asian alone
- 82,9461.6%Two or more races
- 13,3120.3%American Indian alone
- 9,3790.2%Other race alone
- 1,9130.04%Native Hawaiian and Other
Pacific Islander alone

-
- 2,906,49247.1%White alone
- 1,800,91429.2%Black alone
- 705,84211.4%Hispanic
- 401,8186.5%Asian alone
- 291,3174.7%Two or more races
- 46,9300.8%Other race alone
- 8,9300.1%American Indian alone
- 2,4170.04%Native Hawaiian and Other
Pacific Islander alone

Income and house value in Lake Arbor
- Median household income in 2022
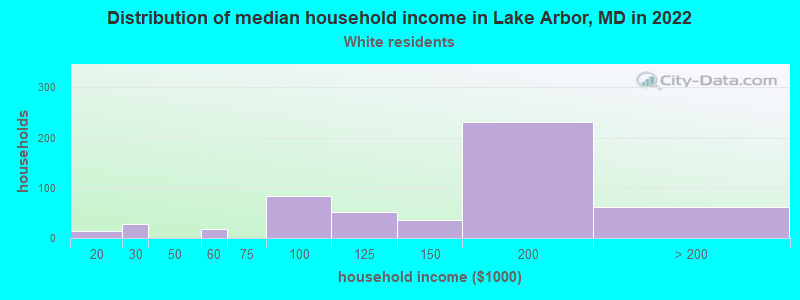
- $149,015White non-Hispanic householders
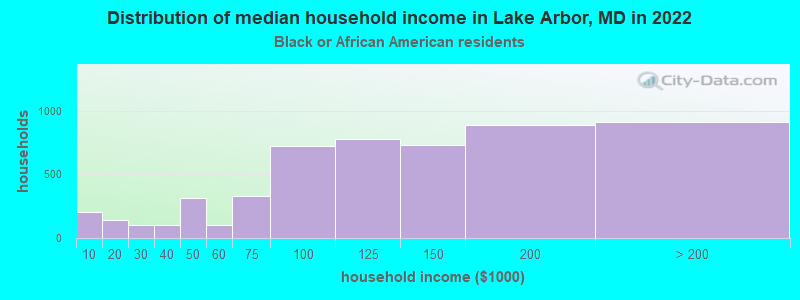
- $118,443Black householders
- $76,868Asian householders
- $82,838Two or more races householders
- Median 2022 house value
- $457,446White Non-Hispanic householders
- $463,345Black or African American householders
- $368,692Asian householders
- $415,348Two or more races householders
- $483,187Hispanic or Latino householders
Household income for White non-Hispanic householders
Household income for Black householders
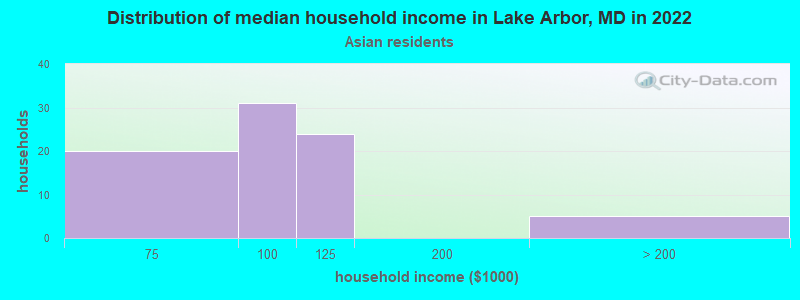
Household income for Asian householders
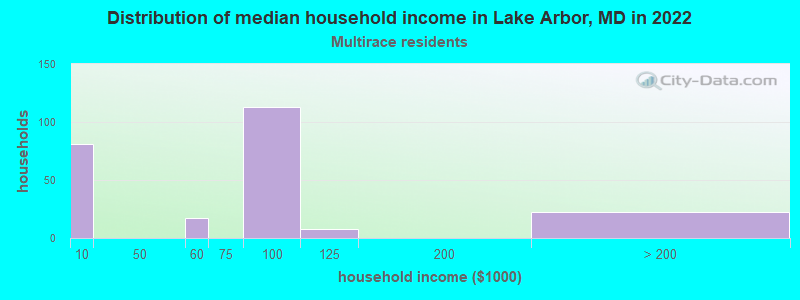
Household income for Two or more races householders
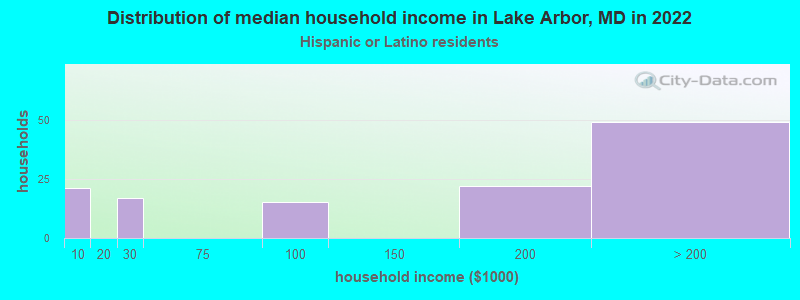
Household income for Hispanic or Latino race householders
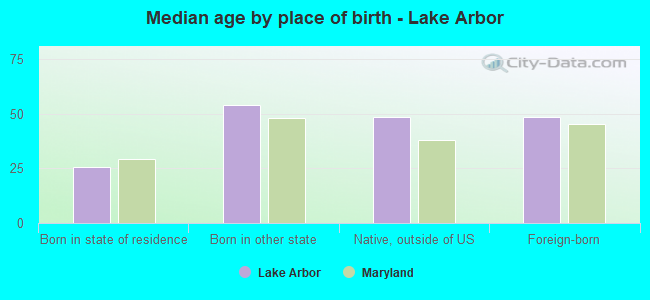
Median age by race in Lake Arbor
- 49.3Median age for White residents
- 59.1Males
- 40.9Females
- 45.3Median age for Black or African American residents
- 42.9Males
- 45.7Females
- -780,410,741.7Median age for American Indian / Alaska Native residents
- -888,297,871.5Males
- -689,905,591.2Females
- 60.2Median age for Asian residents
- 49.1Males
- 60.9Females
- -571,600,480.8Median age for Native Hawaiian / Pacific Islander residents
- -720,061,021.4Males
- -760,942,760.2Females
- 47.0Median age for Other race residents
- 48.4Males
- -678,921,567.9Females
- 39.2Median age for Two or more races residents
- 26.9Males
- 53.6Females
- 48.0Median age for White alone residents
- 48.0Males
- 39.4Females
- 40.5Median age for Hispanic or Latino residents
- 16.9Males
- 45.8Females
Owner/renter occupied households by race in Lake Arbor
- House owners and renters - White residents
- 19034.6%Owner occupied
- 36065.4%Renter occupied
- House owners and renters - Black or African American residents
- 3,54766.3%Owner occupied
- 1,80533.7%Renter occupied
- House owners and renters - American Indian / Alaska Native residents
- 10100.0%Renter occupied
- House owners and renters - Asian residents
- 4658.6%Owner occupied
- 3241.4%Renter occupied
- House owners and renters - Other race residents
- 18100.0%Renter occupied
- House owners and renters - Two or more races residents
- 15572.3%Owner occupied
- 5927.7%Renter occupied
- House owners and renters - White alone residents
- 18234.2%Owner occupied
- 35165.8%Renter occupied
- House owners and renters - Hispanic or Latino residents
- 10476.6%Owner occupied
- 3223.4%Renter occupied
Language usage in Lake Arbor
- English speakers - Total
- 77.6% of residents of Lake Arbor speak English at home.
- 3.1% of residents speak Spanish at home
- 38288.6%Speak English very well
- 4911.4%Speak English less than very well
- 19.8% of residents speak other language at home
- 2,40886.3%Speak English very well
- 38313.7%Speak English less than very well
- English speakers - Born in the United States
- 93.2% of residents of Lake Arbor speak English at home.
- 1.9% of residents speak Spanish at home
- 11992.2%Speak English very well
- 107.8%Speak English less than very well
- 5.0% of residents speak other language at home
- 29885.6%Speak English very well
- 5014.4%Speak English less than very well
- English speakers - Native, born elsewhere
- 97.0% of residents of Lake Arbor speak English at home.
- 4.9% of residents speak Spanish at home
- 8100.0%Speak English very well
- English speakers - Foreign-born
- 33.7% of residents of Lake Arbor speak English at home.
- 7.7% of residents speak Spanish at home
- 21484.9%Speak English very well
- 3815.1%Speak English less than very well
- 63.2% of residents speak other language at home
- 1,79587.2%Speak English very well
- 26412.8%Speak English less than very well
White (Caucasian) - Speak only English
| Native: | 90.6% (729) |
| Foreign-born: | 7.0% (10) |
White (Caucasian) - Speak another language
| Native: | 9.5% (76) |
| Foreign-born: | 86.4% (123) |
Black or African American - Speak only English
| Native: | 92.9% (8,752) |
| Foreign-born: | 34.2% (930) |
Black or African American - Speak another language
| Native: | 7.5% (709) |
| Foreign-born: | 66.3% (1,805) |
Two or more races - Speak only English
| Native: | 97.2% (282) |
| Foreign-born: | 50.4% (150) |
Two or more races - Speak another language
| Native: | 0.9% (3) |
| Foreign-born: | 42.4% (126) |
White alone - Speak only English
| Native: | 88.8% (727) |
| Foreign-born: | 6.9% (11) |
White alone - Speak another language
| Native: | 12.4% (102) |
| Foreign-born: | 91.7% (149) |
Hispanic or Latino - Speak another language
| Native: | 25.0% (53) |
| Foreign-born: | 100.0% (269) |
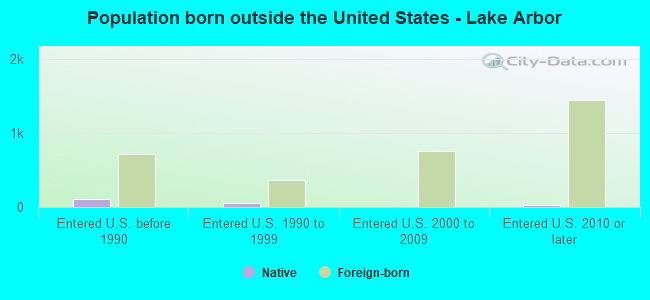
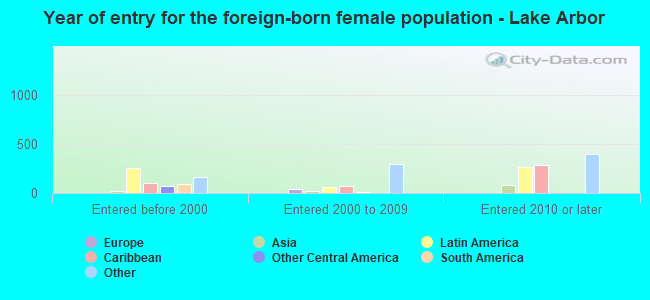
Foreign-born residents in Lake Arbor
3,215 residents are foreign born (11.3% Africa, 6.7% Latin America).
| This city: | 21.8% |
| Maryland: | 15.7% |

Marital status for residents in Lake Arbor
Marital status - White (Caucasian) population 15 years and over
- Males
- 10.3%Never married
- 60.9%Now married
- 0.0%Separated
- 13.3%Widowed
- 15.5%Divorced
- Females
- 34.2%Never married
- 46.1%Now married
- 2.3%Separated
- 13.1%Widowed
- 4.2%Divorced
Women who did not give birth in the past 12 months
| Now married: | 51.6% (114) |
| Unmarried: | 48.4% (107) |
Marital status - Black or African American population 15 years and over
- Males
- 46.9%Never married
- 38.3%Now married
- 1.3%Separated
- 1.0%Widowed
- 12.4%Divorced
- Females
- 44.4%Never married
- 27.6%Now married
- 1.4%Separated
- 9.5%Widowed
- 17.1%Divorced
Women who gave birth in the past 12 months
| Now married: | 74.1% (100) |
| Unmarried: | 25.9% (35) |
Women who did not give birth in the past 12 months
| Now married: | 19.8% (558) |
| Unmarried: | 80.2% (2,257) |
Marital status - American Indian / Alaska Native population 15 years and over
- Males
- 0.0%Never married
- 100.0%Now married
- 0.0%Separated
- 0.0%Widowed
- 0.0%Divorced
- Females
- 0.0%Never married
- 100.0%Now married
- 0.0%Separated
- 0.0%Widowed
- 0.0%Divorced
Women who did not give birth in the past 12 months
| Now married: | 100.0% (61) |
| Unmarried: | 0.0% (0) |
Marital status - Asian population 15 years and over
- Males
- 0.0%Never married
- 100.0%Now married
- 0.0%Separated
- 0.0%Widowed
- 0.0%Divorced
- Females
- 16.1%Never married
- 25.8%Now married
- 0.0%Separated
- 0.0%Widowed
- 58.1%Divorced
Women who did not give birth in the past 12 months
| Now married: | 77.4% (23) |
| Unmarried: | 22.6% (7) |
Marital status - Other race population 15 years and over
- Males
- 0.0%Never married
- 100.0%Now married
- 0.0%Separated
- 0.0%Widowed
- 0.0%Divorced
- Females
- 0.0%Never married
- 100.0%Now married
- 0.0%Separated
- 0.0%Widowed
- 0.0%Divorced
Women who did not give birth in the past 12 months
| Now married: | 100.0% (13) |
| Unmarried: | 0.0% (0) |
Marital status - Two or more races population 15 years and over
- Males
- 60.3%Never married
- 18.5%Now married
- 9.0%Separated
- 0.0%Widowed
- 12.2%Divorced
- Females
- 61.8%Never married
- 18.5%Now married
- 0.0%Separated
- 0.0%Widowed
- 19.7%Divorced
Women who did not give birth in the past 12 months
| Now married: | 0.0% (0) |
| Unmarried: | 100.0% (77) |
Marital status - White alone, not Hispanic / Latino population 15 years and over
- Males
- 10.7%Never married
- 59.5%Now married
- 0.0%Separated
- 13.8%Widowed
- 16.0%Divorced
- Females
- 37.5%Never married
- 47.9%Now married
- 0.0%Separated
- 14.4%Widowed
- 0.2%Divorced
Women who did not give birth in the past 12 months
| Now married: | 49.2% (114) |
| Unmarried: | 50.8% (118) |
Marital status - Hispanic or Latino population 15 years and over
- Males
- 24.1%Never married
- 65.9%Now married
- 10.0%Separated
- 0.0%Widowed
- 0.0%Divorced
- Females
- 17.8%Never married
- 40.3%Now married
- 5.1%Separated
- 0.0%Widowed
- 36.9%Divorced
Women who did not give birth in the past 12 months
| Now married: | 70.7% (67) |
| Unmarried: | 29.3% (28) |
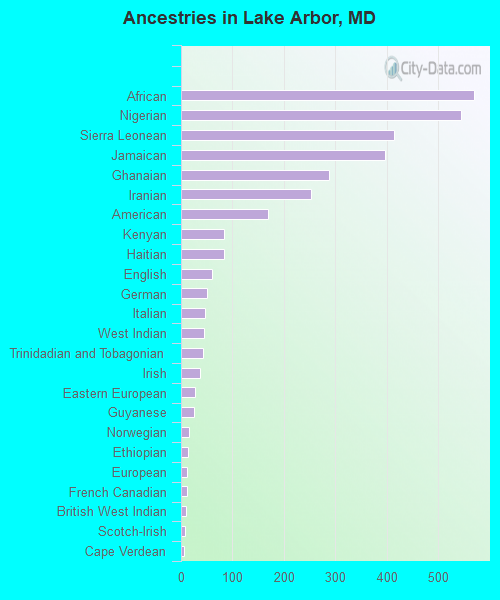
Ancestries in Lake Arbor

- 5705.3%African
- 5445.0%Nigerian
- 4133.8%Sierra Leonean
- 3963.7%Jamaican
- 2882.7%Ghanaian
- 2532.3%Iranian
- 1701.6%American
- 830.8%Kenyan
- 830.8%Haitian
- 600.6%English
- 500.5%German
- 470.4%Italian
- 450.4%West Indian
- 430.4%Trinidadian and Tobagonian
- 360.3%Irish
- 270.2%Eastern European
- 260.2%Guyanese
- 150.1%Norwegian
- 130.1%Ethiopian
- 120.1%European
- 120.1%French Canadian
- 100.09%British West Indian
- 80.07%Scotch-Irish
- 60.06%Cape Verdean
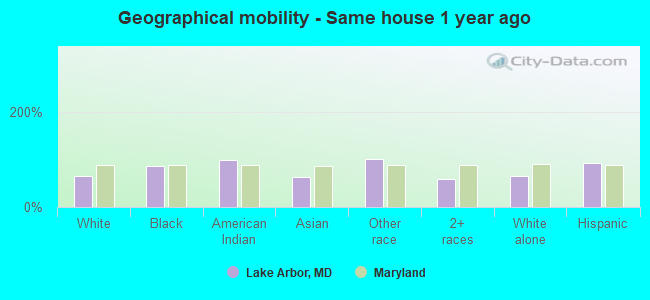
Geographical mobility in Lake Arbor

- Same house 1 year ago
- 63863.8%White (Caucasian)
- 10,80885.8%Black or African American
- 7598.9%American Indian / Alaska Native
- 7761.5%Asian
- 98100.0%Other race
- 32157.8%Two or more races
- 64563.7%White alone, not Hispanic / Latino
- 58192.0%Hispanic or Latino
-
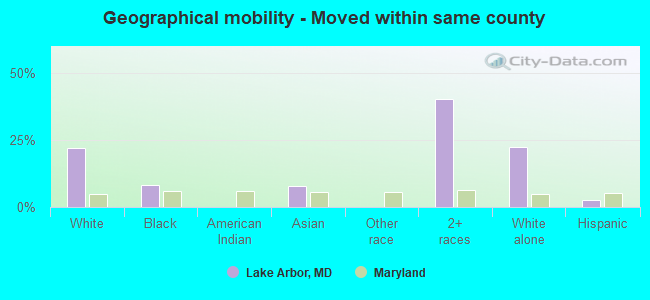
- Moved within same county
- 22022.0%White / Caucasian
- 1,0538.4%Black or African American
- 107.9%Asian
- 22340.2%Two or more races
- 22722.4%White alone, not Hispanic / Latino
- 172.7%Hispanic or Latino
-
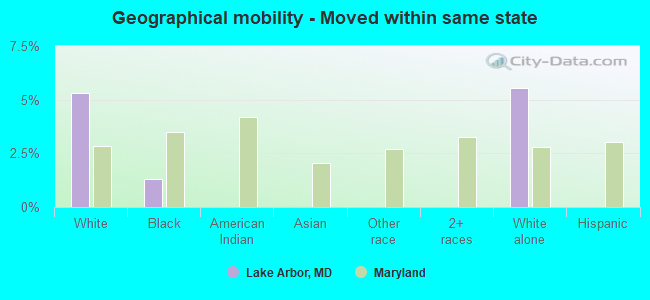
- Moved within same state
- 535.3%White / Caucasian
- 1651.3%Black or African American
- 565.5%White alone, not Hispanic / Latino
-
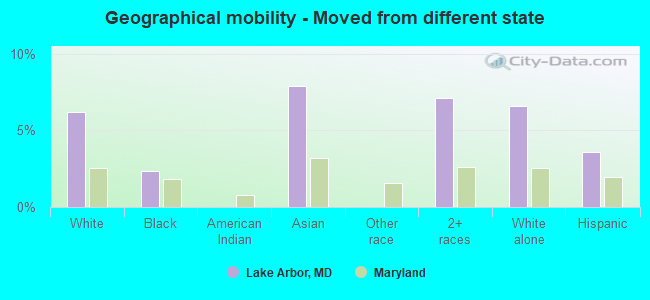
- Moved from different state
- 626.2%White / Caucasian
- 2962.4%Black or African American
- 107.9%Asian
- 407.1%Two or more races
- 666.6%White alone, not Hispanic / Latino
- 233.6%Hispanic or Latino
-
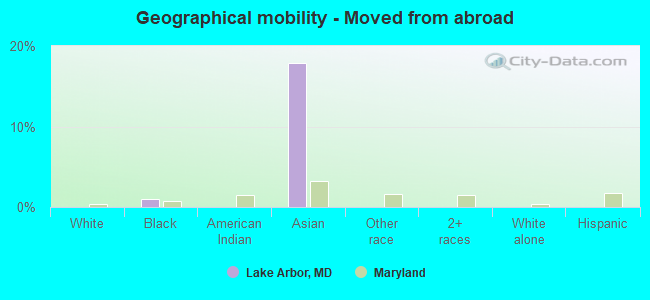
- Moved from abroad
- 1211.0%Black or African American
- 2217.9%Asian
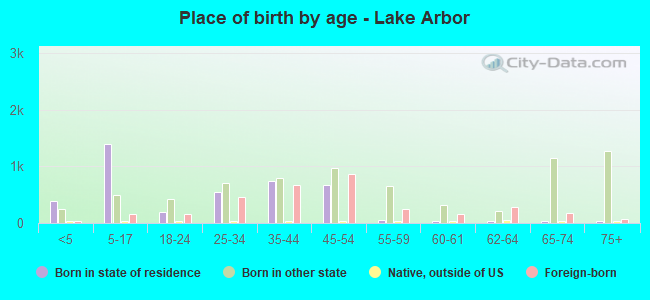
Children Nativity (place of birth) in Lake Arbor
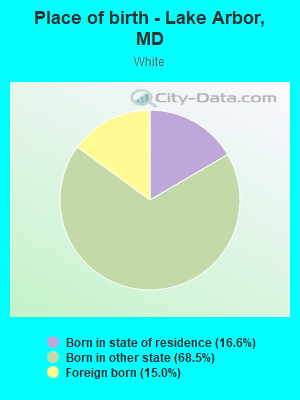
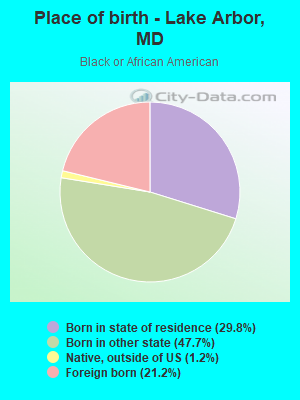
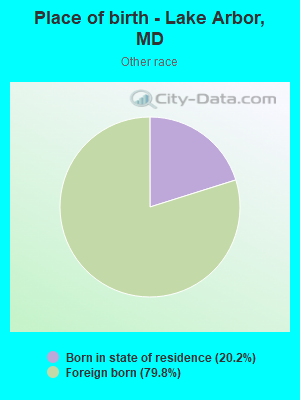
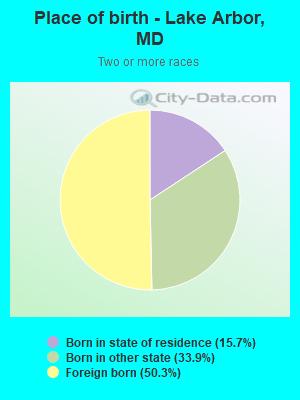
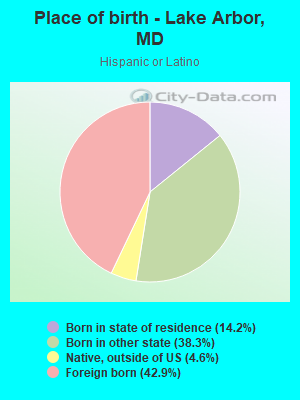
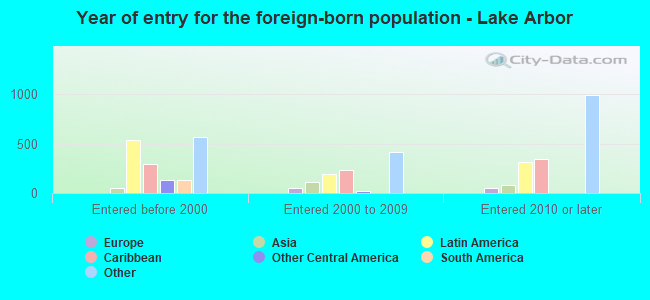
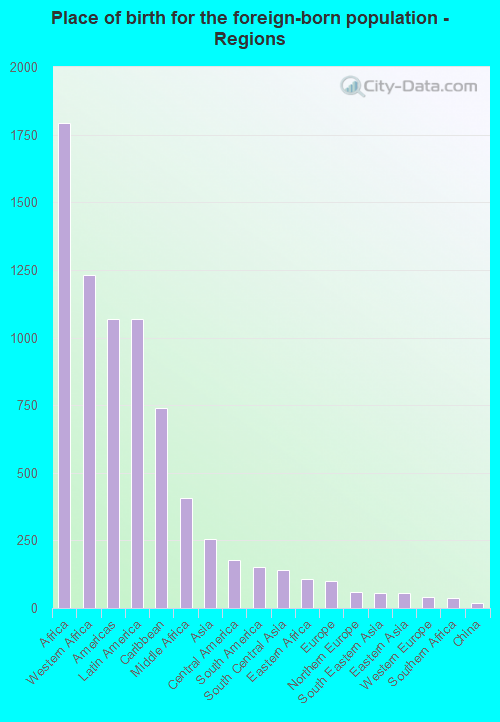
Place of birth for residents in Lake Arbor
![Place of birth for the foreign-born population - Regions]()
- 1,792Africa
- 1,230Western Africa
- 1,069Americas
- 1,069Latin America
- 741Caribbean
- 405Middle Africa
- 254Asia
- 177Central America
- 151South America
- 142South Central Asia
- 108Eastern Africa
- 98Europe
- 58Northern Europe
- 57South Eastern Asia
- 54Eastern Asia
- 39Western Europe
- 37Southern Africa
- 18China
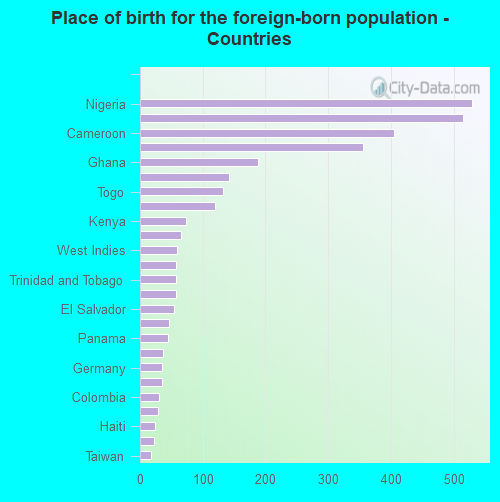
![Place of birth for the foreign-born population - Countries]()
- 530Nigeria
- 515Jamaica
- 405Cameroon
- 356Sierra Leone
- 188Ghana
- 142Iran
- 133Togo
- 119Guyana
- 73Kenya
- 66Dominican Republic
- 59West Indies
- 58England
- 58Trinidad and Tobago
- 57Philippines
- 55El Salvador
- 47Nicaragua
- 44Panama
- 36Korea
- 35Germany
- 35Tanzania
- 31Colombia
- 28Honduras
- 24Haiti
- 22Liberia
- 18Taiwan
- 4France
Grandparents responsible for own grandchildren in Lake Arbor
Zip codes: 20721.