Races in Lake Arrowhead, California (CA) Detailed Stats
Data:
Races - White alone (%)
Races - White alone (% change since 2000)
Races - Black alone (%)
Races - Black alone (% change since 2000)
Races - American Indian alone (%)
Races - American Indian alone (% change since 2000)
Races - Asian alone (%)
Races - Asian alone (% change since 2000)
Races - Hispanic (%)
Races - Hispanic (% change since 2000)
Races - Native Hawaiian and Other Pacific Islander alone (%)
Races - Native Hawaiian and Other Pacific Islander alone (% change since 2000)
Races - Two or more races(%)
Races - Two or more races(% change since 2000)
Races - Other race alone (%)
Races - Other race alone (% change since 2000)
Racial diversity
Place of birth - Born in state of residence (%)
Place of birth - Born in state of residence (%) - White
Place of birth - Born in state of residence (%) - Black or African American
Place of birth - Born in state of residence (%) - Asian
Place of birth - Born in state of residence (%) - Hispanic or Latino
Place of birth - Born in state of residence (%) - American Indian and Alaska Native
Place of birth - Born in state of residence (%) - Multirace
Place of birth - Born in state of residence (%) - Other Race
Place of birth - Born in other state (%)
Place of birth - Born in other state (%) - White
Place of birth - Born in other state (%) - Black or African American
Place of birth - Born in other state (%) - Asian
Place of birth - Born in other state (%) - Hispanic or Latino
Place of birth - Born in other state (%) - American Indian and Alaska Native
Place of birth - Born in other state (%) - Multirace
Place of birth - Born in other state (%) - Other Race
Place of birth - Native, outside of US (%)
Place of birth - Native, outside of US (%) - White
Place of birth - Native, outside of US (%) - Black or African American
Place of birth - Native, outside of US (%) - Asian
Place of birth - Native, outside of US (%) - Hispanic or Latino
Place of birth - Native, outside of US (%) - American Indian and Alaska Native
Place of birth - Native, outside of US (%) - Multirace
Place of birth - Native, outside of US (%) - Other Race
Place of birth - Foreign born (%)
Place of birth - Foreign born (%) - White
Place of birth - Foreign born (%) - Black or African American
Place of birth - Foreign born (%) - Asian
Place of birth - Foreign born (%) - Hispanic or Latino
Place of birth - Foreign born (%) - American Indian and Alaska Native
Place of birth - Foreign born (%) - Multirace
Place of birth - Foreign born (%) - Other Race
Residents speaking English at home (%)
Residents speaking English at home - Born in the United States (%)
Residents speaking English at home - Native, born elsewhere (%)
Residents speaking English at home - Foreign born (%)
Residents speaking Spanish at home (%)
Residents speaking Spanish at home - Born in the United States (%)
Residents speaking Spanish at home - Native, born elsewhere (%)
Residents speaking Spanish at home - Foreign born (%)
Residents speaking other language at home (%)
Residents speaking other language at home - Born in the United States (%)
Residents speaking other language at home - Native, born elsewhere (%)
Residents speaking other language at home - Foreign born (%)
Marital status - Never married (%)
Marital status - Now married (%)
Marital status - Separated (%)
Marital status - Widowed (%)
Marital status - Divorced (%)
Ancestries Reported - Arab (%)
Ancestries Reported - Czech (%)
Ancestries Reported - Danish (%)
Ancestries Reported - Dutch (%)
Ancestries Reported - English (%)
Ancestries Reported - French (%)
Ancestries Reported - French Canadian (%)
Ancestries Reported - German (%)
Ancestries Reported - Greek (%)
Ancestries Reported - Hungarian (%)
Ancestries Reported - Irish (%)
Ancestries Reported - Italian (%)
Ancestries Reported - Lithuanian (%)
Ancestries Reported - Norwegian (%)
Ancestries Reported - Polish (%)
Ancestries Reported - Portuguese (%)
Ancestries Reported - Russian (%)
Ancestries Reported - Scotch-Irish (%)
Ancestries Reported - Scottish (%)
Ancestries Reported - Slovak (%)
Ancestries Reported - Subsaharan African (%)
Ancestries Reported - Swedish (%)
Ancestries Reported - Swiss (%)
Ancestries Reported - Ukrainian (%)
Ancestries Reported - United States (%)
Ancestries Reported - Welsh (%)
Ancestries Reported - West Indian (%)
Ancestries Reported - Other (%)
Geographical mobility - Same house 1 year ago (%)
Geographical mobility - Same house 1 year ago (%) - White
Geographical mobility - Same house 1 year ago (%) - Black or African American
Geographical mobility - Same house 1 year ago (%) - Asian
Geographical mobility - Same house 1 year ago (%) - Hispanic or Latino
Geographical mobility - Same house 1 year ago (%) - American Indian and Alaska Native
Geographical mobility - Same house 1 year ago (%) - Multirace
Geographical mobility - Same house 1 year ago (%) - Other Race
Geographical mobility - Moved within same county (%)
Geographical mobility - Moved within same county (%) - White
Geographical mobility - Moved within same county (%) - Black or African American
Geographical mobility - Moved within same county (%) - Asian
Geographical mobility - Moved within same county (%) - Hispanic or Latino
Geographical mobility - Moved within same county (%) - American Indian and Alaska Native
Geographical mobility - Moved within same county (%) - Multirace
Geographical mobility - Moved within same county (%) - Other Race
Geographical mobility - Moved from different county within same state (%)
Geographical mobility - Moved from different county within same state (%) - White
Geographical mobility - Moved from different county within same state (%) - Black or African American
Geographical mobility - Moved from different county within same state (%) - Asian
Geographical mobility - Moved from different county within same state (%) - Hispanic or Latino
Geographical mobility - Moved from different county within same state (%) - American Indian and Alaska Native
Geographical mobility - Moved from different county within same state (%) - Multirace
Geographical mobility - Moved from different county within same state (%) - Other Race
Geographical mobility - Moved from different state (%)
Geographical mobility - Moved from different state (%) - White
Geographical mobility - Moved from different state (%) - Black or African American
Geographical mobility - Moved from different state (%) - Asian
Geographical mobility - Moved from different state (%) - Hispanic or Latino
Geographical mobility - Moved from different state (%) - American Indian and Alaska Native
Geographical mobility - Moved from different state (%) - Multirace
Geographical mobility - Moved from different state (%) - Other Race
Geographical mobility - Moved from abroad (%)
Geographical mobility - Moved from abroad (%) - White
Geographical mobility - Moved from abroad (%) - Black or African American
Geographical mobility - Moved from abroad (%) - Asian
Geographical mobility - Moved from abroad (%) - Hispanic or Latino
Geographical mobility - Moved from abroad (%) - American Indian and Alaska Native
Geographical mobility - Moved from abroad (%) - Multirace
Geographical mobility - Moved from abroad (%) - Other Race
Place of birth for the foreign-born population - Ireland (%)
Place of birth for the foreign-born population - Denmark (%)
Place of birth for the foreign-born population - Norway (%)
Place of birth for the foreign-born population - Sweden (%)
Place of birth for the foreign-born population - United Kingdom (%)
Place of birth for the foreign-born population - England (%)
Place of birth for the foreign-born population - Scotland (%)
Place of birth for the foreign-born population - Other Northern Europe (%)
Place of birth for the foreign-born population - Austria (%)
Place of birth for the foreign-born population - Belgium (%)
Place of birth for the foreign-born population - France (%)
Place of birth for the foreign-born population - Germany (%)
Place of birth for the foreign-born population - Netherlands (%)
Place of birth for the foreign-born population - Switzerland (%)
Place of birth for the foreign-born population - Other Western Europe (%)
Place of birth for the foreign-born population - Greece (%)
Place of birth for the foreign-born population - Italy (%)
Place of birth for the foreign-born population - Portugal (%)
Place of birth for the foreign-born population - Spain (%)
Place of birth for the foreign-born population - Other Southern Europe (%)
Place of birth for the foreign-born population - Albania (%)
Place of birth for the foreign-born population - Belarus (%)
Place of birth for the foreign-born population - Bosnia and Herzegovina (%)
Place of birth for the foreign-born population - Bulgaria (%)
Place of birth for the foreign-born population - Croatia (%)
Place of birth for the foreign-born population - Czechoslovakia (%)
Place of birth for the foreign-born population - Hungary (%)
Place of birth for the foreign-born population - Latvia (%)
Place of birth for the foreign-born population - Lithuania (%)
Place of birth for the foreign-born population - North Macedonia (Macedonia) (%)
Place of birth for the foreign-born population - Moldova (%)
Place of birth for the foreign-born population - Poland (%)
Place of birth for the foreign-born population - Romania (%)
Place of birth for the foreign-born population - Russia (%)
Place of birth for the foreign-born population - Serbia (%)
Place of birth for the foreign-born population - Ukraine (%)
Place of birth for the foreign-born population - Other Eastern Europe (%)
Place of birth for the foreign-born population - China (%)
Place of birth for the foreign-born population - Hong Kong (%)
Place of birth for the foreign-born population - Taiwan (%)
Place of birth for the foreign-born population - Japan (%)
Place of birth for the foreign-born population - Korea (%)
Place of birth for the foreign-born population - Other Eastern Asia (%)
Place of birth for the foreign-born population - Afghanistan (%)
Place of birth for the foreign-born population - Bangladesh (%)
Place of birth for the foreign-born population - India (%)
Place of birth for the foreign-born population - Iran (%)
Place of birth for the foreign-born population - Kazakhstan (%)
Place of birth for the foreign-born population - Nepal (%)
Place of birth for the foreign-born population - Pakistan (%)
Place of birth for the foreign-born population - Sri Lanka (%)
Place of birth for the foreign-born population - Uzbekistan (%)
Place of birth for the foreign-born population - Other South Central Asia (%)
Place of birth for the foreign-born population - Burma (%)
Place of birth for the foreign-born population - Cambodia (%)
Place of birth for the foreign-born population - Indonesia (%)
Place of birth for the foreign-born population - Laos (%)
Place of birth for the foreign-born population - Malaysia (%)
Place of birth for the foreign-born population - Philippines (%)
Place of birth for the foreign-born population - Singapore (%)
Place of birth for the foreign-born population - Thailand (%)
Place of birth for the foreign-born population - Vietnam (%)
Place of birth for the foreign-born population - Other South Eastern Asia (%)
Place of birth for the foreign-born population - Armenia (%)
Place of birth for the foreign-born population - Iraq (%)
Place of birth for the foreign-born population - Israel (%)
Place of birth for the foreign-born population - Jordan (%)
Place of birth for the foreign-born population - Kuwait (%)
Place of birth for the foreign-born population - Lebanon (%)
Place of birth for the foreign-born population - Saudi Arabia (%)
Place of birth for the foreign-born population - Syria (%)
Place of birth for the foreign-born population - Turkey (%)
Place of birth for the foreign-born population - Yemen (%)
Place of birth for the foreign-born population - Other Western Asia (%)
Place of birth for the foreign-born population - Eritrea (%)
Place of birth for the foreign-born population - Ethiopia (%)
Place of birth for the foreign-born population - Kenya (%)
Place of birth for the foreign-born population - Somalia (%)
Place of birth for the foreign-born population - Uganda (%)
Place of birth for the foreign-born population - Zimbabwe (%)
Place of birth for the foreign-born population - Other Eastern Africa (%)
Place of birth for the foreign-born population - Cameroon (%)
Place of birth for the foreign-born population - Congo (%)
Place of birth for the foreign-born population - Democratic Republic of Congo (Zaire) (%)
Place of birth for the foreign-born population - Other Middle Africa (%)
Place of birth for the foreign-born population - Egypt (%)
Place of birth for the foreign-born population - Morocco (%)
Place of birth for the foreign-born population - Sudan (%)
Place of birth for the foreign-born population - Other Northern Africa (%)
Place of birth for the foreign-born population - South Africa (%)
Place of birth for the foreign-born population - Other Southern Africa (%)
Place of birth for the foreign-born population - Cabo Verde (%)
Place of birth for the foreign-born population - Ghana (%)
Place of birth for the foreign-born population - Liberia (%)
Place of birth for the foreign-born population - Nigeria (%)
Place of birth for the foreign-born population - Senegal (%)
Place of birth for the foreign-born population - Sierra Leone (%)
Place of birth for the foreign-born population - Other Western Africa (%)
Place of birth for the foreign-born population - Australia (%)
Place of birth for the foreign-born population - New Zealand (%)
Place of birth for the foreign-born population - Fiji (%)
Place of birth for the foreign-born population - Micronesia (%)
Place of birth for the foreign-born population - Bahamas (%)
Place of birth for the foreign-born population - Barbados (%)
Place of birth for the foreign-born population - Cuba (%)
Place of birth for the foreign-born population - Dominica (%)
Place of birth for the foreign-born population - Dominican Republic (%)
Place of birth for the foreign-born population - Grenada (%)
Place of birth for the foreign-born population - Haiti (%)
Place of birth for the foreign-born population - Jamaica (%)
Place of birth for the foreign-born population - St. Vincent and the Grenadines (%)
Place of birth for the foreign-born population - Trinidad and Tobago (%)
Place of birth for the foreign-born population - West Indies (%)
Place of birth for the foreign-born population - Other Caribbean (%)
Place of birth for the foreign-born population - Belize (%)
Place of birth for the foreign-born population - Costa Rica (%)
Place of birth for the foreign-born population - El Salvador (%)
Place of birth for the foreign-born population - Guatemala (%)
Place of birth for the foreign-born population - Honduras (%)
Place of birth for the foreign-born population - Mexico (%)
Place of birth for the foreign-born population - Nicaragua (%)
Place of birth for the foreign-born population - Panama (%)
Place of birth for the foreign-born population - Other Central America (%)
Place of birth for the foreign-born population - Argentina (%)
Place of birth for the foreign-born population - Bolivia (%)
Place of birth for the foreign-born population - Brazil (%)
Place of birth for the foreign-born population - Chile (%)
Place of birth for the foreign-born population - Colombia (%)
Place of birth for the foreign-born population - Ecuador (%)
Place of birth for the foreign-born population - Guyana (%)
Place of birth for the foreign-born population - Peru (%)
Place of birth for the foreign-born population - Uruguay (%)
Place of birth for the foreign-born population - Venezuela (%)
Place of birth for the foreign-born population - Other South America (%)
Place of birth for the foreign-born population - Canada (%)
Place of birth for the foreign-born population - Other Northern America (%)
Place of birth for the foreign-born population - Other (%)
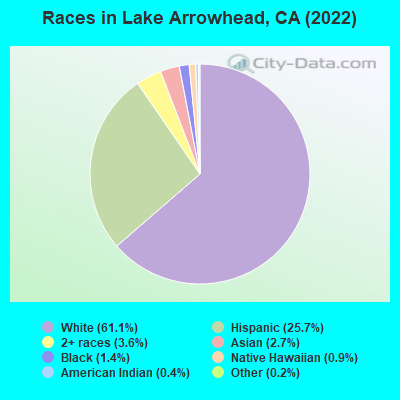
According to 2022 data, the most numerous races in Lake Arrowhead, CA are Hispanic (2,142 residents), White alone (5,798 residents), and Asian alone (139 residents). 79.8% of Lake Arrowhead residents speak English at home. 15.2% of Lake Arrowhead, CA residents are foreign-born (8.1% born in Latin America, 3.9% born in Europe, 1.7% born in Asia), which is 70.7% less than the foreign-born rate of 26.0% across the entire state of California.
Race distribution in Lake Arrowhead
2000 2022
15,816,790 46.7% White alone 10,966,556 32.4% Hispanic 3,648,860 10.8% Asian alone 2,181,926 6.4% Black alone 903,115 2.7% Two or more races 178,984 0.5% American Indian alone 103,736 0.3% Native Hawaiian and Other 71,681 0.2% Other race alone
15,732,184 40.3% Hispanic 13,160,426 33.7% White alone 5,957,867 15.3% Asian alone 2,025,218 5.2% Black alone 1,663,222 4.3% Two or more races 251,618 0.6% Other race alone 135,777 0.3% Native Hawaiian and Other 103,030 0.3% American Indian alone
Income and house value in Lake Arrowhead Median household income in 2022 $99,014 White non-Hispanic householdersover $200,000 Black householders$24,126 American Indian and Alaska Native householders$65,460 Asian householders$14,002 Native Hawaiian and other Pacific Islander householders$56,568 Some other race householders$80,113 Two or more races householders$55,218 Hispanic or Latino race householdersMedian 2022 house value $767,729 White Non-Hispanic householdersover $1,000,000 American Indian or Alaska Native householders $674,868 Asian householders$660,470 Some other race householders$584,885 Two or more races householders$658,671 Hispanic or Latino householders
Median age by race in Lake Arrowhead
48.7 Median age for White residents49.2 48.5 61.6 Median age for Black or African American residents52.5 Median age for American Indian / Alaska Native residents50.1 Median age for Asian residents51.9 49.0 43.3 Median age for Other race residents49.1 33.0 34.1 Median age for Two or more races residents24.5 43.6 51.7 Median age for White alone residents51.9 51.7 37.9 Median age for Hispanic or Latino residents39.0 35.2
Owner/renter occupied households by race in Lake Arrowhead
House owners and renters - White residents 2,153 76.2% Owner occupied674 23.8% Renter occupiedHouse owners and renters - Black or African American residents 17 34.2% Owner occupied33 65.8% Renter occupiedHouse owners and renters - American Indian / Alaska Native residents 50 100.0% Renter occupiedHouse owners and renters - Asian residents 32 46.1% Owner occupied38 53.9% Renter occupiedHouse owners and renters - Other race residents 109 68.6% Owner occupied50 31.4% Renter occupiedHouse owners and renters - Two or more races residents 308 88.3% Owner occupied41 11.7% Renter occupiedHouse owners and renters - White alone residents 1,868 76.0% Owner occupied590 24.0% Renter occupiedHouse owners and renters - Hispanic or Latino residents 544 70.6% Owner occupied226 29.4% Renter occupied
Language usage in Lake Arrowhead
English speakers - Total 79.8% of residents of Lake Arrowhead speak English at home.
14.4% of residents speak Spanish at home 696 55.5% Speak English very well557 44.5% Speak English less than very well6.2% of residents speak other language at home 444 82.7% Speak English very well93 17.3% Speak English less than very well
English speakers - Born in the United States 95.9% of residents of Lake Arrowhead speak English at home.
1.1% of residents speak Spanish at home 15 75.0% Speak English very well5 25.0% Speak English less than very well2.7% of residents speak other language at home 47 100.0% Speak English very well
English speakers - Native, born elsewhere 99.0% of residents of Lake Arrowhead speak English at home.
1.0% of residents speak other language at home 1 100.0% Speak English very well
English speakers - Foreign-born 29.0% of residents of Lake Arrowhead speak English at home.
47.4% of residents speak Spanish at home 185 28.8% Speak English very well457 71.2% Speak English less than very well24.9% of residents speak other language at home 245 72.7% Speak English very well92 27.3% Speak English less than very well
White (Caucasian) - Speak only English Native:
94.5% (5,455)Foreign-born:
28.1% (207)
White (Caucasian) - Speak another language Native:
6.8% (394)Foreign-born:
74.1% (546)
Black or African American - Speak only English Native:
98.8% (23)Foreign-born:
66.8% (41)
Asian - Speak another language Native:
87.4% (27)Foreign-born:
64.2% (69)
Other race - Speak another language Native:
65.6% (204)Foreign-born:
96.8% (110)
Two or more races - Speak only English Native:
74.9% (427)Foreign-born:
47.8% (102)
Two or more races - Speak another language Native:
2.2% (13)Foreign-born:
28.3% (61)
White alone - Speak only English Native:
95.3% (5,041)Foreign-born:
40.1% (170)
White alone - Speak another language Native:
4.7% (251)Foreign-born:
57.9% (246)
Hispanic or Latino - Speak only English Native:
56.4% (727)Foreign-born:
5.3% (39)
Hispanic or Latino - Speak another language Native:
44.7% (577)Foreign-born:
94.3% (691)
Foreign-born residents in Lake Arrowhead 1,384 residents are foreign born (8.1% Latin America , 3.9% Europe , 1.7% Asia ).
This city:
15.2%California:
100.0%
Marital status for residents in Lake Arrowhead Marital status - White (Caucasian) population 15 years and over
Males 25.0% Never married62.0% Now married0.5% Separated1.8% Widowed10.8% DivorcedFemales 18.9% Never married56.7% Now married1.6% Separated7.8% Widowed14.9% DivorcedWomen who gave birth in the past 12 months Now married:
48.4% (12)Unmarried:
51.6% (13)
Women who did not give birth in the past 12 months Now married:
51.9% (672)Unmarried:
48.1% (623)
Marital status - Black or African American population 15 years and over
Males 66.1% Never married6.8% Now married0.0% Separated0.0% Widowed27.1% DivorcedFemales 92.9% Never married0.0% Now married0.0% Separated7.1% Widowed0.0% DivorcedWomen who did not give birth in the past 12 months Now married:
0.0% (0)Unmarried:
100.0% (35)
Marital status - American Indian / Alaska Native population 15 years and over
Males 33.3% Never married66.7% Now married0.0% Separated0.0% Widowed0.0% DivorcedFemales 72.3% Never married7.7% Now married0.0% Separated20.0% Widowed0.0% DivorcedWomen who did not give birth in the past 12 months Now married:
0.0% (0)Unmarried:
100.0% (82)
Marital status - Asian population 15 years and over
Males 0.0% Never married43.5% Now married56.5% Separated0.0% Widowed0.0% DivorcedFemales 0.0% Never married69.1% Now married30.9% Separated0.0% Widowed0.0% DivorcedWomen who did not give birth in the past 12 months Now married:
100.0% (29)Unmarried:
0.0% (0)
Marital status - Other race population 15 years and over
Males 13.8% Never married77.4% Now married0.0% Separated0.0% Widowed8.8% DivorcedFemales 18.5% Never married81.5% Now married0.0% Separated0.0% Widowed0.0% DivorcedWomen who did not give birth in the past 12 months Now married:
80.3% (160)Unmarried:
19.7% (39)
Marital status - Two or more races population 15 years and over
Males 35.1% Never married64.9% Now married0.0% Separated0.0% Widowed0.0% DivorcedFemales 41.1% Never married21.4% Now married0.0% Separated0.0% Widowed37.5% DivorcedWomen who gave birth in the past 12 months Now married:
0.0% (0)Unmarried:
100.0% (6)
Women who did not give birth in the past 12 months Now married:
12.2% (38)Unmarried:
87.8% (271)
Marital status - White alone, not Hispanic / Latino population 15 years and over
Males 22.4% Never married63.4% Now married0.6% Separated2.2% Widowed11.4% DivorcedFemales 17.3% Never married55.8% Now married1.9% Separated9.1% Widowed16.0% DivorcedWomen who gave birth in the past 12 months Now married:
48.4% (13)Unmarried:
51.6% (14)
Women who did not give birth in the past 12 months Now married:
50.4% (557)Unmarried:
49.6% (549)
Marital status - Hispanic or Latino population 15 years and over
Males 31.9% Never married60.2% Now married0.0% Separated0.0% Widowed7.9% DivorcedFemales 25.2% Never married65.6% Now married0.0% Separated2.6% Widowed6.6% DivorcedWomen who did not give birth in the past 12 months Now married:
62.8% (357)Unmarried:
37.2% (211)
Ancestries in Lake Arrowhead
403 8.5% English339 7.2% American312 6.6% German270 5.7% European205 4.3% Afghan168 3.5% Ukrainian136 2.9% Irish122 2.6% Swedish80 1.7% Italian67 1.4% African56 1.2% Scottish53 1.1% Scandinavian49 1.0% Scotch-Irish48 1.0% French45 1.0% Norwegian40 0.8% Russian38 0.8% Slavic36 0.8% Swiss32 0.7% Dutch31 0.7% Croatian23 0.5% Hungarian19 0.4% Greek19 0.4% Polish16 0.3% Israeli13 0.3% French Canadian12 0.3% Danish12 0.3% Welsh11 0.2% British11 0.2% Romanian10 0.2% Bulgarian9 0.2% Nigerian8 0.2% Czech5 0.1% Canadian
Children Nativity (place of birth) in Lake Arrowhead
Children under 6 years - Living with two parents Both parents native 212 100.0% NativeBoth parents foreign-born 16 100.0% NativeChildren under 6 years - Living with one parent Native parent 63 100.0% NativeForeign-born parent 49 100.0% NativeChildren 6 to 17 years - Living with two parents Both parents native 528 100.0% NativeBoth parents foreign-born 181 100.0% NativeOne native, one foreign-born parent 67 100.0% NativeChildren 6 to 17 years - Living with one parent Native parent 350 100.0% NativeForeign-born parent 133 50.0% Native133 50.0% Foreign-born
Grandparents responsible for own grandchildren in Lake Arrowhead
Grandparents (30 to 59 years) White / Caucasian 9 40.1% Responsible for grandchildren14 59.9% Not responsible for grandchildrenWhite alone, not Hispanic / Latino 6 26.1% Responsible for grandchildren18 73.9% Not responsible for grandchildrenGrandparents (60 years and over) White / Caucasian 15 37.5% Responsible for grandchildren26 62.5% Not responsible for grandchildrenWhite alone, not Hispanic / Latino 17 39.6% Responsible for grandchildren25 60.4% Not responsible for grandchildren