Races in Lake Station, Indiana (IN) Detailed Stats
Ancestries, Foreign-born residents, place of birth
Settings
X


Recent posts about races in Lake Station, Indiana on our local forum with over 2,400,000 registered users:
 | Hammond housing prices (11 replies) |
| Moving to Lake Station? (5 replies) |
| Highland (155 replies) |
| How To Make Merrillville The Best It Can Be (50 replies) |
| Need help finding an apartment/house/townhouse/duplex in Highland or Schererville (1 reply) |
| Young family with 40k (16 replies) |
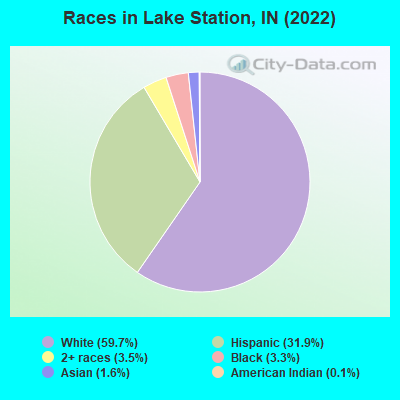
According to 2022 data, the most numerous races in Lake Station, IN are White alone (7,997 residents), Black alone (436 residents), and Hispanic (4,271 residents). 78.1% of Lake Station residents speak English at home. 8.2% of Lake Station, IN residents are foreign-born (5.4% born in Latin America, 1.5% born in Asia), which is 27.0% greater than the foreign-born rate of 6.0% across the entire state of Indiana.
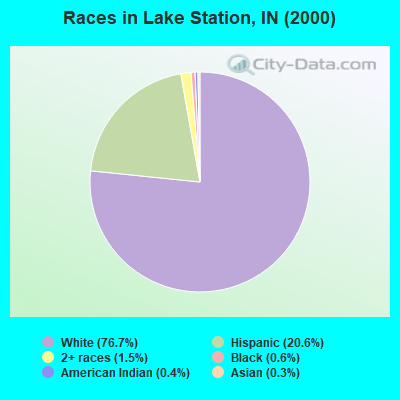
Race distribution in Lake Station
2000
2022

- 10,69576.7%White alone
- 2,87520.6%Hispanic
- 2031.5%Two or more races
- 820.6%Black alone
- 520.4%American Indian alone
- 380.3%Asian alone
- 20.01%Other race alone
- 10.01%Native Hawaiian and Other
Pacific Islander alone
-
- 7,99759.7%White alone
- 4,27131.9%Hispanic
- 4743.5%Two or more races
- 4363.3%Black alone
- 2181.6%Asian alone
- 160.1%American Indian alone
2000
2022
-
- 5,219,37385.8%White alone
- 505,4628.3%Black alone
- 214,5363.5%Hispanic
- 61,1151.0%Two or more races
- 58,4241.0%Asian alone
- 13,6540.2%American Indian alone
- 6,3480.1%Other race alone
- 1,5730.03%Native Hawaiian and Other
Pacific Islander alone

-
- 5,192,45576.0%White alone
- 628,0549.2%Black alone
- 534,5287.8%Hispanic
- 263,2423.9%Two or more races
- 172,8802.5%Asian alone
- 33,4670.5%Other race alone
- 5,8660.09%American Indian alone
- 2,5450.04%Native Hawaiian and Other
Pacific Islander alone

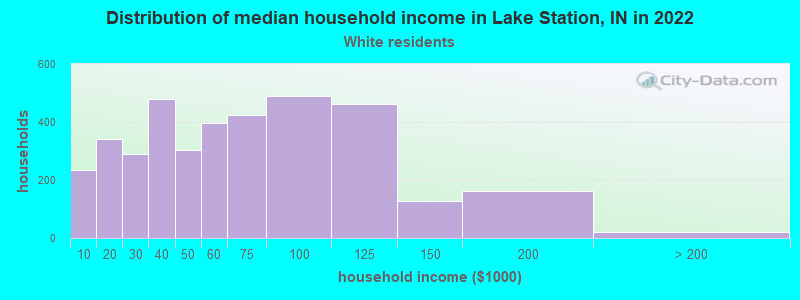
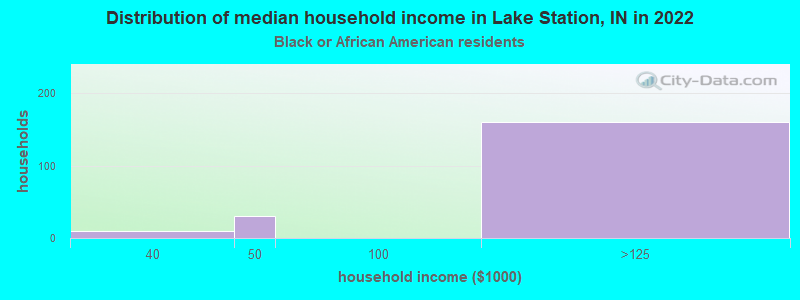
Income and house value in Lake Station
- Median household income in 2022
- $52,069White non-Hispanic householders
- $118,115Black householders
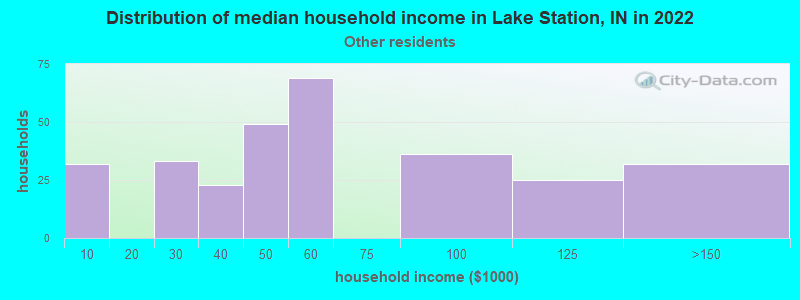
- $57,459Some other race householders
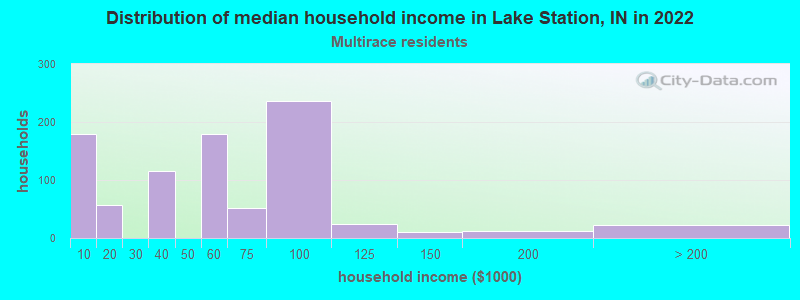
- $39,510Two or more races householders
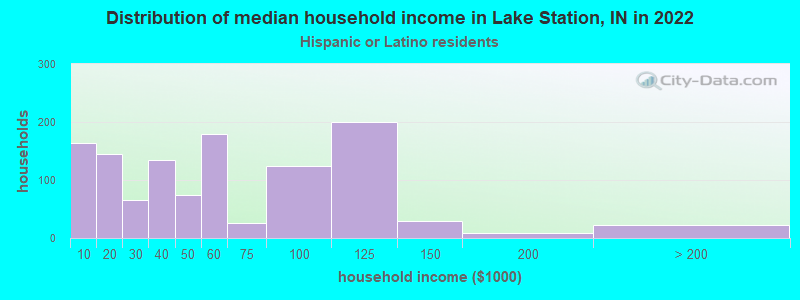
- $44,563Hispanic or Latino race householders
- Median 2022 house value
- $128,406White Non-Hispanic householders
- $166,419Black or African American householders
- $78,830American Indian or Alaska Native householders
- $303,409Asian householders
- $197,076Native Hawaiian and other Pacific Islander householders
- $142,070Some other race householders
- $114,216Two or more races householders
- $134,712Hispanic or Latino householders
Household income for White non-Hispanic householders
Household income for Black householders
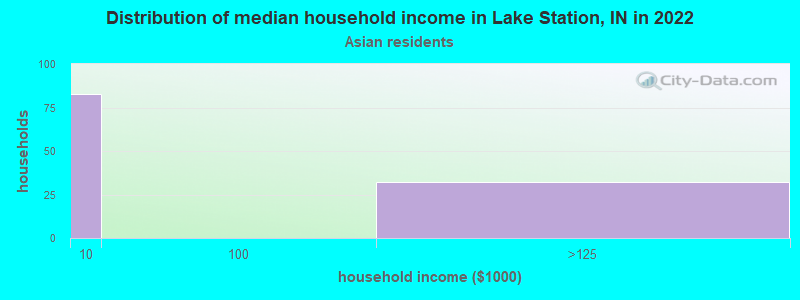
Household income for Asian householders
Household income for Some other race householders
Household income for Two or more races householders
Household income for Hispanic or Latino race householders
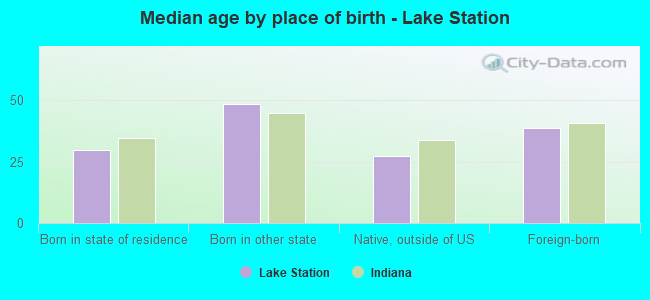
Median age by race in Lake Station
- 39.6Median age for White residents
- 41.4Males
- 38.0Females
- 28.0Median age for Black or African American residents
- 30.4Males
- 27.4Females
- 27.0Median age for American Indian / Alaska Native residents
- -531,041,069.2Males
- 31.2Females
- 25.4Median age for Asian residents
- 23.1Males
- -769,607,842.4Females
- -664,335,663.7Median age for Native Hawaiian / Pacific Islander residents
- -644,025,156.6Males
- -664,437,011.6Females
- 45.6Median age for Other race residents
- 48.3Males
- 35.2Females
- 22.2Median age for Two or more races residents
- 22.1Males
- 19.1Females
- 40.7Median age for White alone residents
- 44.1Males
- 38.7Females
- 26.3Median age for Hispanic or Latino residents
- 28.7Males
- 26.0Females
Owner/renter occupied households by race in Lake Station
- House owners and renters - White residents
- 2,53770.8%Owner occupied
- 1,04429.2%Renter occupied
- House owners and renters - Black or African American residents
- 9261.5%Owner occupied
- 5838.5%Renter occupied
- House owners and renters - Asian residents
- 2925.6%Owner occupied
- 8674.4%Renter occupied
- House owners and renters - Other race residents
- 21064.2%Owner occupied
- 11735.8%Renter occupied
- House owners and renters - Two or more races residents
- 53461.0%Owner occupied
- 34239.0%Renter occupied
- House owners and renters - White alone residents
- 2,34370.6%Owner occupied
- 97429.4%Renter occupied
- House owners and renters - Hispanic or Latino residents
- 76863.3%Owner occupied
- 44536.7%Renter occupied
Language usage in Lake Station
- English speakers - Total
- 78.1% of residents of Lake Station speak English at home.
- 18.7% of residents speak Spanish at home
- 1,86378.7%Speak English very well
- 50321.3%Speak English less than very well
- 3.8% of residents speak other language at home
- 24150.0%Speak English very well
- 24150.0%Speak English less than very well
- English speakers - Born in the United States
- 83.6% of residents of Lake Station speak English at home.
- 15.6% of residents speak Spanish at home
- 43292.1%Speak English very well
- 377.9%Speak English less than very well
- 1.0% of residents speak other language at home
- 31100.0%Speak English very well
- English speakers - Native, born elsewhere
- 53.5% of residents of Lake Station speak English at home.
- 44.9% of residents speak Spanish at home
- 10293.6%Speak English very well
- 76.4%Speak English less than very well
- English speakers - Foreign-born
- 8.2% of residents of Lake Station speak English at home.
- 64.6% of residents speak Spanish at home
- 34750.9%Speak English very well
- 33549.1%Speak English less than very well
- 26.6% of residents speak other language at home
- 6322.4%Speak English very well
- 21877.6%Speak English less than very well
White (Caucasian) - Speak only English
| Native: | 93.8% (7,746) |
| Foreign-born: | 19.0% (34) |
White (Caucasian) - Speak another language
| Native: | 6.1% (506) |
| Foreign-born: | 80.7% (145) |
Other race - Speak only English
| Native: | 43.0% (342) |
| Foreign-born: | 14.1% (37) |
Other race - Speak another language
| Native: | 54.7% (435) |
| Foreign-born: | 86.7% (229) |
Two or more races - Speak another language
| Native: | 54.6% (1,215) |
| Foreign-born: | 100.0% (581) |
White alone - Speak only English
| Native: | 96.6% (7,340) |
| Foreign-born: | 47.4% (33) |
White alone - Speak another language
| Native: | 3.2% (244) |
| Foreign-born: | 30.5% (21) |
Hispanic or Latino - Speak only English
| Native: | 49.3% (1,540) |
| Foreign-born: | 4.7% (34) |
Hispanic or Latino - Speak another language
| Native: | 51.4% (1,607) |
| Foreign-born: | 95.3% (688) |
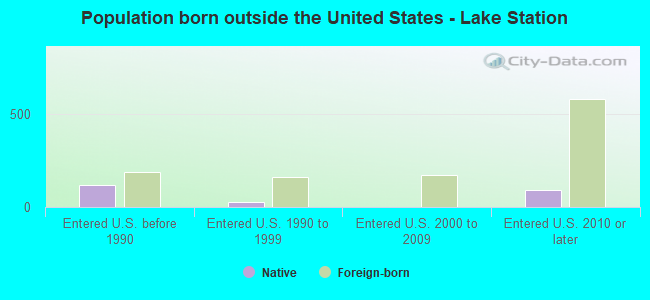
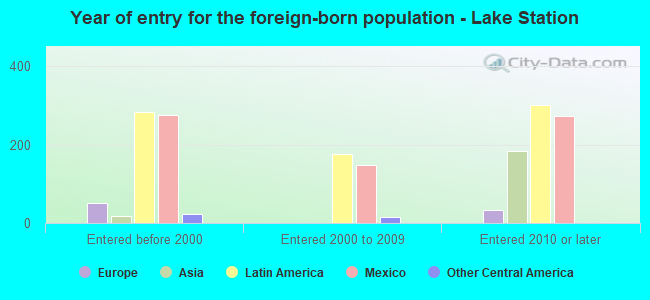
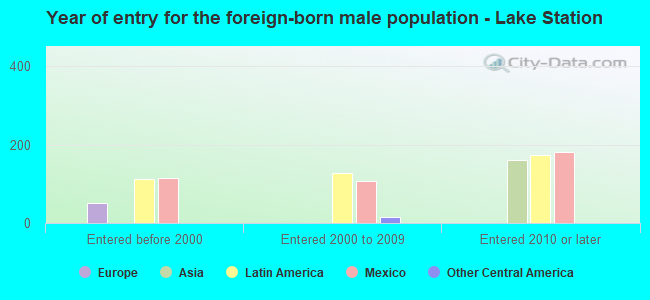
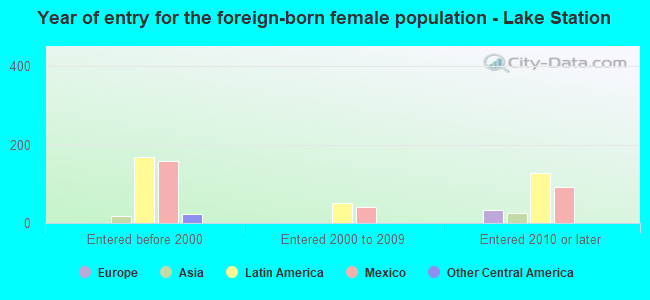
Foreign-born residents in Lake Station
1,102 residents are foreign born (5.4% Latin America, 1.5% Asia).
| This city: | 8.2% |
| Indiana: | 5.6% |

Marital status for residents in Lake Station
Marital status - White (Caucasian) population 15 years and over
- Males
- 43.9%Never married
- 35.5%Now married
- 0.2%Separated
- 2.6%Widowed
- 17.8%Divorced
- Females
- 35.1%Never married
- 40.0%Now married
- 1.9%Separated
- 7.3%Widowed
- 15.8%Divorced
Women who gave birth in the past 12 months
| Now married: | 15.9% (19) |
| Unmarried: | 84.1% (99) |
Women who did not give birth in the past 12 months
| Now married: | 35.5% (670) |
| Unmarried: | 64.5% (1,217) |
Marital status - Black or African American population 15 years and over
- Males
- 43.5%Never married
- 50.0%Now married
- 0.0%Separated
- 3.2%Widowed
- 3.2%Divorced
- Females
- 61.4%Never married
- 11.8%Now married
- 8.7%Separated
- 6.3%Widowed
- 11.8%Divorced
Women who did not give birth in the past 12 months
| Now married: | 17.0% (15) |
| Unmarried: | 83.0% (74) |
Marital status - American Indian / Alaska Native population 15 years and over
- Males
- 100.0%Never married
- 0.0%Now married
- 0.0%Separated
- 0.0%Widowed
- 0.0%Divorced
- Females
- 45.0%Never married
- 55.0%Now married
- 0.0%Separated
- 0.0%Widowed
- 0.0%Divorced
Women who did not give birth in the past 12 months
| Now married: | 47.1% (38) |
| Unmarried: | 52.9% (42) |
Marital status - Asian population 15 years and over
- Males
- 85.1%Never married
- 14.9%Now married
- 0.0%Separated
- 0.0%Widowed
- 0.0%Divorced
- Females
- 0.0%Never married
- 100.0%Now married
- 0.0%Separated
- 0.0%Widowed
- 0.0%Divorced
Marital status - Other race population 15 years and over
- Males
- 30.2%Never married
- 40.1%Now married
- 7.1%Separated
- 3.4%Widowed
- 19.2%Divorced
- Females
- 22.0%Never married
- 30.0%Now married
- 0.0%Separated
- 31.6%Widowed
- 16.5%Divorced
Women who did not give birth in the past 12 months
| Now married: | 38.4% (99) |
| Unmarried: | 61.6% (158) |
Marital status - Two or more races population 15 years and over
- Males
- 50.4%Never married
- 39.2%Now married
- 3.0%Separated
- 0.0%Widowed
- 7.4%Divorced
- Females
- 42.4%Never married
- 26.4%Now married
- 3.5%Separated
- 5.0%Widowed
- 22.6%Divorced
Women who gave birth in the past 12 months
| Now married: | 100.0% (65) |
| Unmarried: | 0.0% (0) |
Women who did not give birth in the past 12 months
| Now married: | 15.1% (105) |
| Unmarried: | 84.9% (588) |
Marital status - White alone, not Hispanic / Latino population 15 years and over
- Males
- 43.6%Never married
- 35.0%Now married
- 0.3%Separated
- 2.9%Widowed
- 18.2%Divorced
- Females
- 34.4%Never married
- 37.2%Now married
- 2.2%Separated
- 8.5%Widowed
- 17.8%Divorced
Women who gave birth in the past 12 months
| Now married: | 3.2% (3) |
| Unmarried: | 96.8% (87) |
Women who did not give birth in the past 12 months
| Now married: | 30.8% (502) |
| Unmarried: | 69.2% (1,128) |
Marital status - Hispanic or Latino population 15 years and over
- Males
- 44.5%Never married
- 37.3%Now married
- 3.7%Separated
- 1.1%Widowed
- 13.3%Divorced
- Females
- 39.3%Never married
- 36.4%Now married
- 1.6%Separated
- 8.6%Widowed
- 14.0%Divorced
Women who gave birth in the past 12 months
| Now married: | 73.8% (47) |
| Unmarried: | 26.2% (17) |
Women who did not give birth in the past 12 months
| Now married: | 35.5% (402) |
| Unmarried: | 64.5% (732) |
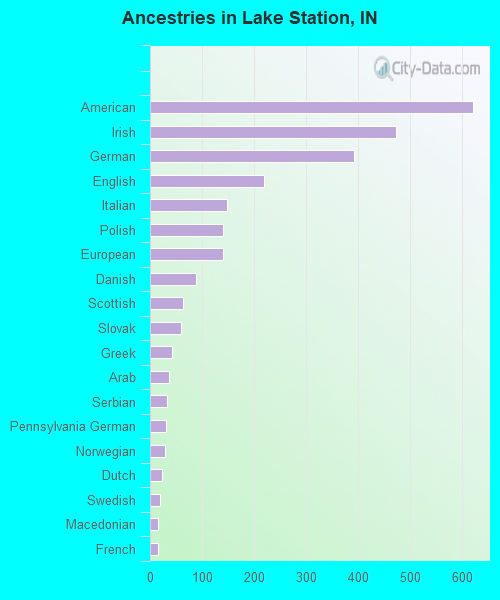
Ancestries in Lake Station

- 62010.9%American
- 4728.3%Irish
- 3926.9%German
- 2193.9%English
- 1482.6%Italian
- 1412.5%Polish
- 1402.5%European
- 891.6%Danish
- 641.1%Scottish
- 601.1%Slovak
- 430.8%Greek
- 360.6%Arab
- 320.6%Serbian
- 300.5%Pennsylvania German
- 280.5%Norwegian
- 240.4%Dutch
- 200.4%Swedish
- 160.3%Macedonian
- 150.3%French
- 40.07%Swiss
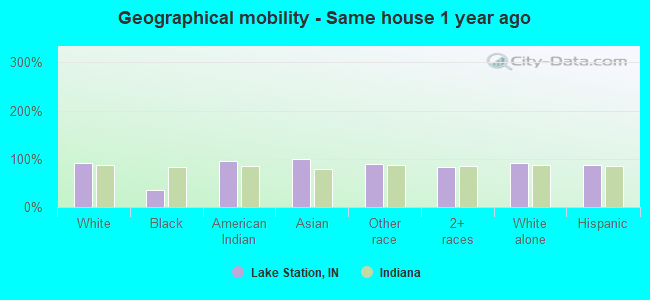
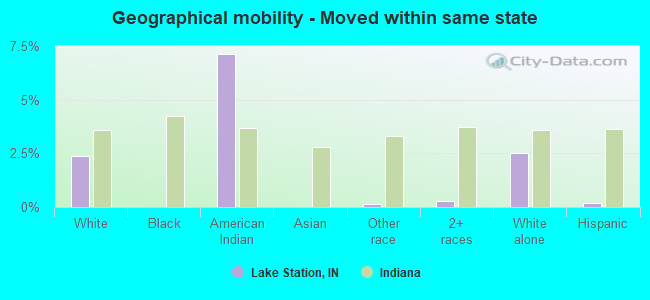
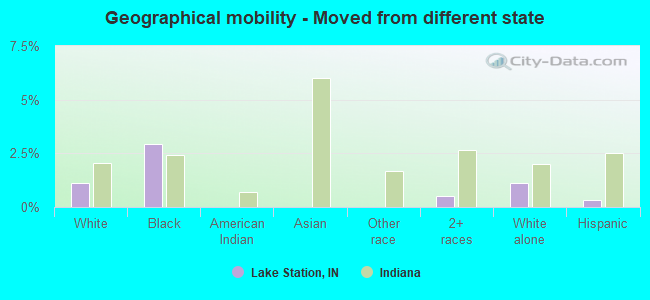
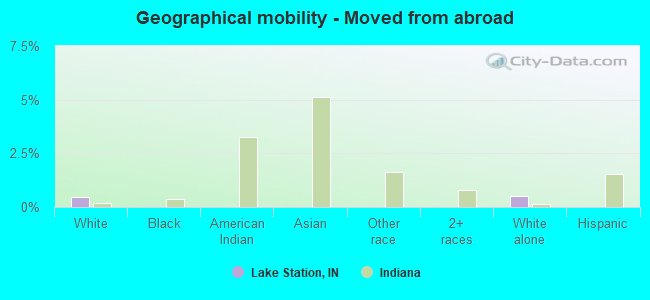
Geographical mobility in Lake Station

- Same house 1 year ago
- 7,86890.7%White (Caucasian)
- 16734.8%Black or African American
- 8696.2%American Indian / Alaska Native
- 21699.5%Asian
- 99089.5%Other race
- 2,64784.0%Two or more races
- 7,26691.4%White alone, not Hispanic / Latino
- 3,68587.8%Hispanic or Latino
-
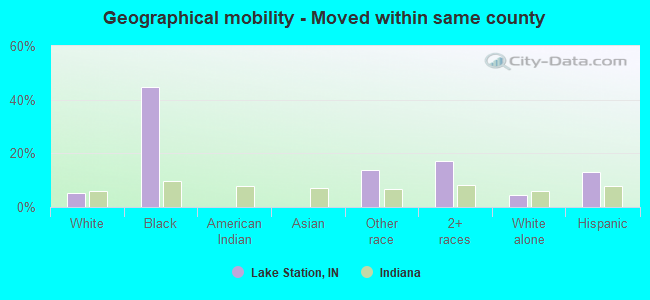
- Moved within same county
- 4665.4%White / Caucasian
- 21544.9%Black or African American
- 15113.6%Other race
- 54417.3%Two or more races
- 3564.5%White alone, not Hispanic / Latino
- 54212.9%Hispanic or Latino
-
- Moved within same state
- 2052.4%White / Caucasian
- 67.1%American Indian / Alaska Native
- 20.1%Other race
- 80.3%Two or more races
- 2002.5%White alone, not Hispanic / Latino
- 70.2%Hispanic or Latino
-
- Moved from different state
- 981.1%White / Caucasian
- 143.0%Black or African American
- 160.5%Two or more races
- 911.1%White alone, not Hispanic / Latino
- 130.3%Hispanic or Latino
-
- Moved from abroad
- 410.5%White
- 410.5%White alone, not Hispanic / Latino
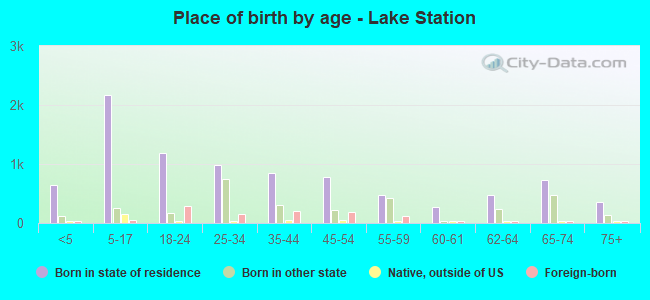
Children Nativity (place of birth) in Lake Station
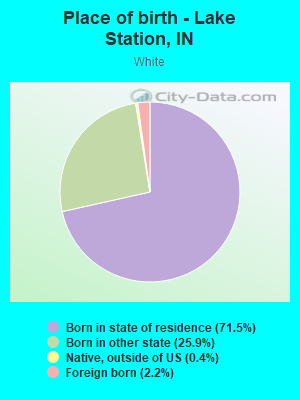
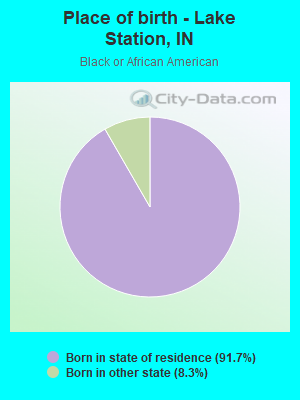
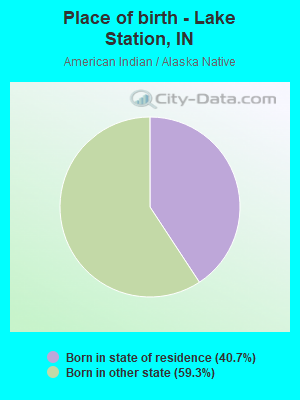
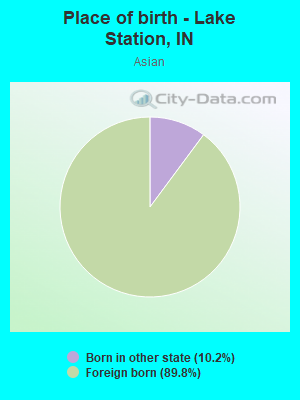
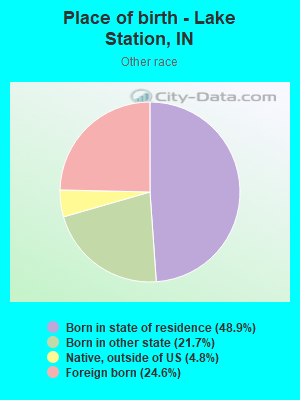
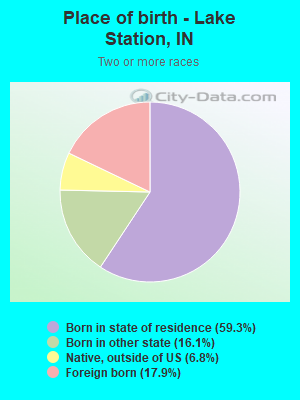
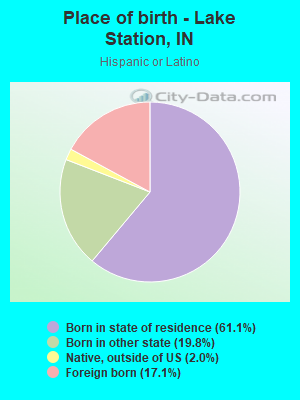
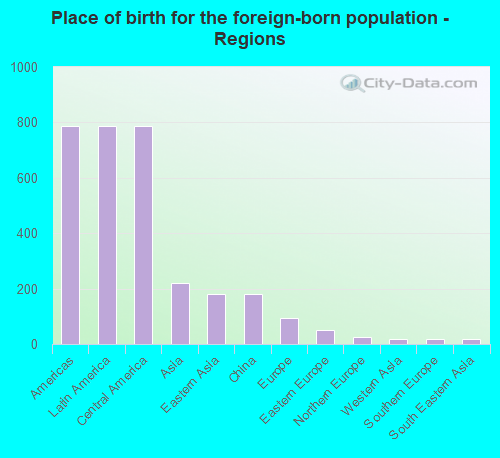
Place of birth for residents in Lake Station
![Place of birth for the foreign-born population - Regions]()
- 787Americas
- 787Latin America
- 787Central America
- 219Asia
- 180Eastern Asia
- 180China
- 95Europe
- 51Eastern Europe
- 25Northern Europe
- 19Western Asia
- 18Southern Europe
- 18South Eastern Asia
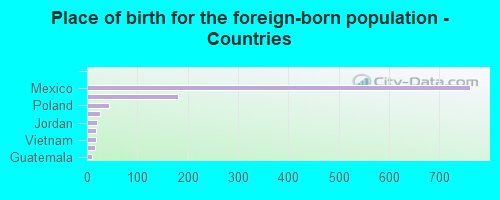
![Place of birth for the foreign-born population - Countries]()
- 761Mexico
- 180China
- 44Poland
- 25England
- 19Jordan
- 18Greece
- 18Vietnam
- 15Honduras
- 10Guatemala
- 6Hungary
Grandparents responsible for own grandchildren in Lake Station
Zip codes: 46405.