Races in Lakeland South, Washington (WA) Detailed Stats
Data:
Races - White alone (%)
Races - White alone (% change since 2000)
Races - Black alone (%)
Races - Black alone (% change since 2000)
Races - American Indian alone (%)
Races - American Indian alone (% change since 2000)
Races - Asian alone (%)
Races - Asian alone (% change since 2000)
Races - Hispanic (%)
Races - Hispanic (% change since 2000)
Races - Native Hawaiian and Other Pacific Islander alone (%)
Races - Native Hawaiian and Other Pacific Islander alone (% change since 2000)
Races - Two or more races(%)
Races - Two or more races(% change since 2000)
Races - Other race alone (%)
Races - Other race alone (% change since 2000)
Racial diversity
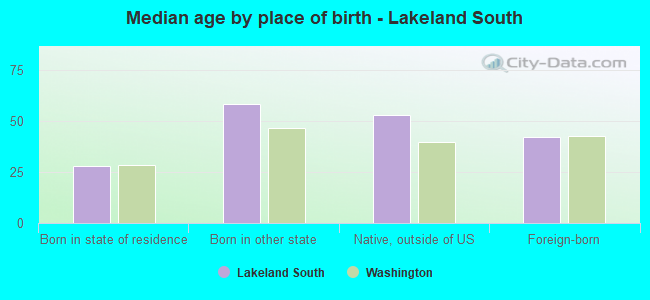
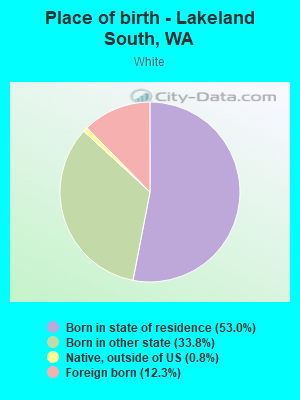
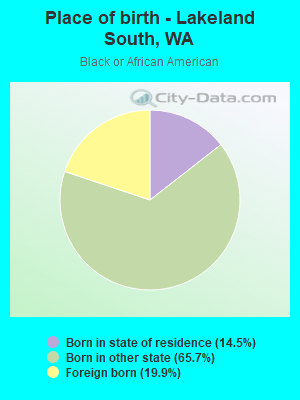
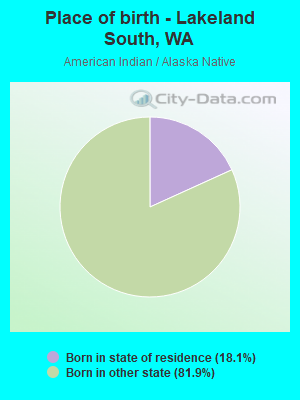
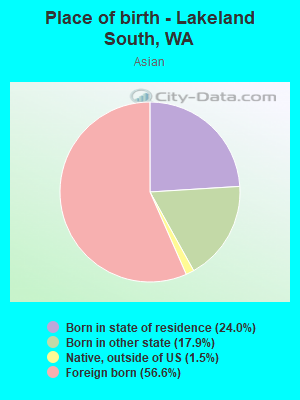
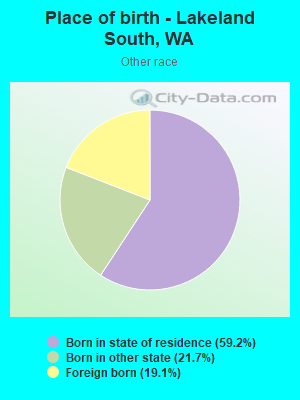
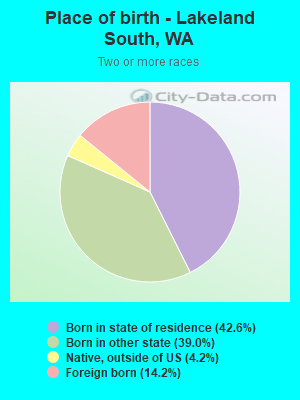
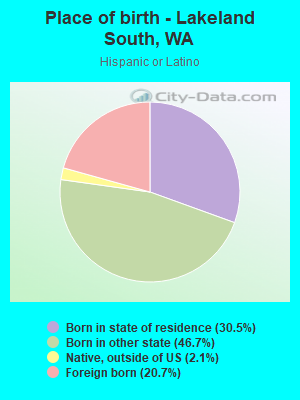
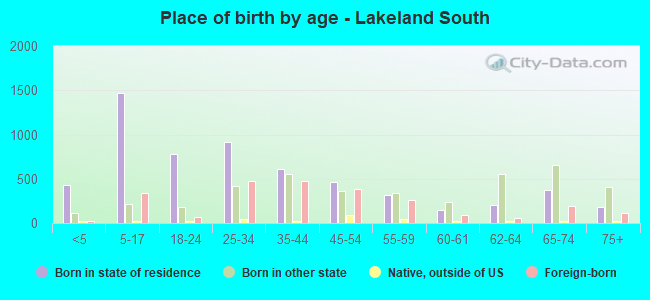
Place of birth - Born in state of residence (%)
Place of birth - Born in state of residence (%) - White
Place of birth - Born in state of residence (%) - Black or African American
Place of birth - Born in state of residence (%) - Asian
Place of birth - Born in state of residence (%) - Hispanic or Latino
Place of birth - Born in state of residence (%) - American Indian and Alaska Native
Place of birth - Born in state of residence (%) - Multirace
Place of birth - Born in state of residence (%) - Other Race
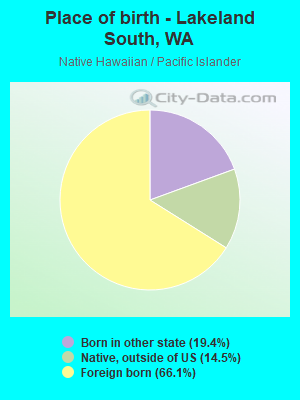
Place of birth - Born in other state (%)
Place of birth - Born in other state (%) - White
Place of birth - Born in other state (%) - Black or African American
Place of birth - Born in other state (%) - Asian
Place of birth - Born in other state (%) - Hispanic or Latino
Place of birth - Born in other state (%) - American Indian and Alaska Native
Place of birth - Born in other state (%) - Multirace
Place of birth - Born in other state (%) - Other Race
Place of birth - Native, outside of US (%)
Place of birth - Native, outside of US (%) - White
Place of birth - Native, outside of US (%) - Black or African American
Place of birth - Native, outside of US (%) - Asian
Place of birth - Native, outside of US (%) - Hispanic or Latino
Place of birth - Native, outside of US (%) - American Indian and Alaska Native
Place of birth - Native, outside of US (%) - Multirace
Place of birth - Native, outside of US (%) - Other Race
Place of birth - Foreign born (%)
Place of birth - Foreign born (%) - White
Place of birth - Foreign born (%) - Black or African American
Place of birth - Foreign born (%) - Asian
Place of birth - Foreign born (%) - Hispanic or Latino
Place of birth - Foreign born (%) - American Indian and Alaska Native
Place of birth - Foreign born (%) - Multirace
Place of birth - Foreign born (%) - Other Race
Residents speaking English at home (%)
Residents speaking English at home - Born in the United States (%)
Residents speaking English at home - Native, born elsewhere (%)
Residents speaking English at home - Foreign born (%)
Residents speaking Spanish at home (%)
Residents speaking Spanish at home - Born in the United States (%)
Residents speaking Spanish at home - Native, born elsewhere (%)
Residents speaking Spanish at home - Foreign born (%)
Residents speaking other language at home (%)
Residents speaking other language at home - Born in the United States (%)
Residents speaking other language at home - Native, born elsewhere (%)
Residents speaking other language at home - Foreign born (%)
Marital status - Never married (%)
Marital status - Now married (%)
Marital status - Separated (%)
Marital status - Widowed (%)
Marital status - Divorced (%)
Ancestries Reported - Arab (%)
Ancestries Reported - Czech (%)
Ancestries Reported - Danish (%)
Ancestries Reported - Dutch (%)
Ancestries Reported - English (%)
Ancestries Reported - French (%)
Ancestries Reported - French Canadian (%)
Ancestries Reported - German (%)
Ancestries Reported - Greek (%)
Ancestries Reported - Hungarian (%)
Ancestries Reported - Irish (%)
Ancestries Reported - Italian (%)
Ancestries Reported - Lithuanian (%)
Ancestries Reported - Norwegian (%)
Ancestries Reported - Polish (%)
Ancestries Reported - Portuguese (%)
Ancestries Reported - Russian (%)
Ancestries Reported - Scotch-Irish (%)
Ancestries Reported - Scottish (%)
Ancestries Reported - Slovak (%)
Ancestries Reported - Subsaharan African (%)
Ancestries Reported - Swedish (%)
Ancestries Reported - Swiss (%)
Ancestries Reported - Ukrainian (%)
Ancestries Reported - United States (%)
Ancestries Reported - Welsh (%)
Ancestries Reported - West Indian (%)
Ancestries Reported - Other (%)
Geographical mobility - Same house 1 year ago (%)
Geographical mobility - Same house 1 year ago (%) - White
Geographical mobility - Same house 1 year ago (%) - Black or African American
Geographical mobility - Same house 1 year ago (%) - Asian
Geographical mobility - Same house 1 year ago (%) - Hispanic or Latino
Geographical mobility - Same house 1 year ago (%) - American Indian and Alaska Native
Geographical mobility - Same house 1 year ago (%) - Multirace
Geographical mobility - Same house 1 year ago (%) - Other Race
Geographical mobility - Moved within same county (%)
Geographical mobility - Moved within same county (%) - White
Geographical mobility - Moved within same county (%) - Black or African American
Geographical mobility - Moved within same county (%) - Asian
Geographical mobility - Moved within same county (%) - Hispanic or Latino
Geographical mobility - Moved within same county (%) - American Indian and Alaska Native
Geographical mobility - Moved within same county (%) - Multirace
Geographical mobility - Moved within same county (%) - Other Race
Geographical mobility - Moved from different county within same state (%)
Geographical mobility - Moved from different county within same state (%) - White
Geographical mobility - Moved from different county within same state (%) - Black or African American
Geographical mobility - Moved from different county within same state (%) - Asian
Geographical mobility - Moved from different county within same state (%) - Hispanic or Latino
Geographical mobility - Moved from different county within same state (%) - American Indian and Alaska Native
Geographical mobility - Moved from different county within same state (%) - Multirace
Geographical mobility - Moved from different county within same state (%) - Other Race
Geographical mobility - Moved from different state (%)
Geographical mobility - Moved from different state (%) - White
Geographical mobility - Moved from different state (%) - Black or African American
Geographical mobility - Moved from different state (%) - Asian
Geographical mobility - Moved from different state (%) - Hispanic or Latino
Geographical mobility - Moved from different state (%) - American Indian and Alaska Native
Geographical mobility - Moved from different state (%) - Multirace
Geographical mobility - Moved from different state (%) - Other Race
Geographical mobility - Moved from abroad (%)
Geographical mobility - Moved from abroad (%) - White
Geographical mobility - Moved from abroad (%) - Black or African American
Geographical mobility - Moved from abroad (%) - Asian
Geographical mobility - Moved from abroad (%) - Hispanic or Latino
Geographical mobility - Moved from abroad (%) - American Indian and Alaska Native
Geographical mobility - Moved from abroad (%) - Multirace
Geographical mobility - Moved from abroad (%) - Other Race
Place of birth for the foreign-born population - Ireland (%)
Place of birth for the foreign-born population - Denmark (%)
Place of birth for the foreign-born population - Norway (%)
Place of birth for the foreign-born population - Sweden (%)
Place of birth for the foreign-born population - United Kingdom (%)
Place of birth for the foreign-born population - England (%)
Place of birth for the foreign-born population - Scotland (%)
Place of birth for the foreign-born population - Other Northern Europe (%)
Place of birth for the foreign-born population - Austria (%)
Place of birth for the foreign-born population - Belgium (%)
Place of birth for the foreign-born population - France (%)
Place of birth for the foreign-born population - Germany (%)
Place of birth for the foreign-born population - Netherlands (%)
Place of birth for the foreign-born population - Switzerland (%)
Place of birth for the foreign-born population - Other Western Europe (%)
Place of birth for the foreign-born population - Greece (%)
Place of birth for the foreign-born population - Italy (%)
Place of birth for the foreign-born population - Portugal (%)
Place of birth for the foreign-born population - Spain (%)
Place of birth for the foreign-born population - Other Southern Europe (%)
Place of birth for the foreign-born population - Albania (%)
Place of birth for the foreign-born population - Belarus (%)
Place of birth for the foreign-born population - Bosnia and Herzegovina (%)
Place of birth for the foreign-born population - Bulgaria (%)
Place of birth for the foreign-born population - Croatia (%)
Place of birth for the foreign-born population - Czechoslovakia (%)
Place of birth for the foreign-born population - Hungary (%)
Place of birth for the foreign-born population - Latvia (%)
Place of birth for the foreign-born population - Lithuania (%)
Place of birth for the foreign-born population - North Macedonia (Macedonia) (%)
Place of birth for the foreign-born population - Moldova (%)
Place of birth for the foreign-born population - Poland (%)
Place of birth for the foreign-born population - Romania (%)
Place of birth for the foreign-born population - Russia (%)
Place of birth for the foreign-born population - Serbia (%)
Place of birth for the foreign-born population - Ukraine (%)
Place of birth for the foreign-born population - Other Eastern Europe (%)
Place of birth for the foreign-born population - China (%)
Place of birth for the foreign-born population - Hong Kong (%)
Place of birth for the foreign-born population - Taiwan (%)
Place of birth for the foreign-born population - Japan (%)
Place of birth for the foreign-born population - Korea (%)
Place of birth for the foreign-born population - Other Eastern Asia (%)
Place of birth for the foreign-born population - Afghanistan (%)
Place of birth for the foreign-born population - Bangladesh (%)
Place of birth for the foreign-born population - India (%)
Place of birth for the foreign-born population - Iran (%)
Place of birth for the foreign-born population - Kazakhstan (%)
Place of birth for the foreign-born population - Nepal (%)
Place of birth for the foreign-born population - Pakistan (%)
Place of birth for the foreign-born population - Sri Lanka (%)
Place of birth for the foreign-born population - Uzbekistan (%)
Place of birth for the foreign-born population - Other South Central Asia (%)
Place of birth for the foreign-born population - Burma (%)
Place of birth for the foreign-born population - Cambodia (%)
Place of birth for the foreign-born population - Indonesia (%)
Place of birth for the foreign-born population - Laos (%)
Place of birth for the foreign-born population - Malaysia (%)
Place of birth for the foreign-born population - Philippines (%)
Place of birth for the foreign-born population - Singapore (%)
Place of birth for the foreign-born population - Thailand (%)
Place of birth for the foreign-born population - Vietnam (%)
Place of birth for the foreign-born population - Other South Eastern Asia (%)
Place of birth for the foreign-born population - Armenia (%)
Place of birth for the foreign-born population - Iraq (%)
Place of birth for the foreign-born population - Israel (%)
Place of birth for the foreign-born population - Jordan (%)
Place of birth for the foreign-born population - Kuwait (%)
Place of birth for the foreign-born population - Lebanon (%)
Place of birth for the foreign-born population - Saudi Arabia (%)
Place of birth for the foreign-born population - Syria (%)
Place of birth for the foreign-born population - Turkey (%)
Place of birth for the foreign-born population - Yemen (%)
Place of birth for the foreign-born population - Other Western Asia (%)
Place of birth for the foreign-born population - Eritrea (%)
Place of birth for the foreign-born population - Ethiopia (%)
Place of birth for the foreign-born population - Kenya (%)
Place of birth for the foreign-born population - Somalia (%)
Place of birth for the foreign-born population - Uganda (%)
Place of birth for the foreign-born population - Zimbabwe (%)
Place of birth for the foreign-born population - Other Eastern Africa (%)
Place of birth for the foreign-born population - Cameroon (%)
Place of birth for the foreign-born population - Congo (%)
Place of birth for the foreign-born population - Democratic Republic of Congo (Zaire) (%)
Place of birth for the foreign-born population - Other Middle Africa (%)
Place of birth for the foreign-born population - Egypt (%)
Place of birth for the foreign-born population - Morocco (%)
Place of birth for the foreign-born population - Sudan (%)
Place of birth for the foreign-born population - Other Northern Africa (%)
Place of birth for the foreign-born population - South Africa (%)
Place of birth for the foreign-born population - Other Southern Africa (%)
Place of birth for the foreign-born population - Cabo Verde (%)
Place of birth for the foreign-born population - Ghana (%)
Place of birth for the foreign-born population - Liberia (%)
Place of birth for the foreign-born population - Nigeria (%)
Place of birth for the foreign-born population - Senegal (%)
Place of birth for the foreign-born population - Sierra Leone (%)
Place of birth for the foreign-born population - Other Western Africa (%)
Place of birth for the foreign-born population - Australia (%)
Place of birth for the foreign-born population - New Zealand (%)
Place of birth for the foreign-born population - Fiji (%)
Place of birth for the foreign-born population - Micronesia (%)
Place of birth for the foreign-born population - Bahamas (%)
Place of birth for the foreign-born population - Barbados (%)
Place of birth for the foreign-born population - Cuba (%)
Place of birth for the foreign-born population - Dominica (%)
Place of birth for the foreign-born population - Dominican Republic (%)
Place of birth for the foreign-born population - Grenada (%)
Place of birth for the foreign-born population - Haiti (%)
Place of birth for the foreign-born population - Jamaica (%)
Place of birth for the foreign-born population - St. Vincent and the Grenadines (%)
Place of birth for the foreign-born population - Trinidad and Tobago (%)
Place of birth for the foreign-born population - West Indies (%)
Place of birth for the foreign-born population - Other Caribbean (%)
Place of birth for the foreign-born population - Belize (%)
Place of birth for the foreign-born population - Costa Rica (%)
Place of birth for the foreign-born population - El Salvador (%)
Place of birth for the foreign-born population - Guatemala (%)
Place of birth for the foreign-born population - Honduras (%)
Place of birth for the foreign-born population - Mexico (%)
Place of birth for the foreign-born population - Nicaragua (%)
Place of birth for the foreign-born population - Panama (%)
Place of birth for the foreign-born population - Other Central America (%)
Place of birth for the foreign-born population - Argentina (%)
Place of birth for the foreign-born population - Bolivia (%)
Place of birth for the foreign-born population - Brazil (%)
Place of birth for the foreign-born population - Chile (%)
Place of birth for the foreign-born population - Colombia (%)
Place of birth for the foreign-born population - Ecuador (%)
Place of birth for the foreign-born population - Guyana (%)
Place of birth for the foreign-born population - Peru (%)
Place of birth for the foreign-born population - Uruguay (%)
Place of birth for the foreign-born population - Venezuela (%)
Place of birth for the foreign-born population - Other South America (%)
Place of birth for the foreign-born population - Canada (%)
Place of birth for the foreign-born population - Other Northern America (%)
Place of birth for the foreign-born population - Other (%)
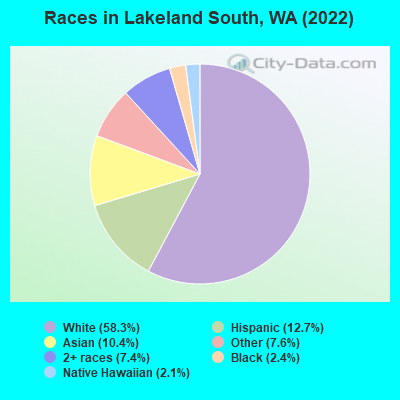
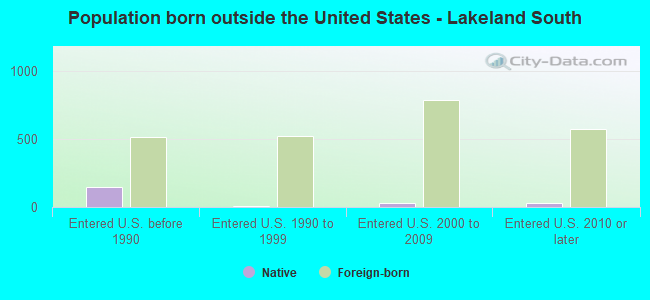
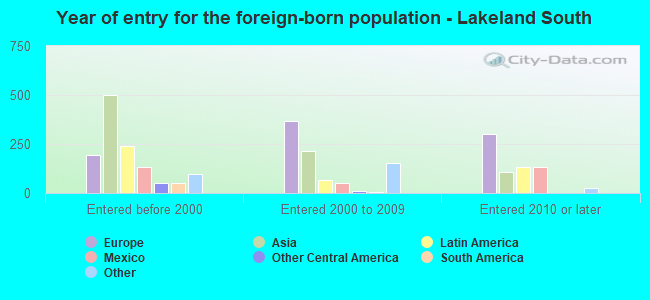
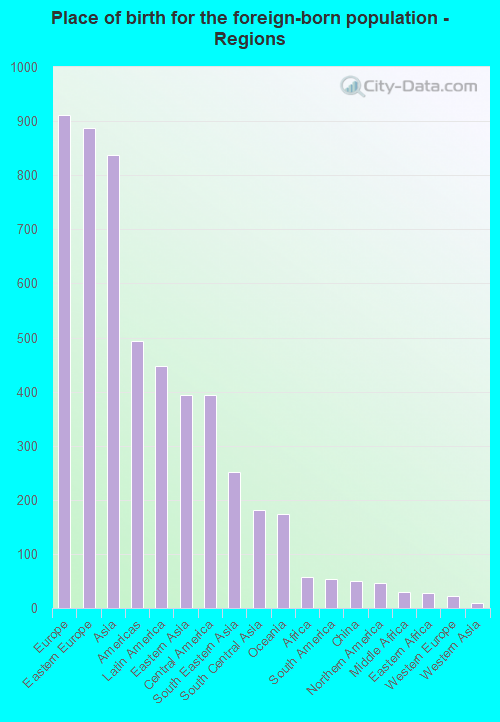
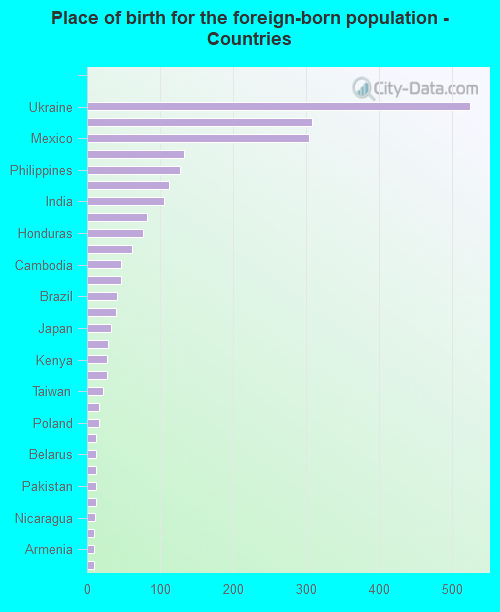
According to 2022 data, the most numerous races in Lakeland South, WA are White alone (7,386 residents), Hispanic (1,606 residents), and Asian alone (1,316 residents). 74.0% of Lakeland South residents speak English at home. 19.5% of Lakeland South, WA residents are foreign-born (6.9% born in Europe, 6.3% born in Asia, 3.4% born in Latin America), which is 23.2% greater than the foreign-born rate of 15.0% across the entire state of Washington.
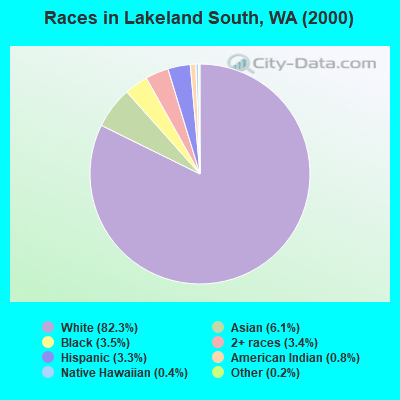
Race distribution in Lakeland South
2000 2022
4,652,490 78.9% White alone 441,509 7.5% Hispanic 319,401 5.4% Asian alone 184,631 3.1% Black alone 175,926 3.0% Two or more races 85,396 1.4% American Indian alone 22,779 0.4% Native Hawaiian and Other 11,989 0.2% Other race alone
4,941,456 63.5% White alone 1,093,313 14.0% Hispanic 755,832 9.7% Asian alone 523,448 6.7% Two or more races 299,537 3.8% Black alone 69,024 0.9% American Indian alone 52,231 0.7% Native Hawaiian and Other 50,945 0.7% Other race alone
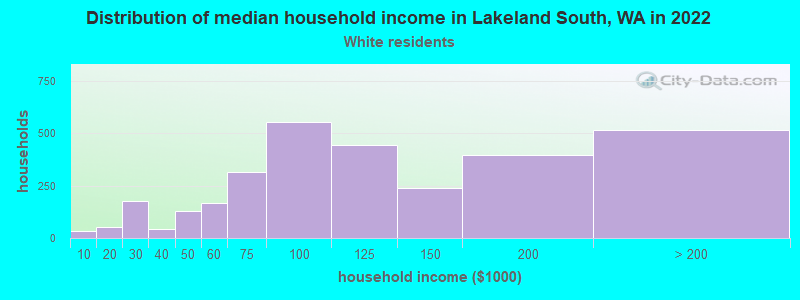
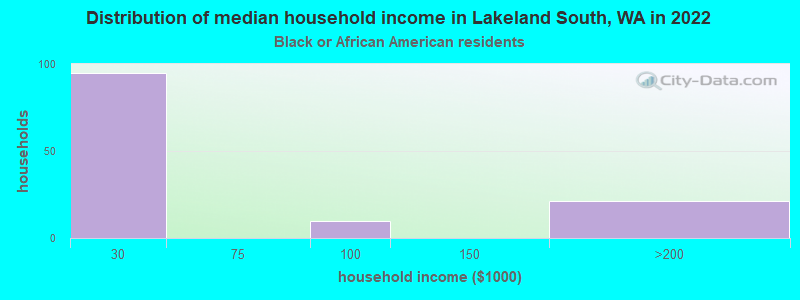
Income and house value in Lakeland South Median household income in 2022 $102,023 White non-Hispanic householders$29,747 Black householdersover $200,000 American Indian and Alaska Native householders$121,928 Asian householders$140,501 Some other race householders$117,079 Hispanic or Latino race householdersMedian 2022 house value $544,575 White Non-Hispanic householders$568,955 Black or African American householders$844,409 American Indian or Alaska Native householders $633,227 Asian householders$642,093 Two or more races householders$814,014 Hispanic or Latino householders
Median age by race in Lakeland South
45.9 Median age for White residents45.8 47.2 44.5 Median age for Black or African American residents31.9 62.5 31.3 Median age for American Indian / Alaska Native residents-658,092,175.1 -631,249,999.4 46.6 Median age for Asian residents34.0 50.5 41.4 Median age for Native Hawaiian / Pacific Islander residents32.3 41.5 21.5 Median age for Other race residents18.3 23.9 29.2 Median age for Two or more races residents30.2 28.3 46.2 Median age for White alone residents45.6 48.1 27.5 Median age for Hispanic or Latino residents27.6 27.4
Owner/renter occupied households by race in Lakeland South
House owners and renters - White residents 2,610 84.0% Owner occupied499 16.0% Renter occupiedHouse owners and renters - Black or African American residents 29 21.9% Owner occupied104 78.1% Renter occupiedHouse owners and renters - American Indian / Alaska Native residents 14 100.0% Owner occupiedHouse owners and renters - Asian residents 402 76.5% Owner occupied123 23.5% Renter occupiedHouse owners and renters - Native Hawaiian / Pacific Islander residents 18 100.0% Owner occupiedHouse owners and renters - Other race residents 180 100.0% Owner occupiedHouse owners and renters - Two or more races residents 369 64.4% Owner occupied204 35.6% Renter occupiedHouse owners and renters - White alone residents 2,599 85.9% Owner occupied426 14.1% Renter occupiedHouse owners and renters - Hispanic or Latino residents 276 66.3% Owner occupied140 33.7% Renter occupied
Language usage in Lakeland South
English speakers - Total 74.0% of residents of Lakeland South speak English at home.
6.4% of residents speak Spanish at home 552 71.0% Speak English very well226 29.0% Speak English less than very well19.0% of residents speak other language at home 1,316 57.1% Speak English very well988 42.9% Speak English less than very well
English speakers - Born in the United States 87.9% of residents of Lakeland South speak English at home.
8.6% of residents speak Spanish at home 313 93.4% Speak English very well22 6.6% Speak English less than very well3.8% of residents speak other language at home 149 100.0% Speak English very well
English speakers - Native, born elsewhere 66.7% of residents of Lakeland South speak English at home.
6.7% of residents speak Spanish at home 14 100.0% Speak English very well25.7% of residents speak other language at home 37 68.5% Speak English very well17 31.5% Speak English less than very well
English speakers - Foreign-born 14.3% of residents of Lakeland South speak English at home.
12.6% of residents speak Spanish at home 113 36.2% Speak English very well199 63.8% Speak English less than very well72.7% of residents speak other language at home 872 48.5% Speak English very well925 51.5% Speak English less than very well
White (Caucasian) - Speak only English Native:
95.8% (5,998)Foreign-born:
17.5% (160)
White (Caucasian) - Speak another language Native:
4.2% (264)Foreign-born:
83.0% (759)
Asian - Speak only English Native:
65.7% (366)Foreign-born:
7.0% (54)
Asian - Speak another language Native:
32.9% (183)Foreign-born:
92.9% (711)
Native Hawaiian / Pacific Islander - Speak only English Native:
76.5% (78)Foreign-born:
61.3% (115)
Native Hawaiian / Pacific Islander - Speak another language Native:
15.2% (16)Foreign-born:
45.3% (85)
Other race - Speak only English Native:
88.1% (759)Foreign-born:
18.8% (36)
Other race - Speak another language Native:
14.3% (123)Foreign-born:
77.3% (148)
Two or more races - Speak another language Native:
24.0% (411)Foreign-born:
100.0% (335)
White alone - Speak only English Native:
95.8% (5,958)Foreign-born:
15.7% (152)
White alone - Speak another language Native:
4.2% (263)Foreign-born:
87.1% (843)
Hispanic or Latino - Speak only English Native:
61.6% (643)Foreign-born:
14.1% (46)
Hispanic or Latino - Speak another language Native:
37.9% (395)Foreign-born:
84.8% (278)
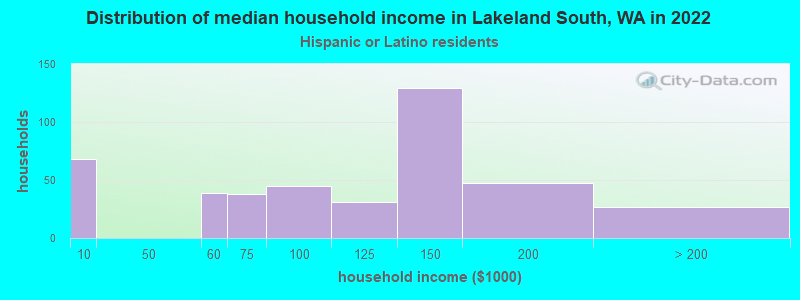
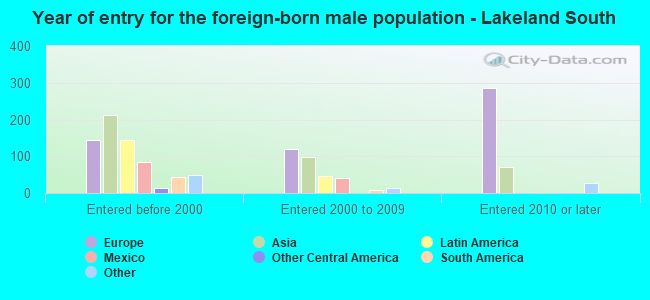
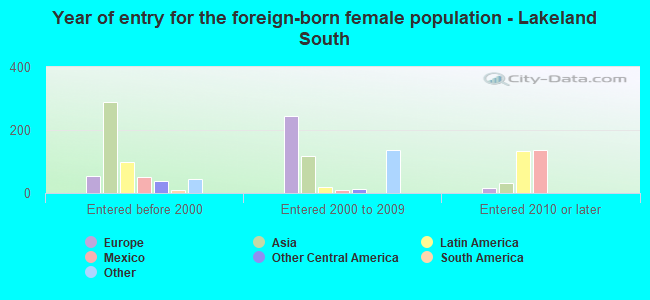
Foreign-born residents in Lakeland South 2,474 residents are foreign born (6.9% Europe , 6.3% Asia , 3.4% Latin America ).
This city:
19.5%Washington:
14.9%
Marital status for residents in Lakeland South Marital status - White (Caucasian) population 15 years and over
Males 26.7% Never married57.7% Now married0.0% Separated1.6% Widowed14.0% DivorcedFemales 21.4% Never married63.3% Now married0.4% Separated7.5% Widowed7.4% DivorcedWomen who gave birth in the past 12 months Now married:
60.0% (19)Unmarried:
40.0% (13)
Women who did not give birth in the past 12 months Now married:
54.8% (729)Unmarried:
45.2% (602)
Marital status - Black or African American population 15 years and over
Males 54.0% Never married46.0% Now married0.0% Separated0.0% Widowed0.0% DivorcedFemales 25.0% Never married24.3% Now married0.0% Separated0.0% Widowed50.7% DivorcedWomen who did not give birth in the past 12 months Now married:
71.4% (36)Unmarried:
28.6% (14)
Marital status - American Indian / Alaska Native population 15 years and over
Males 0.0% Never married100.0% Now married0.0% Separated0.0% Widowed0.0% DivorcedFemales 60.0% Never married40.0% Now married0.0% Separated0.0% Widowed0.0% DivorcedWomen who did not give birth in the past 12 months Now married:
40.0% (7)Unmarried:
60.0% (11)
Marital status - Asian population 15 years and over
Males 35.7% Never married62.0% Now married0.0% Separated0.0% Widowed2.3% DivorcedFemales 12.0% Never married66.8% Now married0.0% Separated12.5% Widowed8.7% DivorcedWomen who gave birth in the past 12 months Now married:
100.0% (31)Unmarried:
0.0% (0)
Women who did not give birth in the past 12 months Now married:
60.1% (182)Unmarried:
39.9% (121)
Marital status - Native Hawaiian / Pacific Islander population 15 years and over
Males 0.0% Never married100.0% Now married0.0% Separated0.0% Widowed0.0% DivorcedFemales 0.0% Never married48.7% Now married0.0% Separated51.3% Widowed0.0% DivorcedWomen who did not give birth in the past 12 months Now married:
49.0% (51)Unmarried:
51.0% (53)
Marital status - Other race population 15 years and over
Males 65.2% Never married22.1% Now married0.0% Separated0.0% Widowed12.6% DivorcedFemales 57.1% Never married28.4% Now married0.0% Separated12.1% Widowed2.4% DivorcedWomen who gave birth in the past 12 months Now married:
0.0% (0)Unmarried:
100.0% (10)
Women who did not give birth in the past 12 months Now married:
11.8% (26)Unmarried:
88.2% (194)
Marital status - Two or more races population 15 years and over
Males 43.3% Never married54.9% Now married0.0% Separated0.0% Widowed1.9% DivorcedFemales 44.2% Never married36.6% Now married10.1% Separated4.5% Widowed4.6% DivorcedWomen who gave birth in the past 12 months Now married:
61.1% (62)Unmarried:
38.9% (40)
Women who did not give birth in the past 12 months Now married:
41.8% (271)Unmarried:
58.2% (377)
Marital status - White alone, not Hispanic / Latino population 15 years and over
Males 27.0% Never married57.2% Now married0.0% Separated1.6% Widowed14.1% DivorcedFemales 19.5% Never married64.7% Now married0.4% Separated7.6% Widowed7.7% DivorcedWomen who gave birth in the past 12 months Now married:
60.0% (20)Unmarried:
40.0% (13)
Women who did not give birth in the past 12 months Now married:
57.9% (742)Unmarried:
42.1% (541)
Marital status - Hispanic or Latino population 15 years and over
Males 34.6% Never married60.1% Now married0.0% Separated0.0% Widowed5.3% DivorcedFemales 46.2% Never married34.8% Now married12.1% Separated0.8% Widowed6.1% DivorcedWomen who gave birth in the past 12 months Now married:
53.8% (52)Unmarried:
46.2% (45)
Women who did not give birth in the past 12 months Now married:
38.6% (187)Unmarried:
61.4% (297)
Ancestries in Lakeland South
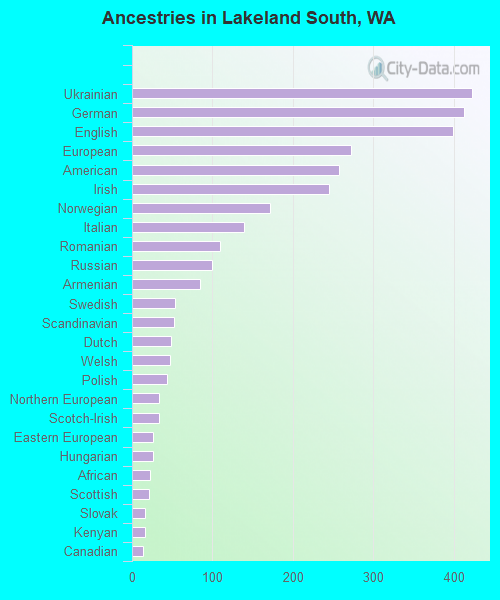
423 6.8% Ukrainian413 6.7% German399 6.4% English272 4.4% European258 4.2% American245 4.0% Irish172 2.8% Norwegian139 2.2% Italian110 1.8% Romanian100 1.6% Russian84 1.4% Armenian54 0.9% Swedish52 0.8% Scandinavian49 0.8% Dutch47 0.8% Welsh44 0.7% Polish34 0.5% Northern European34 0.5% Scotch-Irish26 0.4% Eastern European26 0.4% Hungarian23 0.4% African21 0.3% Scottish16 0.3% Slovak16 0.3% Kenyan14 0.2% Canadian12 0.2% British9 0.1% Czech9 0.1% Greek7 0.1% Finnish7 0.1% Pennsylvania German7 0.1% Swiss
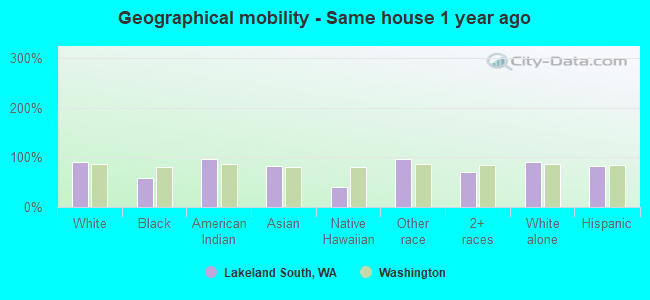
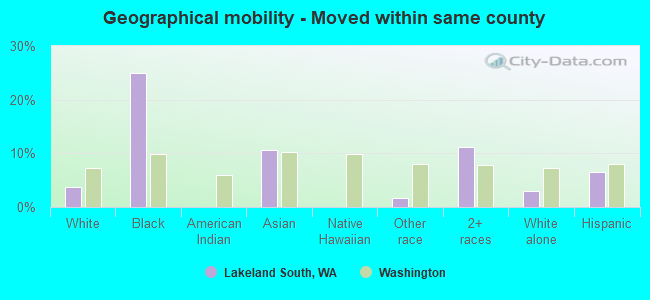
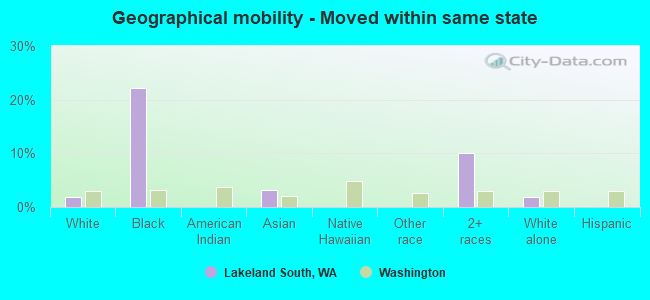
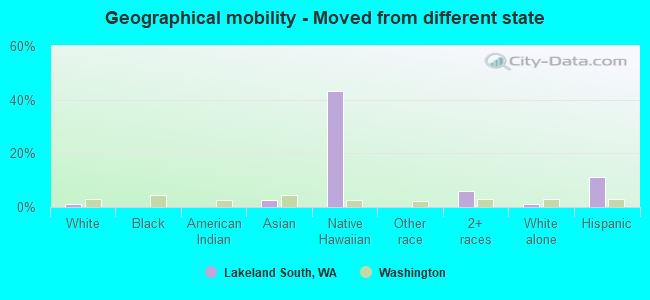
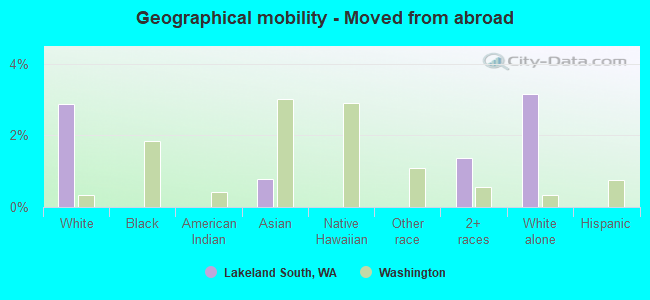
Geographical mobility in Lakeland South Same house 1 year ago 6,723 91.0% White (Caucasian)173 57.5% Black or African American20 96.7% American Indian / Alaska Native1,085 81.5% Asian107 40.1% Native Hawaiian / Pacific Islander996 96.9% Other race1,640 71.0% Two or more races6,739 91.5% White alone, not Hispanic / Latino1,285 82.9% Hispanic or LatinoMoved within same county 272 3.7% White / Caucasian75 25.0% Black or African American141 10.6% Asian18 1.7% Other race259 11.2% Two or more races215 2.9% White alone, not Hispanic / Latino102 6.6% Hispanic or LatinoMoved within same state 133 1.8% White / Caucasian66 22.1% Black or African American41 3.1% Asian234 10.1% Two or more races137 1.9% White alone, not Hispanic / LatinoMoved from different state 74 1.0% White / Caucasian34 2.5% Asian115 43.4% Native Hawaiian / Pacific Islander140 6.1% Two or more races76 1.0% White alone, not Hispanic / Latino174 11.2% Hispanic or LatinoMoved from abroad 213 2.9% White10 0.8% Asian31 1.4% Two or more races232 3.2% White alone, not Hispanic / Latino
Children Nativity (place of birth) in Lakeland South
Children under 6 years - Living with two parents Both parents native 216 100.0% NativeBoth parents foreign-born 121 100.0% NativeOne native, one foreign-born parent 116 100.0% NativeChildren under 6 years - Living with one parent Native parent 85 100.0% NativeForeign-born parent 170 100.0% NativeChildren 6 to 17 years - Living with two parents Both parents native 483 100.0% NativeBoth parents foreign-born 391 58.0% Native284 42.0% Foreign-bornOne native, one foreign-born parent 105 100.0% NativeChildren 6 to 17 years - Living with one parent Native parent 340 100.0% NativeForeign-born parent 163 59.2% Native112 40.8% Foreign-born
Grandparents responsible for own grandchildren in Lakeland South
Grandparents (30 to 59 years) White / Caucasian 50 100.0% Not responsible for grandchildrenOther race 6 100.0% Not responsible for grandchildrenTwo or more races 85 100.0% Not responsible for grandchildrenWhite alone, not Hispanic / Latino 54 100.0% Not responsible for grandchildrenHispanic or Latino 57 100.0% Not responsible for grandchildrenGrandparents (60 years and over) White / Caucasian 10 12.7% Responsible for grandchildren66 87.3% Not responsible for grandchildrenOther race 19 100.0% Not responsible for grandchildrenTwo or more races 130 100.0% Not responsible for grandchildrenWhite alone, not Hispanic / Latino 10 13.7% Responsible for grandchildren60 86.3% Not responsible for grandchildrenHispanic or Latino 111 100.0% Not responsible for grandchildren