Races in Landsford, South Carolina (SC) Detailed Stats
Ancestries, Foreign-born residents, place of birth
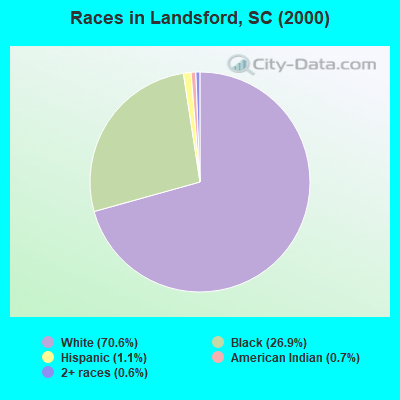
Race distribution in Landsford

- 3,49070.6%White alone
- 1,32726.9%Black alone
- 541.1%Hispanic
- 360.7%American Indian alone
- 280.6%Two or more races
- 30.06%Asian alone
- 30.06%Other race alone
2000
2022
-
- 2,652,29166.1%White alone
- 1,178,48629.4%Black alone
- 95,0762.4%Hispanic
- 35,5680.9%Asian alone
- 33,2900.8%Two or more races
- 12,7650.3%American Indian alone
- 3,2660.08%Other race alone
- 1,2700.03%Native Hawaiian and Other
Pacific Islander alone

-
- 3,301,73962.5%White alone
- 1,313,29024.9%Black alone
- 343,7836.5%Hispanic
- 190,5083.6%Two or more races
- 89,8881.7%Asian alone
- 29,3900.6%Other race alone
- 12,1120.2%American Indian alone
- 1,9240.04%Native Hawaiian and Other
Pacific Islander alone

Income and house value in Landsford
- Median household income in 2022
- $66,621White non-Hispanic householders
- $45,959Black householders
- $19,807American Indian and Alaska Native householders
- $149,680Some other race householders
- $124,456Two or more races householders
- $90,893Hispanic or Latino race householders
- Median 2022 house value
- $222,403White Non-Hispanic householders
- $133,024Black or African American householders
- $45,735American Indian or Alaska Native householders
- $346,280Two or more races householders
Household income for White non-Hispanic householders

Household income for Black householders

Household income for American Indian and Alaska Native householders

Household income for Two or more races householders

Household income for Hispanic or Latino race householders

Zip code: 29714