Races in Le Ray, New York (NY) Detailed Stats
Ancestries, Foreign-born residents, place of birth
6.6% of Le Ray, NY residents are foreign-born (2.8% born in Latin America, 1.5% born in Europe, 1.3% born in Asia), which is 232.1% less than the foreign-born rate of 22.0% across the entire state of New York.
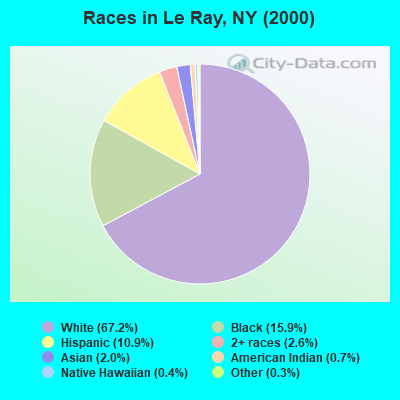
Race distribution in Le Ray

- 13,32967.2%White alone
- 3,14515.9%Black alone
- 2,17010.9%Hispanic
- 5152.6%Two or more races
- 3982.0%Asian alone
- 1310.7%American Indian alone
- 890.4%Native Hawaiian and Other
Pacific Islander alone - 590.3%Other race alone
2000
2022
-
- 11,760,98162.0%White alone
- 2,867,58315.1%Hispanic
- 2,812,62314.8%Black alone
- 1,035,9265.5%Asian alone
- 366,1161.9%Two or more races
- 75,4990.4%Other race alone
- 52,4990.3%American Indian alone
- 5,2300.03%Native Hawaiian and Other
Pacific Islander alone

-
- 10,408,93352.9%White alone
- 3,867,29919.7%Hispanic
- 2,633,84013.4%Black alone
- 1,776,2869.0%Asian alone
- 732,6703.7%Two or more races
- 216,1101.1%Other race alone
- 35,0820.2%American Indian alone
- 6,9310.04%Native Hawaiian and Other
Pacific Islander alone

Income and house value in Le Ray
- Median household income in 2022
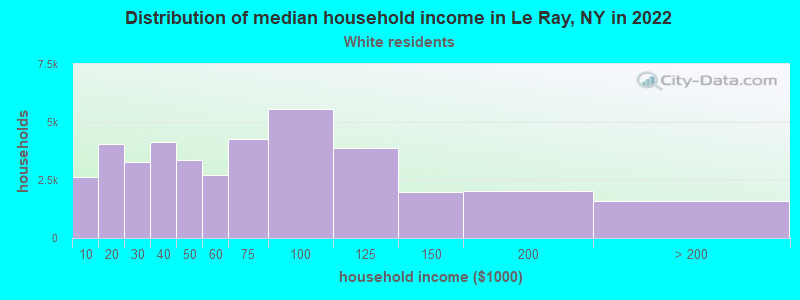
- $58,713White non-Hispanic householders
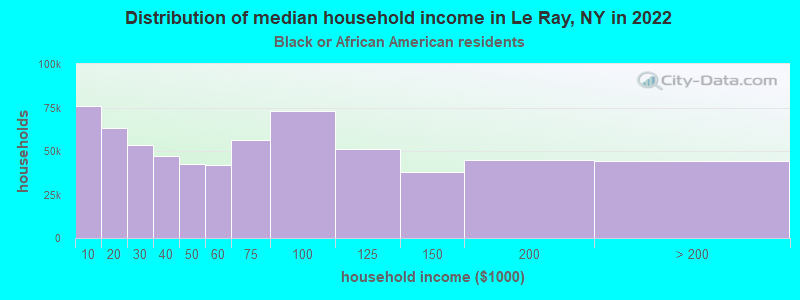
- $70,483Black householders
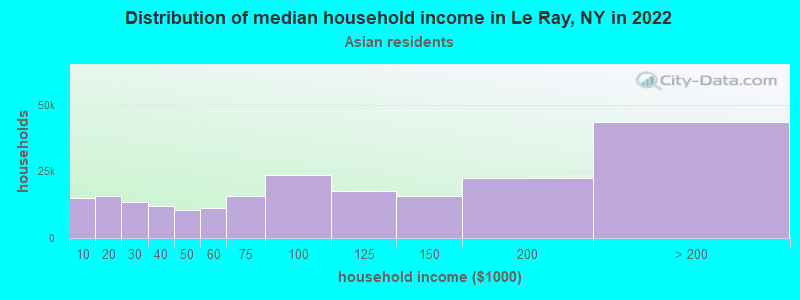
- $60,606Asian householders
- $60,285Some other race householders
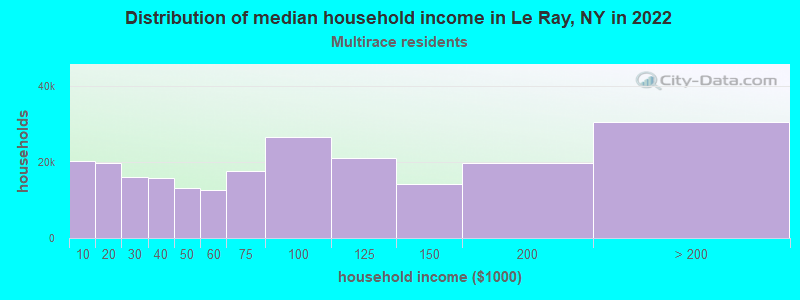
- $80,312Two or more races householders
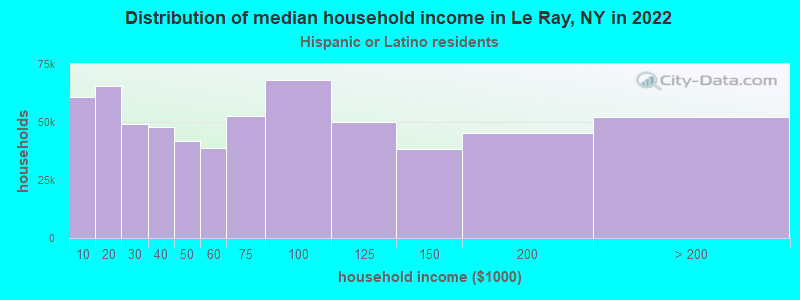
- $48,917Hispanic or Latino race householders
- Median 2022 house value
- $195,980White Non-Hispanic householders
- $216,681Black or African American householders
- $184,420Asian householders
- $87,371Hispanic or Latino householders
Household income for White non-Hispanic householders
Household income for Black householders
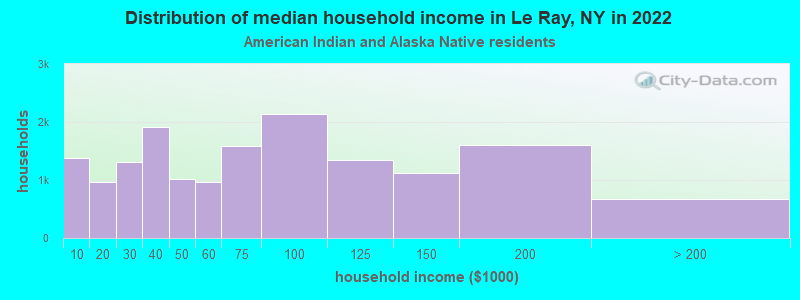
Household income for American Indian and Alaska Native householders
Household income for Asian householders
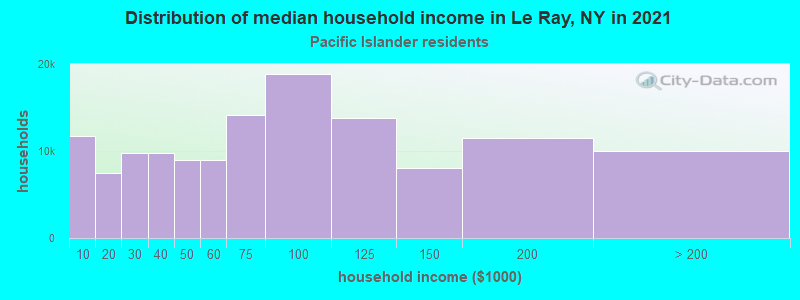
Household income for Native Hawaiian and other Pacific Islander householders
Household income for Two or more races householders
Household income for Hispanic or Latino race householders
Foreign-born residents in Le Ray
1,314 residents are foreign born (2.8% Latin America, 1.5% Europe, 1.3% Asia).
| This city: | 6.6% |
| New York: | 20.4% |
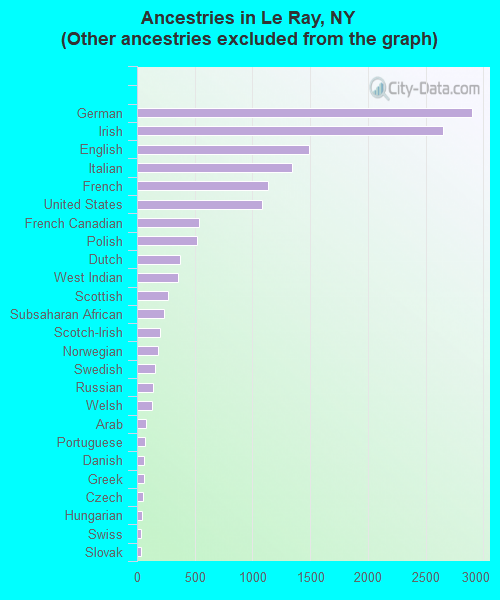
Ancestries in Le Ray

- 7,10833.4%Other
- 2,90313.6%German
- 2,64812.4%Irish
- 1,4927.0%English
- 1,3426.3%Italian
- 1,1315.3%French
- 1,0815.1%United States
- 5402.5%French Canadian
- 5202.4%Polish
- 3751.8%Dutch
- 3511.6%West Indian
- 2701.3%Scottish
- 2351.1%Subsaharan African
- 2000.9%Scotch-Irish
- 1840.9%Norwegian
- 1560.7%Swedish
- 1420.7%Russian
- 1310.6%Welsh
- 820.4%Arab
- 680.3%Portuguese
- 610.3%Danish
- 570.3%Greek
- 480.2%Czech
- 390.2%Hungarian
- 380.2%Swiss
- 330.2%Slovak
- 210.10%Ukrainian
- 190.09%Lithuanian
Zip codes: 13637.