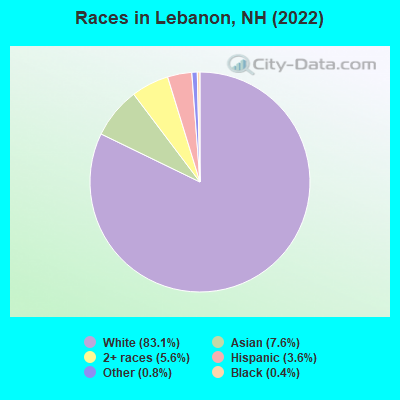
Races in Lebanon, New Hampshire (NH) Detailed Stats
Data:
Races - White alone (%)
Races - White alone (% change since 2000)
Races - Black alone (%)
Races - Black alone (% change since 2000)
Races - American Indian alone (%)
Races - American Indian alone (% change since 2000)
Races - Asian alone (%)
Races - Asian alone (% change since 2000)
Races - Hispanic (%)
Races - Hispanic (% change since 2000)
Races - Native Hawaiian and Other Pacific Islander alone (%)
Races - Native Hawaiian and Other Pacific Islander alone (% change since 2000)
Races - Two or more races(%)
Races - Two or more races(% change since 2000)
Races - Other race alone (%)
Races - Other race alone (% change since 2000)
Racial diversity
Place of birth - Born in state of residence (%)
Place of birth - Born in state of residence (%) - White
Place of birth - Born in state of residence (%) - Black or African American
Place of birth - Born in state of residence (%) - Asian
Place of birth - Born in state of residence (%) - Hispanic or Latino
Place of birth - Born in state of residence (%) - American Indian and Alaska Native
Place of birth - Born in state of residence (%) - Multirace
Place of birth - Born in state of residence (%) - Other Race
Place of birth - Born in other state (%)
Place of birth - Born in other state (%) - White
Place of birth - Born in other state (%) - Black or African American
Place of birth - Born in other state (%) - Asian
Place of birth - Born in other state (%) - Hispanic or Latino
Place of birth - Born in other state (%) - American Indian and Alaska Native
Place of birth - Born in other state (%) - Multirace
Place of birth - Born in other state (%) - Other Race
Place of birth - Native, outside of US (%)
Place of birth - Native, outside of US (%) - White
Place of birth - Native, outside of US (%) - Black or African American
Place of birth - Native, outside of US (%) - Asian
Place of birth - Native, outside of US (%) - Hispanic or Latino
Place of birth - Native, outside of US (%) - American Indian and Alaska Native
Place of birth - Native, outside of US (%) - Multirace
Place of birth - Native, outside of US (%) - Other Race
Place of birth - Foreign born (%)
Place of birth - Foreign born (%) - White
Place of birth - Foreign born (%) - Black or African American
Place of birth - Foreign born (%) - Asian
Place of birth - Foreign born (%) - Hispanic or Latino
Place of birth - Foreign born (%) - American Indian and Alaska Native
Place of birth - Foreign born (%) - Multirace
Place of birth - Foreign born (%) - Other Race
Residents speaking English at home (%)
Residents speaking English at home - Born in the United States (%)
Residents speaking English at home - Native, born elsewhere (%)
Residents speaking English at home - Foreign born (%)
Residents speaking Spanish at home (%)
Residents speaking Spanish at home - Born in the United States (%)
Residents speaking Spanish at home - Native, born elsewhere (%)
Residents speaking Spanish at home - Foreign born (%)
Residents speaking other language at home (%)
Residents speaking other language at home - Born in the United States (%)
Residents speaking other language at home - Native, born elsewhere (%)
Residents speaking other language at home - Foreign born (%)
Marital status - Never married (%)
Marital status - Now married (%)
Marital status - Separated (%)
Marital status - Widowed (%)
Marital status - Divorced (%)
Ancestries Reported - Arab (%)
Ancestries Reported - Czech (%)
Ancestries Reported - Danish (%)
Ancestries Reported - Dutch (%)
Ancestries Reported - English (%)
Ancestries Reported - French (%)
Ancestries Reported - French Canadian (%)
Ancestries Reported - German (%)
Ancestries Reported - Greek (%)
Ancestries Reported - Hungarian (%)
Ancestries Reported - Irish (%)
Ancestries Reported - Italian (%)
Ancestries Reported - Lithuanian (%)
Ancestries Reported - Norwegian (%)
Ancestries Reported - Polish (%)
Ancestries Reported - Portuguese (%)
Ancestries Reported - Russian (%)
Ancestries Reported - Scotch-Irish (%)
Ancestries Reported - Scottish (%)
Ancestries Reported - Slovak (%)
Ancestries Reported - Subsaharan African (%)
Ancestries Reported - Swedish (%)
Ancestries Reported - Swiss (%)
Ancestries Reported - Ukrainian (%)
Ancestries Reported - United States (%)
Ancestries Reported - Welsh (%)
Ancestries Reported - West Indian (%)
Ancestries Reported - Other (%)
Geographical mobility - Same house 1 year ago (%)
Geographical mobility - Same house 1 year ago (%) - White
Geographical mobility - Same house 1 year ago (%) - Black or African American
Geographical mobility - Same house 1 year ago (%) - Asian
Geographical mobility - Same house 1 year ago (%) - Hispanic or Latino
Geographical mobility - Same house 1 year ago (%) - American Indian and Alaska Native
Geographical mobility - Same house 1 year ago (%) - Multirace
Geographical mobility - Same house 1 year ago (%) - Other Race
Geographical mobility - Moved within same county (%)
Geographical mobility - Moved within same county (%) - White
Geographical mobility - Moved within same county (%) - Black or African American
Geographical mobility - Moved within same county (%) - Asian
Geographical mobility - Moved within same county (%) - Hispanic or Latino
Geographical mobility - Moved within same county (%) - American Indian and Alaska Native
Geographical mobility - Moved within same county (%) - Multirace
Geographical mobility - Moved within same county (%) - Other Race
Geographical mobility - Moved from different county within same state (%)
Geographical mobility - Moved from different county within same state (%) - White
Geographical mobility - Moved from different county within same state (%) - Black or African American
Geographical mobility - Moved from different county within same state (%) - Asian
Geographical mobility - Moved from different county within same state (%) - Hispanic or Latino
Geographical mobility - Moved from different county within same state (%) - American Indian and Alaska Native
Geographical mobility - Moved from different county within same state (%) - Multirace
Geographical mobility - Moved from different county within same state (%) - Other Race
Geographical mobility - Moved from different state (%)
Geographical mobility - Moved from different state (%) - White
Geographical mobility - Moved from different state (%) - Black or African American
Geographical mobility - Moved from different state (%) - Asian
Geographical mobility - Moved from different state (%) - Hispanic or Latino
Geographical mobility - Moved from different state (%) - American Indian and Alaska Native
Geographical mobility - Moved from different state (%) - Multirace
Geographical mobility - Moved from different state (%) - Other Race
Geographical mobility - Moved from abroad (%)
Geographical mobility - Moved from abroad (%) - White
Geographical mobility - Moved from abroad (%) - Black or African American
Geographical mobility - Moved from abroad (%) - Asian
Geographical mobility - Moved from abroad (%) - Hispanic or Latino
Geographical mobility - Moved from abroad (%) - American Indian and Alaska Native
Geographical mobility - Moved from abroad (%) - Multirace
Geographical mobility - Moved from abroad (%) - Other Race
Place of birth for the foreign-born population - Ireland (%)
Place of birth for the foreign-born population - Denmark (%)
Place of birth for the foreign-born population - Norway (%)
Place of birth for the foreign-born population - Sweden (%)
Place of birth for the foreign-born population - United Kingdom (%)
Place of birth for the foreign-born population - England (%)
Place of birth for the foreign-born population - Scotland (%)
Place of birth for the foreign-born population - Other Northern Europe (%)
Place of birth for the foreign-born population - Austria (%)
Place of birth for the foreign-born population - Belgium (%)
Place of birth for the foreign-born population - France (%)
Place of birth for the foreign-born population - Germany (%)
Place of birth for the foreign-born population - Netherlands (%)
Place of birth for the foreign-born population - Switzerland (%)
Place of birth for the foreign-born population - Other Western Europe (%)
Place of birth for the foreign-born population - Greece (%)
Place of birth for the foreign-born population - Italy (%)
Place of birth for the foreign-born population - Portugal (%)
Place of birth for the foreign-born population - Spain (%)
Place of birth for the foreign-born population - Other Southern Europe (%)
Place of birth for the foreign-born population - Albania (%)
Place of birth for the foreign-born population - Belarus (%)
Place of birth for the foreign-born population - Bosnia and Herzegovina (%)
Place of birth for the foreign-born population - Bulgaria (%)
Place of birth for the foreign-born population - Croatia (%)
Place of birth for the foreign-born population - Czechoslovakia (%)
Place of birth for the foreign-born population - Hungary (%)
Place of birth for the foreign-born population - Latvia (%)
Place of birth for the foreign-born population - Lithuania (%)
Place of birth for the foreign-born population - North Macedonia (Macedonia) (%)
Place of birth for the foreign-born population - Moldova (%)
Place of birth for the foreign-born population - Poland (%)
Place of birth for the foreign-born population - Romania (%)
Place of birth for the foreign-born population - Russia (%)
Place of birth for the foreign-born population - Serbia (%)
Place of birth for the foreign-born population - Ukraine (%)
Place of birth for the foreign-born population - Other Eastern Europe (%)
Place of birth for the foreign-born population - China (%)
Place of birth for the foreign-born population - Hong Kong (%)
Place of birth for the foreign-born population - Taiwan (%)
Place of birth for the foreign-born population - Japan (%)
Place of birth for the foreign-born population - Korea (%)
Place of birth for the foreign-born population - Other Eastern Asia (%)
Place of birth for the foreign-born population - Afghanistan (%)
Place of birth for the foreign-born population - Bangladesh (%)
Place of birth for the foreign-born population - India (%)
Place of birth for the foreign-born population - Iran (%)
Place of birth for the foreign-born population - Kazakhstan (%)
Place of birth for the foreign-born population - Nepal (%)
Place of birth for the foreign-born population - Pakistan (%)
Place of birth for the foreign-born population - Sri Lanka (%)
Place of birth for the foreign-born population - Uzbekistan (%)
Place of birth for the foreign-born population - Other South Central Asia (%)
Place of birth for the foreign-born population - Burma (%)
Place of birth for the foreign-born population - Cambodia (%)
Place of birth for the foreign-born population - Indonesia (%)
Place of birth for the foreign-born population - Laos (%)
Place of birth for the foreign-born population - Malaysia (%)
Place of birth for the foreign-born population - Philippines (%)
Place of birth for the foreign-born population - Singapore (%)
Place of birth for the foreign-born population - Thailand (%)
Place of birth for the foreign-born population - Vietnam (%)
Place of birth for the foreign-born population - Other South Eastern Asia (%)
Place of birth for the foreign-born population - Armenia (%)
Place of birth for the foreign-born population - Iraq (%)
Place of birth for the foreign-born population - Israel (%)
Place of birth for the foreign-born population - Jordan (%)
Place of birth for the foreign-born population - Kuwait (%)
Place of birth for the foreign-born population - Lebanon (%)
Place of birth for the foreign-born population - Saudi Arabia (%)
Place of birth for the foreign-born population - Syria (%)
Place of birth for the foreign-born population - Turkey (%)
Place of birth for the foreign-born population - Yemen (%)
Place of birth for the foreign-born population - Other Western Asia (%)
Place of birth for the foreign-born population - Eritrea (%)
Place of birth for the foreign-born population - Ethiopia (%)
Place of birth for the foreign-born population - Kenya (%)
Place of birth for the foreign-born population - Somalia (%)
Place of birth for the foreign-born population - Uganda (%)
Place of birth for the foreign-born population - Zimbabwe (%)
Place of birth for the foreign-born population - Other Eastern Africa (%)
Place of birth for the foreign-born population - Cameroon (%)
Place of birth for the foreign-born population - Congo (%)
Place of birth for the foreign-born population - Democratic Republic of Congo (Zaire) (%)
Place of birth for the foreign-born population - Other Middle Africa (%)
Place of birth for the foreign-born population - Egypt (%)
Place of birth for the foreign-born population - Morocco (%)
Place of birth for the foreign-born population - Sudan (%)
Place of birth for the foreign-born population - Other Northern Africa (%)
Place of birth for the foreign-born population - South Africa (%)
Place of birth for the foreign-born population - Other Southern Africa (%)
Place of birth for the foreign-born population - Cabo Verde (%)
Place of birth for the foreign-born population - Ghana (%)
Place of birth for the foreign-born population - Liberia (%)
Place of birth for the foreign-born population - Nigeria (%)
Place of birth for the foreign-born population - Senegal (%)
Place of birth for the foreign-born population - Sierra Leone (%)
Place of birth for the foreign-born population - Other Western Africa (%)
Place of birth for the foreign-born population - Australia (%)
Place of birth for the foreign-born population - New Zealand (%)
Place of birth for the foreign-born population - Fiji (%)
Place of birth for the foreign-born population - Micronesia (%)
Place of birth for the foreign-born population - Bahamas (%)
Place of birth for the foreign-born population - Barbados (%)
Place of birth for the foreign-born population - Cuba (%)
Place of birth for the foreign-born population - Dominica (%)
Place of birth for the foreign-born population - Dominican Republic (%)
Place of birth for the foreign-born population - Grenada (%)
Place of birth for the foreign-born population - Haiti (%)
Place of birth for the foreign-born population - Jamaica (%)
Place of birth for the foreign-born population - St. Vincent and the Grenadines (%)
Place of birth for the foreign-born population - Trinidad and Tobago (%)
Place of birth for the foreign-born population - West Indies (%)
Place of birth for the foreign-born population - Other Caribbean (%)
Place of birth for the foreign-born population - Belize (%)
Place of birth for the foreign-born population - Costa Rica (%)
Place of birth for the foreign-born population - El Salvador (%)
Place of birth for the foreign-born population - Guatemala (%)
Place of birth for the foreign-born population - Honduras (%)
Place of birth for the foreign-born population - Mexico (%)
Place of birth for the foreign-born population - Nicaragua (%)
Place of birth for the foreign-born population - Panama (%)
Place of birth for the foreign-born population - Other Central America (%)
Place of birth for the foreign-born population - Argentina (%)
Place of birth for the foreign-born population - Bolivia (%)
Place of birth for the foreign-born population - Brazil (%)
Place of birth for the foreign-born population - Chile (%)
Place of birth for the foreign-born population - Colombia (%)
Place of birth for the foreign-born population - Ecuador (%)
Place of birth for the foreign-born population - Guyana (%)
Place of birth for the foreign-born population - Peru (%)
Place of birth for the foreign-born population - Uruguay (%)
Place of birth for the foreign-born population - Venezuela (%)
Place of birth for the foreign-born population - Other South America (%)
Place of birth for the foreign-born population - Canada (%)
Place of birth for the foreign-born population - Other Northern America (%)
Place of birth for the foreign-born population - Other (%)
Latest news about races in Lebanon, NH collected exclusively by city-data.com from local newspapers, TV, and radio stations
According to 2022 data, the most numerous races in Lebanon, NH are White alone (12,105 residents), Hispanic (518 residents), and Two or more races (816 residents). 90.4% of Lebanon residents speak English at home. 9.6% of Lebanon, NH residents are foreign-born (5.5% born in Asia, 2.3% born in Europe), which is 47.7% greater than the foreign-born rate of 5.0% across the entire state of New Hampshire.
Race distribution in Lebanon
2000 2022
1,175,252 95.1% White alone 20,489 1.7% Hispanic 15,803 1.3% Asian alone 11,606 0.9% Two or more races 8,354 0.7% Black alone 2,698 0.2% American Indian alone 1,254 0.1% Other race alone 330 0.03% Native Hawaiian and Other
1,208,101 86.6% White alone 63,479 4.5% Hispanic 60,724 4.4% Two or more races 36,519 2.6% Asian alone 17,931 1.3% Black alone 6,615 0.5% Other race alone 1,014 0.07% American Indian alone 848 0.06% Native Hawaiian and Other
Income and house value in Lebanon Median household income in 2022 $88,710 White non-Hispanic householdersover $200,000 Asian householders$99,255 Two or more races householders$142,124 Hispanic or Latino race householdersMedian 2022 house value $400,564 White Non-Hispanic householders$615,621 Black or African American householders$533,538 American Indian or Alaska Native householders $533,538 Asian householders$533,538 Some other race householders$426,831 Two or more races householders$468,200 Hispanic or Latino householders
Median age by race in Lebanon
41.0 Median age for White residents37.9 42.7 14.2 Median age for Black or African American residents-670,623,144.7 10.2 -698,924,730.5 Median age for American Indian / Alaska Native residents-772,357,722.8 -662,878,787.2 38.4 Median age for Asian residents55.4 31.6 -633,846,153.2 Median age for Native Hawaiian / Pacific Islander residents-594,900,849.3 -666,666,666.0 34.0 Median age for Other race residents26.9 33.6 45.6 Median age for Two or more races residents38.0 45.2 41.0 Median age for White alone residents38.1 43.3 38.0 Median age for Hispanic or Latino residents35.6 38.6
Owner/renter occupied households by race in Lebanon
House owners and renters - White residents 2,932 51.6% Owner occupied2,751 48.4% Renter occupiedHouse owners and renters - Black or African American residents 17 100.0% Renter occupiedHouse owners and renters - American Indian / Alaska Native residents 34 100.0% Renter occupiedHouse owners and renters - Asian residents 393 61.8% Owner occupied243 38.2% Renter occupiedHouse owners and renters - Other race residents 59 100.0% Renter occupiedHouse owners and renters - Two or more races residents 218 73.3% Owner occupied79 26.7% Renter occupiedHouse owners and renters - White alone residents 2,866 51.1% Owner occupied2,745 48.9% Renter occupiedHouse owners and renters - Hispanic or Latino residents 94 47.7% Owner occupied103 52.3% Renter occupied
Language usage in Lebanon
English speakers - Total 90.4% of residents of Lebanon speak English at home.
1.2% of residents speak Spanish at home 45 27.3% Speak English very well120 72.7% Speak English less than very well9.1% of residents speak other language at home 1,078 85.4% Speak English very well185 14.6% Speak English less than very well
English speakers - Born in the United States 96.4% of residents of Lebanon speak English at home.
0.2% of residents speak Spanish at home 14 100.0% Speak English very well3.2% of residents speak other language at home 204 91.1% Speak English very well20 8.9% Speak English less than very well
English speakers - Native, born elsewhere 67.7% of residents of Lebanon speak English at home.
41.9% of residents speak Spanish at home 58 60.4% Speak English very well38 39.6% Speak English less than very well
English speakers - Foreign-born 37.8% of residents of Lebanon speak English at home.
5.1% of residents speak Spanish at home 3 4.1% Speak English very well71 95.9% Speak English less than very well59.2% of residents speak other language at home 722 84.3% Speak English very well134 15.7% Speak English less than very well
White (Caucasian) - Speak only English Native:
97.9% (11,180)Foreign-born:
48.1% (212)
White (Caucasian) - Speak another language Native:
2.1% (239)Foreign-born:
50.8% (224)
Black or African American - Speak only English Native:
47.9% (5)Foreign-born:
95.5% (73)
Black or African American - Speak another language Native:
38.5% (4)Foreign-born:
27.9% (21)
Asian - Speak only English Native:
57.4% (173)Foreign-born:
16.7% (128)
Asian - Speak another language Native:
42.7% (129)Foreign-born:
82.3% (633)
Other race - Speak another language Native:
54.2% (119)Foreign-born:
100.0% (23)
Two or more races - Speak only English Native:
93.3% (630)Foreign-born:
100.0% (152)
Two or more races - Speak another language Native:
7.4% (50)Foreign-born:
4.9% (8)
White alone - Speak only English Native:
97.7% (10,921)Foreign-born:
48.9% (203)
White alone - Speak another language Native:
2.2% (249)Foreign-born:
49.2% (204)
Hispanic or Latino - Speak only English Native:
77.7% (322)Foreign-born:
32.0% (20)
Hispanic or Latino - Speak another language Native:
24.2% (100)Foreign-born:
55.3% (34)
Foreign-born residents in Lebanon 1,391 residents are foreign born (5.5% Asia , 2.3% Europe ).
This city:
9.6%New Hampshire:
6.0%
Marital status for residents in Lebanon Marital status - White (Caucasian) population 15 years and over
Males 36.3% Never married46.3% Now married0.6% Separated4.3% Widowed12.5% DivorcedFemales 30.7% Never married43.9% Now married1.0% Separated9.1% Widowed15.4% DivorcedWomen who gave birth in the past 12 months Now married:
71.1% (192)Unmarried:
28.9% (78)
Women who did not give birth in the past 12 months Now married:
40.2% (1,041)Unmarried:
59.8% (1,549)
Marital status - Black or African American population 15 years and over
Males 0.0% Never married100.0% Now married0.0% Separated0.0% Widowed0.0% DivorcedFemales 16.7% Never married83.3% Now married0.0% Separated0.0% Widowed0.0% DivorcedWomen who gave birth in the past 12 months Now married:
100.0% (7)Unmarried:
0.0% (0)
Women who did not give birth in the past 12 months Now married:
78.3% (18)Unmarried:
21.7% (5)
Marital status - Asian population 15 years and over
Males 20.6% Never married79.4% Now married0.0% Separated0.0% Widowed0.0% DivorcedFemales 39.9% Never married47.3% Now married0.0% Separated12.8% Widowed0.0% DivorcedWomen who did not give birth in the past 12 months Now married:
48.2% (168)Unmarried:
51.8% (180)
Marital status - Other race population 15 years and over
Males 46.7% Never married53.3% Now married0.0% Separated0.0% Widowed0.0% DivorcedFemales 68.6% Never married31.4% Now married0.0% Separated0.0% Widowed0.0% DivorcedWomen who did not give birth in the past 12 months Now married:
13.3% (20)Unmarried:
86.7% (128)
Marital status - Two or more races population 15 years and over
Males 56.7% Never married31.7% Now married11.5% Separated0.0% Widowed0.0% DivorcedFemales 62.4% Never married33.3% Now married0.0% Separated0.0% Widowed4.2% DivorcedWomen who did not give birth in the past 12 months Now married:
21.8% (69)Unmarried:
78.2% (247)
Marital status - White alone, not Hispanic / Latino population 15 years and over
Males 35.4% Never married46.8% Now married0.6% Separated4.4% Widowed12.9% DivorcedFemales 31.1% Never married44.0% Now married0.4% Separated9.3% Widowed15.2% DivorcedWomen who gave birth in the past 12 months Now married:
71.1% (192)Unmarried:
28.9% (78)
Women who did not give birth in the past 12 months Now married:
39.4% (988)Unmarried:
60.6% (1,522)
Marital status - Hispanic or Latino population 15 years and over
Males 46.6% Never married53.4% Now married0.0% Separated0.0% Widowed0.0% DivorcedFemales 32.6% Never married40.1% Now married15.3% Separated0.0% Widowed12.0% DivorcedWomen who did not give birth in the past 12 months Now married:
45.3% (78)Unmarried:
54.7% (94)
Ancestries in Lebanon
1,278 20.9% English474 7.7% French439 7.2% Irish332 5.4% American302 4.9% Italian300 4.9% French Canadian254 4.1% German153 2.5% European148 2.4% Polish125 2.0% British86 1.4% Scottish85 1.4% Ugandan77 1.3% Dutch63 1.0% Austrian63 1.0% Northern European63 1.0% Russian55 0.9% Portuguese41 0.7% Iraqi41 0.7% Scotch-Irish36 0.6% Danish31 0.5% Swedish31 0.5% Welsh29 0.5% Eastern European19 0.3% Albanian19 0.3% Norwegian18 0.3% Iranian16 0.3% Hungarian16 0.3% Lithuanian13 0.2% New Zealander11 0.2% Brazilian10 0.2% Egyptian10 0.2% Haitian5 0.08% Canadian
Children Nativity (place of birth) in Lebanon
Children under 6 years - Living with two parents Both parents native 325 100.0% NativeBoth parents foreign-born 126 100.0% NativeOne native, one foreign-born parent 29 100.0% NativeChildren under 6 years - Living with one parent Native parent 315 100.0% NativeChildren 6 to 17 years - Living with two parents Both parents native 595 100.0% NativeBoth parents foreign-born 144 67.7% Native68 32.3% Foreign-bornOne native, one foreign-born parent 67 100.0% NativeChildren 6 to 17 years - Living with one parent Native parent 443 100.0% Native
Grandparents responsible for own grandchildren in Lebanon
Grandparents (30 to 59 years) White / Caucasian 13 10.9% Responsible for grandchildren109 89.1% Not responsible for grandchildrenWhite alone, not Hispanic / Latino 13 10.9% Responsible for grandchildren109 89.1% Not responsible for grandchildren
Grandparents (60 years and over) White / Caucasian 106 100.0% Not responsible for grandchildrenWhite alone, not Hispanic / Latino 77 100.0% Not responsible for grandchildren