Races in Lennox, California (CA) Detailed Stats
Data:
Races - White alone (%)
Races - White alone (% change since 2000)
Races - Black alone (%)
Races - Black alone (% change since 2000)
Races - American Indian alone (%)
Races - American Indian alone (% change since 2000)
Races - Asian alone (%)
Races - Asian alone (% change since 2000)
Races - Hispanic (%)
Races - Hispanic (% change since 2000)
Races - Native Hawaiian and Other Pacific Islander alone (%)
Races - Native Hawaiian and Other Pacific Islander alone (% change since 2000)
Races - Two or more races(%)
Races - Two or more races(% change since 2000)
Races - Other race alone (%)
Races - Other race alone (% change since 2000)
Racial diversity
Place of birth - Born in state of residence (%)
Place of birth - Born in state of residence (%) - White
Place of birth - Born in state of residence (%) - Black or African American
Place of birth - Born in state of residence (%) - Asian
Place of birth - Born in state of residence (%) - Hispanic or Latino
Place of birth - Born in state of residence (%) - American Indian and Alaska Native
Place of birth - Born in state of residence (%) - Multirace
Place of birth - Born in state of residence (%) - Other Race
Place of birth - Born in other state (%)
Place of birth - Born in other state (%) - White
Place of birth - Born in other state (%) - Black or African American
Place of birth - Born in other state (%) - Asian
Place of birth - Born in other state (%) - Hispanic or Latino
Place of birth - Born in other state (%) - American Indian and Alaska Native
Place of birth - Born in other state (%) - Multirace
Place of birth - Born in other state (%) - Other Race
Place of birth - Native, outside of US (%)
Place of birth - Native, outside of US (%) - White
Place of birth - Native, outside of US (%) - Black or African American
Place of birth - Native, outside of US (%) - Asian
Place of birth - Native, outside of US (%) - Hispanic or Latino
Place of birth - Native, outside of US (%) - American Indian and Alaska Native
Place of birth - Native, outside of US (%) - Multirace
Place of birth - Native, outside of US (%) - Other Race
Place of birth - Foreign born (%)
Place of birth - Foreign born (%) - White
Place of birth - Foreign born (%) - Black or African American
Place of birth - Foreign born (%) - Asian
Place of birth - Foreign born (%) - Hispanic or Latino
Place of birth - Foreign born (%) - American Indian and Alaska Native
Place of birth - Foreign born (%) - Multirace
Place of birth - Foreign born (%) - Other Race
Residents speaking English at home (%)
Residents speaking English at home - Born in the United States (%)
Residents speaking English at home - Native, born elsewhere (%)
Residents speaking English at home - Foreign born (%)
Residents speaking Spanish at home (%)
Residents speaking Spanish at home - Born in the United States (%)
Residents speaking Spanish at home - Native, born elsewhere (%)
Residents speaking Spanish at home - Foreign born (%)
Residents speaking other language at home (%)
Residents speaking other language at home - Born in the United States (%)
Residents speaking other language at home - Native, born elsewhere (%)
Residents speaking other language at home - Foreign born (%)
Marital status - Never married (%)
Marital status - Now married (%)
Marital status - Separated (%)
Marital status - Widowed (%)
Marital status - Divorced (%)
Ancestries Reported - Arab (%)
Ancestries Reported - Czech (%)
Ancestries Reported - Danish (%)
Ancestries Reported - Dutch (%)
Ancestries Reported - English (%)
Ancestries Reported - French (%)
Ancestries Reported - French Canadian (%)
Ancestries Reported - German (%)
Ancestries Reported - Greek (%)
Ancestries Reported - Hungarian (%)
Ancestries Reported - Irish (%)
Ancestries Reported - Italian (%)
Ancestries Reported - Lithuanian (%)
Ancestries Reported - Norwegian (%)
Ancestries Reported - Polish (%)
Ancestries Reported - Portuguese (%)
Ancestries Reported - Russian (%)
Ancestries Reported - Scotch-Irish (%)
Ancestries Reported - Scottish (%)
Ancestries Reported - Slovak (%)
Ancestries Reported - Subsaharan African (%)
Ancestries Reported - Swedish (%)
Ancestries Reported - Swiss (%)
Ancestries Reported - Ukrainian (%)
Ancestries Reported - United States (%)
Ancestries Reported - Welsh (%)
Ancestries Reported - West Indian (%)
Ancestries Reported - Other (%)
Geographical mobility - Same house 1 year ago (%)
Geographical mobility - Same house 1 year ago (%) - White
Geographical mobility - Same house 1 year ago (%) - Black or African American
Geographical mobility - Same house 1 year ago (%) - Asian
Geographical mobility - Same house 1 year ago (%) - Hispanic or Latino
Geographical mobility - Same house 1 year ago (%) - American Indian and Alaska Native
Geographical mobility - Same house 1 year ago (%) - Multirace
Geographical mobility - Same house 1 year ago (%) - Other Race
Geographical mobility - Moved within same county (%)
Geographical mobility - Moved within same county (%) - White
Geographical mobility - Moved within same county (%) - Black or African American
Geographical mobility - Moved within same county (%) - Asian
Geographical mobility - Moved within same county (%) - Hispanic or Latino
Geographical mobility - Moved within same county (%) - American Indian and Alaska Native
Geographical mobility - Moved within same county (%) - Multirace
Geographical mobility - Moved within same county (%) - Other Race
Geographical mobility - Moved from different county within same state (%)
Geographical mobility - Moved from different county within same state (%) - White
Geographical mobility - Moved from different county within same state (%) - Black or African American
Geographical mobility - Moved from different county within same state (%) - Asian
Geographical mobility - Moved from different county within same state (%) - Hispanic or Latino
Geographical mobility - Moved from different county within same state (%) - American Indian and Alaska Native
Geographical mobility - Moved from different county within same state (%) - Multirace
Geographical mobility - Moved from different county within same state (%) - Other Race
Geographical mobility - Moved from different state (%)
Geographical mobility - Moved from different state (%) - White
Geographical mobility - Moved from different state (%) - Black or African American
Geographical mobility - Moved from different state (%) - Asian
Geographical mobility - Moved from different state (%) - Hispanic or Latino
Geographical mobility - Moved from different state (%) - American Indian and Alaska Native
Geographical mobility - Moved from different state (%) - Multirace
Geographical mobility - Moved from different state (%) - Other Race
Geographical mobility - Moved from abroad (%)
Geographical mobility - Moved from abroad (%) - White
Geographical mobility - Moved from abroad (%) - Black or African American
Geographical mobility - Moved from abroad (%) - Asian
Geographical mobility - Moved from abroad (%) - Hispanic or Latino
Geographical mobility - Moved from abroad (%) - American Indian and Alaska Native
Geographical mobility - Moved from abroad (%) - Multirace
Geographical mobility - Moved from abroad (%) - Other Race
Place of birth for the foreign-born population - Ireland (%)
Place of birth for the foreign-born population - Denmark (%)
Place of birth for the foreign-born population - Norway (%)
Place of birth for the foreign-born population - Sweden (%)
Place of birth for the foreign-born population - United Kingdom (%)
Place of birth for the foreign-born population - England (%)
Place of birth for the foreign-born population - Scotland (%)
Place of birth for the foreign-born population - Other Northern Europe (%)
Place of birth for the foreign-born population - Austria (%)
Place of birth for the foreign-born population - Belgium (%)
Place of birth for the foreign-born population - France (%)
Place of birth for the foreign-born population - Germany (%)
Place of birth for the foreign-born population - Netherlands (%)
Place of birth for the foreign-born population - Switzerland (%)
Place of birth for the foreign-born population - Other Western Europe (%)
Place of birth for the foreign-born population - Greece (%)
Place of birth for the foreign-born population - Italy (%)
Place of birth for the foreign-born population - Portugal (%)
Place of birth for the foreign-born population - Spain (%)
Place of birth for the foreign-born population - Other Southern Europe (%)
Place of birth for the foreign-born population - Albania (%)
Place of birth for the foreign-born population - Belarus (%)
Place of birth for the foreign-born population - Bosnia and Herzegovina (%)
Place of birth for the foreign-born population - Bulgaria (%)
Place of birth for the foreign-born population - Croatia (%)
Place of birth for the foreign-born population - Czechoslovakia (%)
Place of birth for the foreign-born population - Hungary (%)
Place of birth for the foreign-born population - Latvia (%)
Place of birth for the foreign-born population - Lithuania (%)
Place of birth for the foreign-born population - North Macedonia (Macedonia) (%)
Place of birth for the foreign-born population - Moldova (%)
Place of birth for the foreign-born population - Poland (%)
Place of birth for the foreign-born population - Romania (%)
Place of birth for the foreign-born population - Russia (%)
Place of birth for the foreign-born population - Serbia (%)
Place of birth for the foreign-born population - Ukraine (%)
Place of birth for the foreign-born population - Other Eastern Europe (%)
Place of birth for the foreign-born population - China (%)
Place of birth for the foreign-born population - Hong Kong (%)
Place of birth for the foreign-born population - Taiwan (%)
Place of birth for the foreign-born population - Japan (%)
Place of birth for the foreign-born population - Korea (%)
Place of birth for the foreign-born population - Other Eastern Asia (%)
Place of birth for the foreign-born population - Afghanistan (%)
Place of birth for the foreign-born population - Bangladesh (%)
Place of birth for the foreign-born population - India (%)
Place of birth for the foreign-born population - Iran (%)
Place of birth for the foreign-born population - Kazakhstan (%)
Place of birth for the foreign-born population - Nepal (%)
Place of birth for the foreign-born population - Pakistan (%)
Place of birth for the foreign-born population - Sri Lanka (%)
Place of birth for the foreign-born population - Uzbekistan (%)
Place of birth for the foreign-born population - Other South Central Asia (%)
Place of birth for the foreign-born population - Burma (%)
Place of birth for the foreign-born population - Cambodia (%)
Place of birth for the foreign-born population - Indonesia (%)
Place of birth for the foreign-born population - Laos (%)
Place of birth for the foreign-born population - Malaysia (%)
Place of birth for the foreign-born population - Philippines (%)
Place of birth for the foreign-born population - Singapore (%)
Place of birth for the foreign-born population - Thailand (%)
Place of birth for the foreign-born population - Vietnam (%)
Place of birth for the foreign-born population - Other South Eastern Asia (%)
Place of birth for the foreign-born population - Armenia (%)
Place of birth for the foreign-born population - Iraq (%)
Place of birth for the foreign-born population - Israel (%)
Place of birth for the foreign-born population - Jordan (%)
Place of birth for the foreign-born population - Kuwait (%)
Place of birth for the foreign-born population - Lebanon (%)
Place of birth for the foreign-born population - Saudi Arabia (%)
Place of birth for the foreign-born population - Syria (%)
Place of birth for the foreign-born population - Turkey (%)
Place of birth for the foreign-born population - Yemen (%)
Place of birth for the foreign-born population - Other Western Asia (%)
Place of birth for the foreign-born population - Eritrea (%)
Place of birth for the foreign-born population - Ethiopia (%)
Place of birth for the foreign-born population - Kenya (%)
Place of birth for the foreign-born population - Somalia (%)
Place of birth for the foreign-born population - Uganda (%)
Place of birth for the foreign-born population - Zimbabwe (%)
Place of birth for the foreign-born population - Other Eastern Africa (%)
Place of birth for the foreign-born population - Cameroon (%)
Place of birth for the foreign-born population - Congo (%)
Place of birth for the foreign-born population - Democratic Republic of Congo (Zaire) (%)
Place of birth for the foreign-born population - Other Middle Africa (%)
Place of birth for the foreign-born population - Egypt (%)
Place of birth for the foreign-born population - Morocco (%)
Place of birth for the foreign-born population - Sudan (%)
Place of birth for the foreign-born population - Other Northern Africa (%)
Place of birth for the foreign-born population - South Africa (%)
Place of birth for the foreign-born population - Other Southern Africa (%)
Place of birth for the foreign-born population - Cabo Verde (%)
Place of birth for the foreign-born population - Ghana (%)
Place of birth for the foreign-born population - Liberia (%)
Place of birth for the foreign-born population - Nigeria (%)
Place of birth for the foreign-born population - Senegal (%)
Place of birth for the foreign-born population - Sierra Leone (%)
Place of birth for the foreign-born population - Other Western Africa (%)
Place of birth for the foreign-born population - Australia (%)
Place of birth for the foreign-born population - New Zealand (%)
Place of birth for the foreign-born population - Fiji (%)
Place of birth for the foreign-born population - Micronesia (%)
Place of birth for the foreign-born population - Bahamas (%)
Place of birth for the foreign-born population - Barbados (%)
Place of birth for the foreign-born population - Cuba (%)
Place of birth for the foreign-born population - Dominica (%)
Place of birth for the foreign-born population - Dominican Republic (%)
Place of birth for the foreign-born population - Grenada (%)
Place of birth for the foreign-born population - Haiti (%)
Place of birth for the foreign-born population - Jamaica (%)
Place of birth for the foreign-born population - St. Vincent and the Grenadines (%)
Place of birth for the foreign-born population - Trinidad and Tobago (%)
Place of birth for the foreign-born population - West Indies (%)
Place of birth for the foreign-born population - Other Caribbean (%)
Place of birth for the foreign-born population - Belize (%)
Place of birth for the foreign-born population - Costa Rica (%)
Place of birth for the foreign-born population - El Salvador (%)
Place of birth for the foreign-born population - Guatemala (%)
Place of birth for the foreign-born population - Honduras (%)
Place of birth for the foreign-born population - Mexico (%)
Place of birth for the foreign-born population - Nicaragua (%)
Place of birth for the foreign-born population - Panama (%)
Place of birth for the foreign-born population - Other Central America (%)
Place of birth for the foreign-born population - Argentina (%)
Place of birth for the foreign-born population - Bolivia (%)
Place of birth for the foreign-born population - Brazil (%)
Place of birth for the foreign-born population - Chile (%)
Place of birth for the foreign-born population - Colombia (%)
Place of birth for the foreign-born population - Ecuador (%)
Place of birth for the foreign-born population - Guyana (%)
Place of birth for the foreign-born population - Peru (%)
Place of birth for the foreign-born population - Uruguay (%)
Place of birth for the foreign-born population - Venezuela (%)
Place of birth for the foreign-born population - Other South America (%)
Place of birth for the foreign-born population - Canada (%)
Place of birth for the foreign-born population - Other Northern America (%)
Place of birth for the foreign-born population - Other (%)
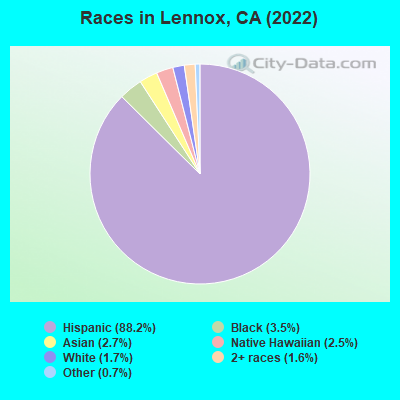
According to 2022 data, the most numerous races in Lennox, CA are Hispanic (19,994 residents), White alone (285 residents), and Asian alone (638 residents). 10.9% of Lennox residents speak English at home. 46.2% of Lennox, CA residents are foreign-born (42.7% born in Latin America), which is 43.8% greater than the foreign-born rate of 26.0% across the entire state of California.
Race distribution in Lennox
2000 2022
15,816,790 46.7% White alone 10,966,556 32.4% Hispanic 3,648,860 10.8% Asian alone 2,181,926 6.4% Black alone 903,115 2.7% Two or more races 178,984 0.5% American Indian alone 103,736 0.3% Native Hawaiian and Other 71,681 0.2% Other race alone
15,732,184 40.3% Hispanic 13,160,426 33.7% White alone 5,957,867 15.3% Asian alone 2,025,218 5.2% Black alone 1,663,222 4.3% Two or more races 251,618 0.6% Other race alone 135,777 0.3% Native Hawaiian and Other 103,030 0.3% American Indian alone
Income and house value in Lennox Median household income in 2022 $37,106 White non-Hispanic householders$45,822 Black householders$110,287 American Indian and Alaska Native householders$99,139 Asian householders$44,190 Native Hawaiian and other Pacific Islander householders$69,467 Some other race householders$72,021 Two or more races householders$68,145 Hispanic or Latino race householdersMedian 2022 house value $547,093 White Non-Hispanic householders$719,859 Black or African American householders$494,903 American Indian or Alaska Native householders $578,406 Asian householders$404,920 Native Hawaiian and other Pacific Islander householders$547,812 Some other race householders$538,454 Two or more races householders$555,731 Hispanic or Latino householders
Median age by race in Lennox
32.4 Median age for White residents30.2 33.7 30.7 Median age for Black or African American residents30.1 37.1 20.8 Median age for American Indian / Alaska Native residents36.4 20.7 39.2 Median age for Asian residents38.8 41.0 18.0 Median age for Native Hawaiian / Pacific Islander residents8.4 21.8 31.2 Median age for Other race residents30.0 32.4 33.9 Median age for Two or more races residents34.2 26.5 48.9 Median age for White alone residents49.4 45.0 31.4 Median age for Hispanic or Latino residents29.5 32.4
Owner/renter occupied households by race in Lennox
House owners and renters - White residents 748 32.6% Owner occupied1,546 67.4% Renter occupiedHouse owners and renters - Black or African American residents 37 16.2% Owner occupied193 83.8% Renter occupiedHouse owners and renters - American Indian / Alaska Native residents 26 43.6% Owner occupied34 56.4% Renter occupiedHouse owners and renters - Asian residents 109 67.6% Owner occupied52 32.4% Renter occupiedHouse owners and renters - Native Hawaiian / Pacific Islander residents 70 100.0% Renter occupiedHouse owners and renters - Other race residents 707 28.6% Owner occupied1,765 71.4% Renter occupiedHouse owners and renters - Two or more races residents 17 5.9% Owner occupied275 94.1% Renter occupiedHouse owners and renters - White alone residents 53 47.0% Owner occupied59 53.0% Renter occupiedHouse owners and renters - Hispanic or Latino residents 1,539 30.2% Owner occupied3,564 69.8% Renter occupied
Language usage in Lennox
English speakers - Total 10.9% of residents of Lennox speak English at home.
83.5% of residents speak Spanish at home 9,770 57.5% Speak English very well7,213 42.5% Speak English less than very well4.0% of residents speak other language at home 383 46.9% Speak English very well434 53.1% Speak English less than very well
English speakers - Born in the United States 52.4% of residents of Lennox speak English at home.
40.1% of residents speak Spanish at home 145 92.9% Speak English very well11 7.1% Speak English less than very well8.0% of residents speak other language at home 31 100.0% Speak English very well
English speakers - Native, born elsewhere 1.2% of residents of Lennox speak English at home.
85.2% of residents speak Spanish at home 64 46.4% Speak English very well74 53.6% Speak English less than very well13.6% of residents speak other language at home 22 100.0% Speak English very well
English speakers - Foreign-born 4.1% of residents of Lennox speak English at home.
86.4% of residents speak Spanish at home 1,998 23.6% Speak English very well6,478 76.4% Speak English less than very well6.1% of residents speak other language at home 170 28.3% Speak English very well430 71.7% Speak English less than very well
White (Caucasian) - Speak only English Native:
13.1% (538)Foreign-born:
2.4% (76)
White (Caucasian) - Speak another language Native:
68.4% (2,810)Foreign-born:
93.2% (3,008)
Black or African American - Speak another language Native:
5.3% (31)Foreign-born:
100.0% (149)
American Indian / Alaska Native - Speak another language Native:
96.7% (148)Foreign-born:
99.6% (128)
Asian - Speak only English Native:
50.5% (59)Foreign-born:
17.1% (76)
Asian - Speak another language Native:
49.0% (58)Foreign-born:
83.5% (371)
Native Hawaiian / Pacific Islander - Speak another language Native:
47.4% (72)Foreign-born:
97.0% (174)
Other race - Speak only English Native:
10.4% (527)Foreign-born:
6.5% (285)
Other race - Speak another language Native:
86.6% (4,386)Foreign-born:
93.7% (4,108)
Two or more races - Speak only English Native:
36.7% (190)Foreign-born:
4.3% (30)
Two or more races - Speak another language Native:
100.0% (516)Foreign-born:
100.0% (707)
White alone - Speak only English Native:
90.0% (224)Foreign-born:
41.8% (16)
White alone - Speak another language Native:
10.2% (25)Foreign-born:
57.2% (22)
Hispanic or Latino - Speak only English Native:
9.6% (939)Foreign-born:
3.9% (338)
Hispanic or Latino - Speak another language Native:
87.5% (8,604)Foreign-born:
95.7% (8,291)
Foreign-born residents in Lennox 10,063 residents are foreign born (42.7% Latin America ).
This city:
46.2%California:
100.0%
Marital status for residents in Lennox Marital status - White (Caucasian) population 15 years and over
Males 47.0% Never married46.1% Now married0.7% Separated1.3% Widowed4.9% DivorcedFemales 42.0% Never married42.3% Now married2.5% Separated5.4% Widowed7.9% DivorcedWomen who gave birth in the past 12 months Now married:
43.7% (70)Unmarried:
56.3% (91)
Women who did not give birth in the past 12 months Now married:
39.0% (801)Unmarried:
61.0% (1,252)
Marital status - Black or African American population 15 years and over
Males 57.4% Never married36.6% Now married0.0% Separated2.7% Widowed3.3% DivorcedFemales 43.0% Never married34.9% Now married6.0% Separated5.6% Widowed10.6% DivorcedWomen who gave birth in the past 12 months Now married:
0.0% (0)Unmarried:
100.0% (10)
Women who did not give birth in the past 12 months Now married:
38.9% (60)Unmarried:
61.1% (94)
Marital status - American Indian / Alaska Native population 15 years and over
Males 20.0% Never married80.0% Now married0.0% Separated0.0% Widowed0.0% DivorcedFemales 46.3% Never married53.7% Now married0.0% Separated0.0% Widowed0.0% DivorcedWomen who did not give birth in the past 12 months Now married:
44.4% (29)Unmarried:
55.6% (36)
Marital status - Asian population 15 years and over
Males 61.3% Never married38.7% Now married0.0% Separated0.0% Widowed0.0% DivorcedFemales 27.8% Never married38.0% Now married10.8% Separated6.9% Widowed16.5% DivorcedWomen who did not give birth in the past 12 months Now married:
38.7% (76)Unmarried:
61.3% (121)
Marital status - Native Hawaiian / Pacific Islander population 15 years and over
Males 0.0% Never married100.0% Now married0.0% Separated0.0% Widowed0.0% DivorcedFemales 64.2% Never married17.9% Now married17.9% Separated0.0% Widowed0.0% DivorcedWomen who did not give birth in the past 12 months Now married:
21.8% (30)Unmarried:
78.2% (107)
Marital status - Other race population 15 years and over
Males 51.2% Never married40.1% Now married4.3% Separated1.0% Widowed3.4% DivorcedFemales 45.1% Never married39.5% Now married5.7% Separated1.7% Widowed8.1% DivorcedWomen who gave birth in the past 12 months Now married:
50.0% (72)Unmarried:
50.0% (72)
Women who did not give birth in the past 12 months Now married:
38.2% (973)Unmarried:
61.8% (1,572)
Marital status - Two or more races population 15 years and over
Males 50.0% Never married50.0% Now married0.0% Separated0.0% Widowed0.0% DivorcedFemales 31.1% Never married62.1% Now married6.8% Separated0.0% Widowed0.0% DivorcedWomen who gave birth in the past 12 months Now married:
100.0% (44)Unmarried:
0.0% (0)
Women who did not give birth in the past 12 months Now married:
52.2% (103)Unmarried:
47.8% (94)
Marital status - White alone, not Hispanic / Latino population 15 years and over
Males 63.8% Never married22.2% Now married0.0% Separated3.8% Widowed10.3% DivorcedFemales 18.1% Never married27.7% Now married0.0% Separated10.8% Widowed43.4% DivorcedWomen who did not give birth in the past 12 months Now married:
0.0% (0)Unmarried:
100.0% (30)
Marital status - Hispanic or Latino population 15 years and over
Males 48.6% Never married44.0% Now married2.4% Separated1.0% Widowed3.9% DivorcedFemales 43.3% Never married42.1% Now married4.2% Separated3.6% Widowed6.8% DivorcedWomen who gave birth in the past 12 months Now married:
48.5% (172)Unmarried:
51.5% (183)
Women who did not give birth in the past 12 months Now married:
39.8% (1,990)Unmarried:
60.2% (3,014)
Ancestries in Lennox
555 3.3% American28 0.2% German14 0.08% English11 0.06% Russian10 0.06% Armenian9 0.05% British8 0.05% Eastern European8 0.05% Scottish6 0.04% Scotch-Irish
Children Nativity (place of birth) in Lennox
Children under 6 years - Living with two parents Both parents native 280 100.0% Native0 0.0% Foreign-bornBoth parents foreign-born 285 96.1% Native12 3.9% Foreign-bornOne native, one foreign-born parent 329 100.0% NativeChildren under 6 years - Living with one parent Native parent 407 97.3% Native11 2.7% Foreign-bornForeign-born parent 281 93.3% Native20 6.7% Foreign-bornChildren 6 to 17 years - Living with two parents Both parents native 456 100.0% NativeBoth parents foreign-born 1,292 83.1% Native263 16.9% Foreign-bornOne native, one foreign-born parent 530 100.0% NativeChildren 6 to 17 years - Living with one parent Native parent 291 100.0% NativeForeign-born parent 1,035 54.4% Native866 45.6% Foreign-born
Grandparents responsible for own grandchildren in Lennox
Grandparents (30 to 59 years) White / Caucasian 22 22.7% Responsible for grandchildren74 77.3% Not responsible for grandchildrenBlack or African American 7 100.0% Responsible for grandchildrenOther race 10 4.6% Responsible for grandchildren204 95.4% Not responsible for grandchildrenHispanic or Latino 43 12.4% Responsible for grandchildren303 87.6% Not responsible for grandchildrenGrandparents (60 years and over) White / Caucasian 36 30.2% Responsible for grandchildren84 69.8% Not responsible for grandchildrenBlack or African American 22 100.0% Not responsible for grandchildrenOther race 24 13.3% Responsible for grandchildren156 86.7% Not responsible for grandchildrenHispanic or Latino 56 18.2% Responsible for grandchildren250 81.8% Not responsible for grandchildren