Races in Lenroot, Wisconsin (WI) Detailed Stats
Ancestries, Foreign-born residents, place of birth
1.6% of Lenroot, WI residents are foreign-born , which is 206.6% less than the foreign-born rate of 5.0% across the entire state of Wisconsin.
Race distribution in Lenroot

- 1,12396.4%White alone
- 191.6%American Indian alone
- 181.5%Two or more races
- 30.3%Asian alone
- 20.2%Hispanic

2000
2022
-
- 4,681,63087.3%White alone
- 300,2455.6%Black alone
- 192,9213.6%Hispanic
- 87,9951.6%Asian alone
- 51,9211.0%Two or more races
- 43,9800.8%American Indian alone
- 3,6370.07%Other race alone
- 1,3460.03%Native Hawaiian and Other
Pacific Islander alone

-
- 4,654,03179.0%White alone
- 447,0227.6%Hispanic
- 345,6785.9%Black alone
- 217,5323.7%Two or more races
- 172,2422.9%Asian alone
- 33,7620.6%American Indian alone
- 19,6800.3%Other race alone
- 2,5920.04%Native Hawaiian and Other
Pacific Islander alone

Income and house value in Lenroot
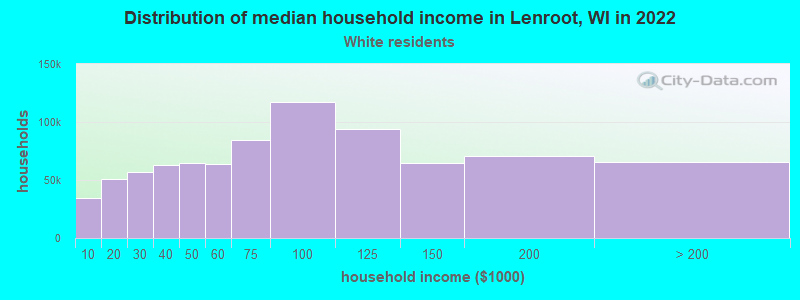
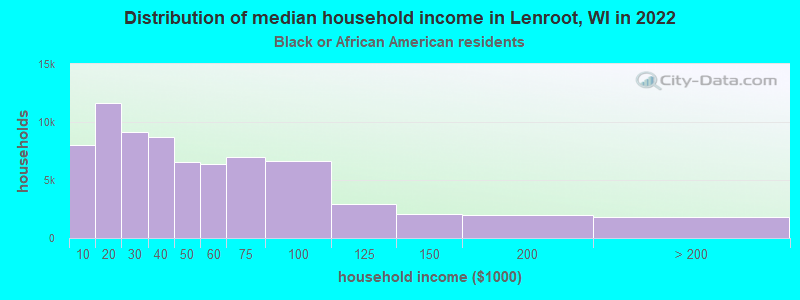
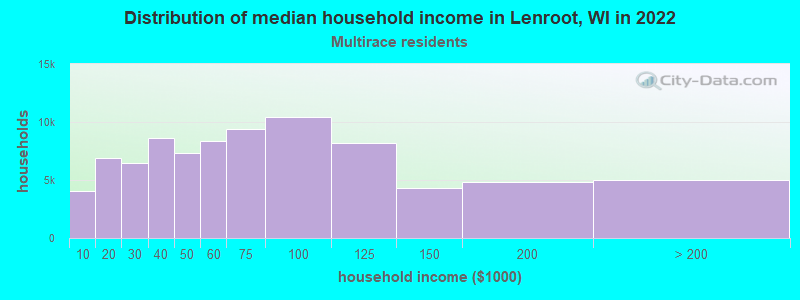
- Median household income in 2022
- $60,185White non-Hispanic householders
- $11,240Black householders
- $78,168Two or more races householders
- Median 2022 house value
- $290,019White Non-Hispanic householders
- $210,158Two or more races householders
Household income for White non-Hispanic householders
Household income for Black householders
Household income for Two or more races householders
Foreign-born residents in Lenroot
19 residents are foreign born
| This city: | 1.6% |
| Wisconsin: | 3.6% |
Ancestries in Lenroot

- 40531.3%German
- 15011.6%Irish
- 14511.2%Norwegian
- 1068.2%Other
- 947.3%Swedish
- 796.1%English
- 614.7%Danish
- 604.6%Polish
- 403.1%Czech
- 272.1%French
- 221.7%Scottish
- 211.6%Dutch
- 191.5%United States
- 171.3%Italian
- 120.9%French Canadian
- 120.9%Lithuanian
- 50.4%Welsh
- 40.3%Russian
- 30.2%Subsaharan African
- 30.2%Swiss
- 30.2%Ukrainian
- 20.2%Hungarian
- 20.2%Portuguese

Zip codes: 54843.