Races in Leon, Wisconsin (WI) Detailed Stats
Ancestries, Foreign-born residents, place of birth

Recent posts about races in Leon, Wisconsin on our local forum with over 2,400,000 registered users:
 | The Safe House (7 replies) |
| Visitor Recommendations??? (5 replies) |
| A couple days in/near Milwaukee (17 replies) |
| You can't call yourself a real Milwaukeean until you've.... (42 replies) |
| Things truly Wisconsin, or originally Wisconsin (210 replies) |
| Visiting Milwaukee for a night - Where to stay and What to do?? (8 replies) |
2.0% of Leon, WI residents are foreign-born , which is 156.2% less than the foreign-born rate of 5.0% across the entire state of Wisconsin.
Race distribution in Leon

- 1,25898.2%White alone
- 90.7%Hispanic
- 90.7%Two or more races
- 50.4%American Indian alone

2000
2022
-
- 4,681,63087.3%White alone
- 300,2455.6%Black alone
- 192,9213.6%Hispanic
- 87,9951.6%Asian alone
- 51,9211.0%Two or more races
- 43,9800.8%American Indian alone
- 3,6370.07%Other race alone
- 1,3460.03%Native Hawaiian and Other
Pacific Islander alone

-
- 4,654,03179.0%White alone
- 447,0227.6%Hispanic
- 345,6785.9%Black alone
- 217,5323.7%Two or more races
- 172,2422.9%Asian alone
- 33,7620.6%American Indian alone
- 19,6800.3%Other race alone
- 2,5920.04%Native Hawaiian and Other
Pacific Islander alone

Income and house value in Leon
- Median household income in 2022
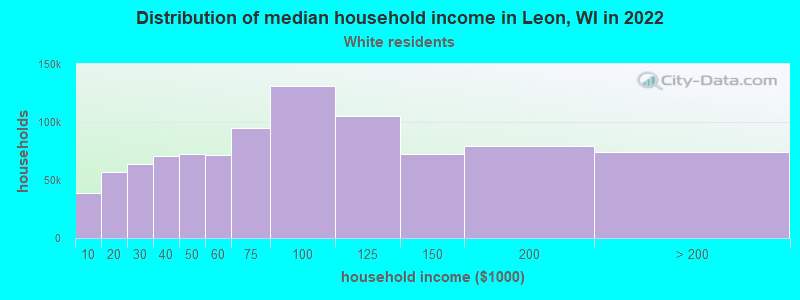
- $67,771White non-Hispanic householders
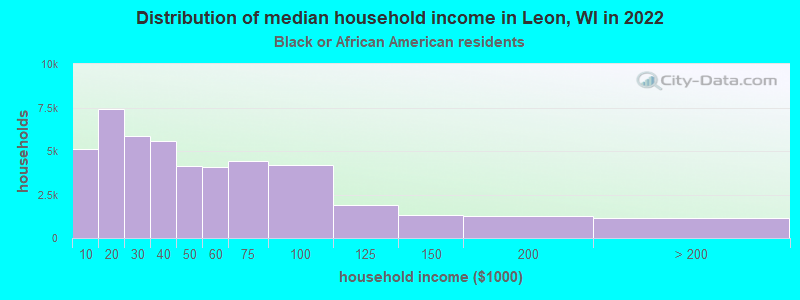
- $7,153Black householders
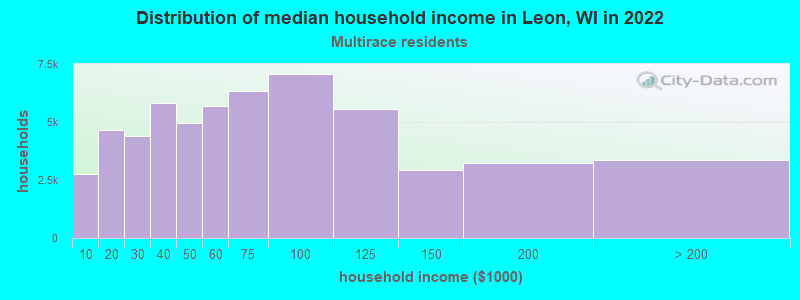
- $52,816Two or more races householders
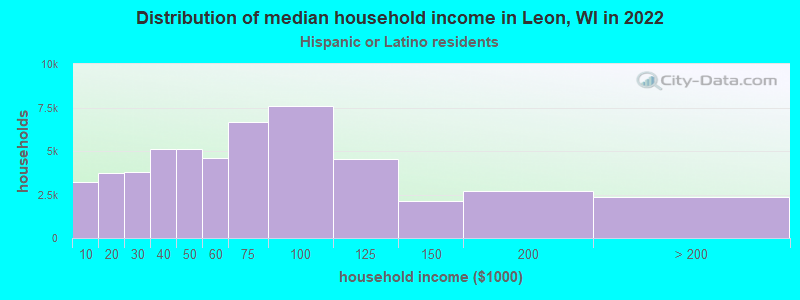
- $47,508Hispanic or Latino race householders
- Median 2022 house value
- $193,815White Non-Hispanic householders
- $186,361Two or more races householders
- $120,586Hispanic or Latino householders
Household income for White non-Hispanic householders
Household income for Black householders
Household income for Two or more races householders
Household income for Hispanic or Latino race householders
Foreign-born residents in Leon
25 residents are foreign born
| This city: | 2.0% |
| Wisconsin: | 3.6% |
Ancestries in Leon

- 66543.0%German
- 1509.7%Polish
- 1227.9%English
- 1087.0%Irish
- 664.3%Other
- 654.2%Norwegian
- 593.8%Danish
- 553.6%French
- 493.2%United States
- 332.1%Czech
- 251.6%Dutch
- 251.6%Italian
- 231.5%Hungarian
- 231.5%Scottish
- 201.3%Swedish
- 201.3%Welsh
- 130.8%Swiss
- 90.6%French Canadian
- 60.4%Arab
- 40.3%Greek
- 40.3%Scotch-Irish
- 30.2%Ukrainian
- 10.06%Russian
