Races in Lindley, New York (NY) Detailed Stats
Ancestries, Foreign-born residents, place of birth

Discuss Lindley, New York races on our local forum with over 2,400,000 registered users
1.2% of Lindley, NY residents are foreign-born , which is 1813.0% less than the foreign-born rate of 22.0% across the entire state of New York.
Race distribution in Lindley

- 1,87397.9%White alone
- 130.7%Hispanic
- 130.7%Two or more races
- 60.3%Black alone
- 30.2%Asian alone
- 40.2%American Indian alone
- 10.05%Other race alone

2000
2022
-
- 11,760,98162.0%White alone
- 2,867,58315.1%Hispanic
- 2,812,62314.8%Black alone
- 1,035,9265.5%Asian alone
- 366,1161.9%Two or more races
- 75,4990.4%Other race alone
- 52,4990.3%American Indian alone
- 5,2300.03%Native Hawaiian and Other
Pacific Islander alone

-
- 10,408,93352.9%White alone
- 3,867,29919.7%Hispanic
- 2,633,84013.4%Black alone
- 1,776,2869.0%Asian alone
- 732,6703.7%Two or more races
- 216,1101.1%Other race alone
- 35,0820.2%American Indian alone
- 6,9310.04%Native Hawaiian and Other
Pacific Islander alone

Income and house value in Lindley
- Median household income in 2022
- $63,023White non-Hispanic householders
- $152,733Black householders
- over $200,000Asian householders
- $42,933Some other race householders
- $142,427Two or more races householders
- $95,163Hispanic or Latino race householders
- Median 2022 house value
- $140,620White Non-Hispanic householders
- $73,751Black or African American householders
- $442,511Asian householders
- $167,171Two or more races householders
Household income for White non-Hispanic householders

Household income for Black householders

Household income for Asian householders

Household income for Two or more races householders

Household income for Hispanic or Latino race householders

Foreign-born residents in Lindley
22 residents are foreign born
| This city: | 1.2% |
| New York: | 20.4% |
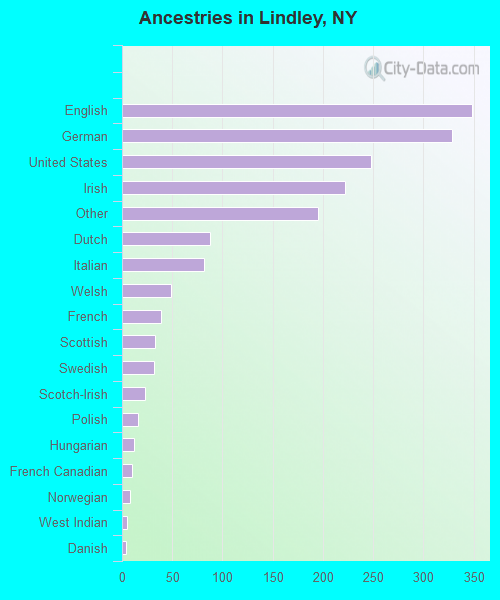
Ancestries in Lindley

- 34819.9%English
- 32918.8%German
- 24814.2%United States
- 22212.7%Irish
- 19511.1%Other
- 885.0%Dutch
- 824.7%Italian
- 492.8%Welsh
- 392.2%French
- 331.9%Scottish
- 321.8%Swedish
- 231.3%Scotch-Irish
- 160.9%Polish
- 120.7%Hungarian
- 100.6%French Canadian
- 80.5%Norwegian
- 50.3%West Indian
- 40.2%Danish
- 30.2%Lithuanian
- 30.2%Slovak
- 10.06%Russian
Zip codes: 14858.