Races in Live Oak, Texas (TX) Detailed Stats
Data:
Races - White alone (%)
Races - White alone (% change since 2000)
Races - Black alone (%)
Races - Black alone (% change since 2000)
Races - American Indian alone (%)
Races - American Indian alone (% change since 2000)
Races - Asian alone (%)
Races - Asian alone (% change since 2000)
Races - Hispanic (%)
Races - Hispanic (% change since 2000)
Races - Native Hawaiian and Other Pacific Islander alone (%)
Races - Native Hawaiian and Other Pacific Islander alone (% change since 2000)
Races - Two or more races(%)
Races - Two or more races(% change since 2000)
Races - Other race alone (%)
Races - Other race alone (% change since 2000)
Racial diversity
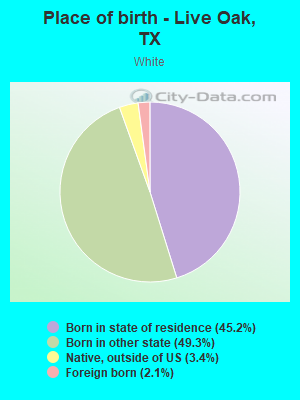
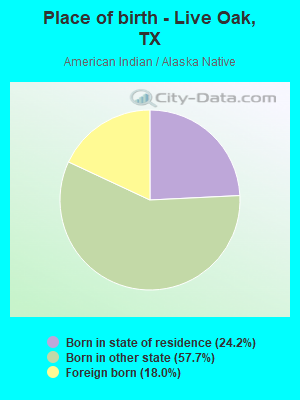
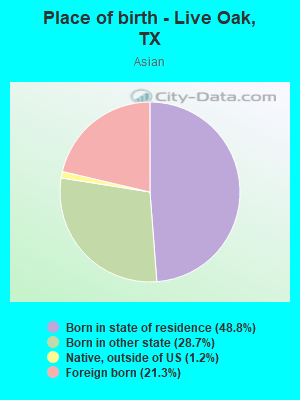
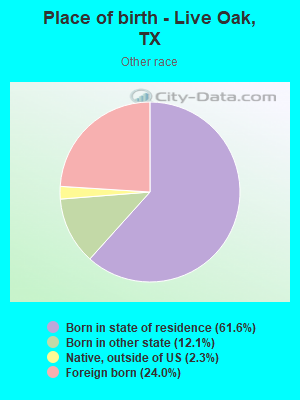
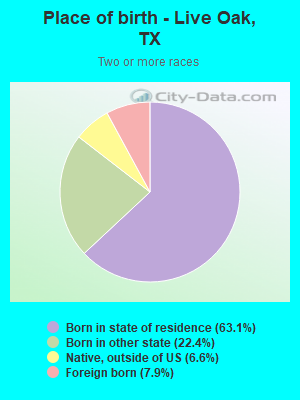
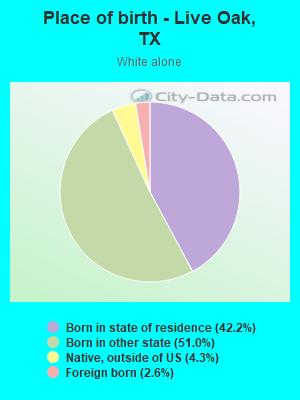
Place of birth - Born in state of residence (%)
Place of birth - Born in state of residence (%) - White
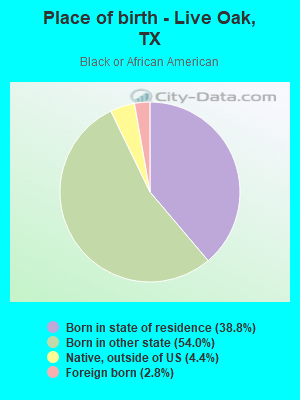
Place of birth - Born in state of residence (%) - Black or African American
Place of birth - Born in state of residence (%) - Asian
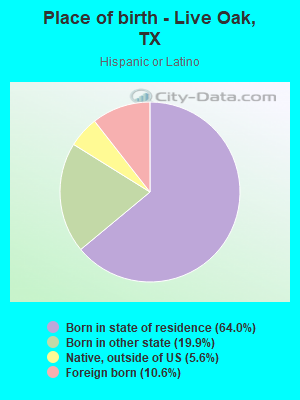
Place of birth - Born in state of residence (%) - Hispanic or Latino
Place of birth - Born in state of residence (%) - American Indian and Alaska Native
Place of birth - Born in state of residence (%) - Multirace
Place of birth - Born in state of residence (%) - Other Race
Place of birth - Born in other state (%)
Place of birth - Born in other state (%) - White
Place of birth - Born in other state (%) - Black or African American
Place of birth - Born in other state (%) - Asian
Place of birth - Born in other state (%) - Hispanic or Latino
Place of birth - Born in other state (%) - American Indian and Alaska Native
Place of birth - Born in other state (%) - Multirace
Place of birth - Born in other state (%) - Other Race
Place of birth - Native, outside of US (%)
Place of birth - Native, outside of US (%) - White
Place of birth - Native, outside of US (%) - Black or African American
Place of birth - Native, outside of US (%) - Asian
Place of birth - Native, outside of US (%) - Hispanic or Latino
Place of birth - Native, outside of US (%) - American Indian and Alaska Native
Place of birth - Native, outside of US (%) - Multirace
Place of birth - Native, outside of US (%) - Other Race
Place of birth - Foreign born (%)
Place of birth - Foreign born (%) - White
Place of birth - Foreign born (%) - Black or African American
Place of birth - Foreign born (%) - Asian
Place of birth - Foreign born (%) - Hispanic or Latino
Place of birth - Foreign born (%) - American Indian and Alaska Native
Place of birth - Foreign born (%) - Multirace
Place of birth - Foreign born (%) - Other Race
Residents speaking English at home (%)
Residents speaking English at home - Born in the United States (%)
Residents speaking English at home - Native, born elsewhere (%)
Residents speaking English at home - Foreign born (%)
Residents speaking Spanish at home (%)
Residents speaking Spanish at home - Born in the United States (%)
Residents speaking Spanish at home - Native, born elsewhere (%)
Residents speaking Spanish at home - Foreign born (%)
Residents speaking other language at home (%)
Residents speaking other language at home - Born in the United States (%)
Residents speaking other language at home - Native, born elsewhere (%)
Residents speaking other language at home - Foreign born (%)
Marital status - Never married (%)
Marital status - Now married (%)
Marital status - Separated (%)
Marital status - Widowed (%)
Marital status - Divorced (%)
Ancestries Reported - Arab (%)
Ancestries Reported - Czech (%)
Ancestries Reported - Danish (%)
Ancestries Reported - Dutch (%)
Ancestries Reported - English (%)
Ancestries Reported - French (%)
Ancestries Reported - French Canadian (%)
Ancestries Reported - German (%)
Ancestries Reported - Greek (%)
Ancestries Reported - Hungarian (%)
Ancestries Reported - Irish (%)
Ancestries Reported - Italian (%)
Ancestries Reported - Lithuanian (%)
Ancestries Reported - Norwegian (%)
Ancestries Reported - Polish (%)
Ancestries Reported - Portuguese (%)
Ancestries Reported - Russian (%)
Ancestries Reported - Scotch-Irish (%)
Ancestries Reported - Scottish (%)
Ancestries Reported - Slovak (%)
Ancestries Reported - Subsaharan African (%)
Ancestries Reported - Swedish (%)
Ancestries Reported - Swiss (%)
Ancestries Reported - Ukrainian (%)
Ancestries Reported - United States (%)
Ancestries Reported - Welsh (%)
Ancestries Reported - West Indian (%)
Ancestries Reported - Other (%)
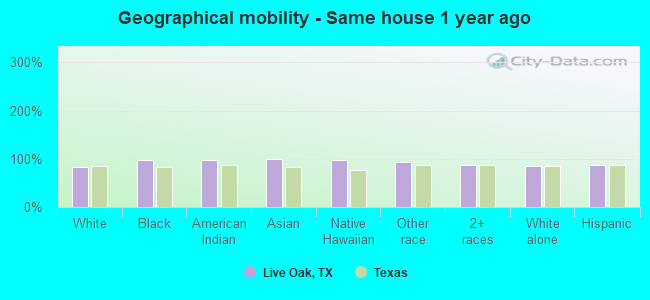
Geographical mobility - Same house 1 year ago (%)
Geographical mobility - Same house 1 year ago (%) - White
Geographical mobility - Same house 1 year ago (%) - Black or African American
Geographical mobility - Same house 1 year ago (%) - Asian
Geographical mobility - Same house 1 year ago (%) - Hispanic or Latino
Geographical mobility - Same house 1 year ago (%) - American Indian and Alaska Native
Geographical mobility - Same house 1 year ago (%) - Multirace
Geographical mobility - Same house 1 year ago (%) - Other Race
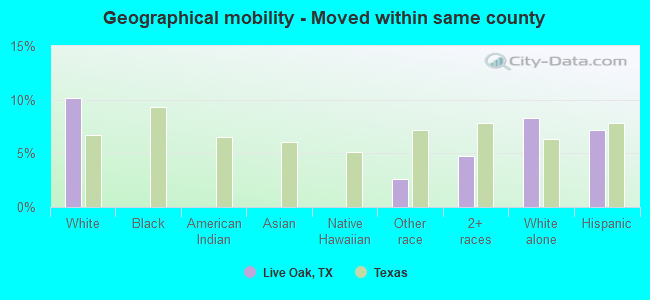
Geographical mobility - Moved within same county (%)
Geographical mobility - Moved within same county (%) - White
Geographical mobility - Moved within same county (%) - Black or African American
Geographical mobility - Moved within same county (%) - Asian
Geographical mobility - Moved within same county (%) - Hispanic or Latino
Geographical mobility - Moved within same county (%) - American Indian and Alaska Native
Geographical mobility - Moved within same county (%) - Multirace
Geographical mobility - Moved within same county (%) - Other Race
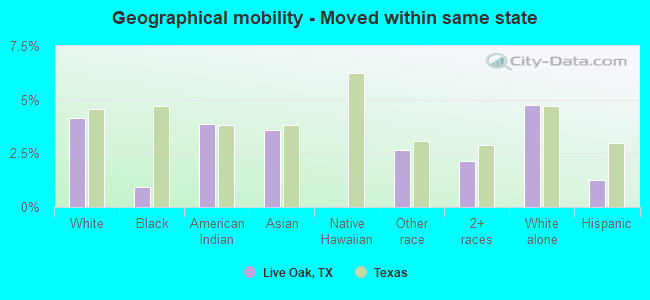
Geographical mobility - Moved from different county within same state (%)
Geographical mobility - Moved from different county within same state (%) - White
Geographical mobility - Moved from different county within same state (%) - Black or African American
Geographical mobility - Moved from different county within same state (%) - Asian
Geographical mobility - Moved from different county within same state (%) - Hispanic or Latino
Geographical mobility - Moved from different county within same state (%) - American Indian and Alaska Native
Geographical mobility - Moved from different county within same state (%) - Multirace
Geographical mobility - Moved from different county within same state (%) - Other Race
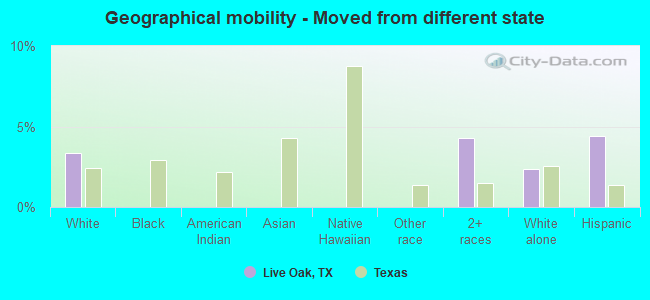
Geographical mobility - Moved from different state (%)
Geographical mobility - Moved from different state (%) - White
Geographical mobility - Moved from different state (%) - Black or African American
Geographical mobility - Moved from different state (%) - Asian
Geographical mobility - Moved from different state (%) - Hispanic or Latino
Geographical mobility - Moved from different state (%) - American Indian and Alaska Native
Geographical mobility - Moved from different state (%) - Multirace
Geographical mobility - Moved from different state (%) - Other Race
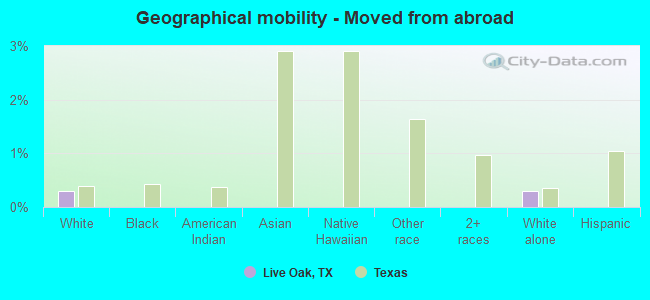
Geographical mobility - Moved from abroad (%)
Geographical mobility - Moved from abroad (%) - White
Geographical mobility - Moved from abroad (%) - Black or African American
Geographical mobility - Moved from abroad (%) - Asian
Geographical mobility - Moved from abroad (%) - Hispanic or Latino
Geographical mobility - Moved from abroad (%) - American Indian and Alaska Native
Geographical mobility - Moved from abroad (%) - Multirace
Geographical mobility - Moved from abroad (%) - Other Race
Place of birth for the foreign-born population - Ireland (%)
Place of birth for the foreign-born population - Denmark (%)
Place of birth for the foreign-born population - Norway (%)
Place of birth for the foreign-born population - Sweden (%)
Place of birth for the foreign-born population - United Kingdom (%)
Place of birth for the foreign-born population - England (%)
Place of birth for the foreign-born population - Scotland (%)
Place of birth for the foreign-born population - Other Northern Europe (%)
Place of birth for the foreign-born population - Austria (%)
Place of birth for the foreign-born population - Belgium (%)
Place of birth for the foreign-born population - France (%)
Place of birth for the foreign-born population - Germany (%)
Place of birth for the foreign-born population - Netherlands (%)
Place of birth for the foreign-born population - Switzerland (%)
Place of birth for the foreign-born population - Other Western Europe (%)
Place of birth for the foreign-born population - Greece (%)
Place of birth for the foreign-born population - Italy (%)
Place of birth for the foreign-born population - Portugal (%)
Place of birth for the foreign-born population - Spain (%)
Place of birth for the foreign-born population - Other Southern Europe (%)
Place of birth for the foreign-born population - Albania (%)
Place of birth for the foreign-born population - Belarus (%)
Place of birth for the foreign-born population - Bosnia and Herzegovina (%)
Place of birth for the foreign-born population - Bulgaria (%)
Place of birth for the foreign-born population - Croatia (%)
Place of birth for the foreign-born population - Czechoslovakia (%)
Place of birth for the foreign-born population - Hungary (%)
Place of birth for the foreign-born population - Latvia (%)
Place of birth for the foreign-born population - Lithuania (%)
Place of birth for the foreign-born population - North Macedonia (Macedonia) (%)
Place of birth for the foreign-born population - Moldova (%)
Place of birth for the foreign-born population - Poland (%)
Place of birth for the foreign-born population - Romania (%)
Place of birth for the foreign-born population - Russia (%)
Place of birth for the foreign-born population - Serbia (%)
Place of birth for the foreign-born population - Ukraine (%)
Place of birth for the foreign-born population - Other Eastern Europe (%)
Place of birth for the foreign-born population - China (%)
Place of birth for the foreign-born population - Hong Kong (%)
Place of birth for the foreign-born population - Taiwan (%)
Place of birth for the foreign-born population - Japan (%)
Place of birth for the foreign-born population - Korea (%)
Place of birth for the foreign-born population - Other Eastern Asia (%)
Place of birth for the foreign-born population - Afghanistan (%)
Place of birth for the foreign-born population - Bangladesh (%)
Place of birth for the foreign-born population - India (%)
Place of birth for the foreign-born population - Iran (%)
Place of birth for the foreign-born population - Kazakhstan (%)
Place of birth for the foreign-born population - Nepal (%)
Place of birth for the foreign-born population - Pakistan (%)
Place of birth for the foreign-born population - Sri Lanka (%)
Place of birth for the foreign-born population - Uzbekistan (%)
Place of birth for the foreign-born population - Other South Central Asia (%)
Place of birth for the foreign-born population - Burma (%)
Place of birth for the foreign-born population - Cambodia (%)
Place of birth for the foreign-born population - Indonesia (%)
Place of birth for the foreign-born population - Laos (%)
Place of birth for the foreign-born population - Malaysia (%)
Place of birth for the foreign-born population - Philippines (%)
Place of birth for the foreign-born population - Singapore (%)
Place of birth for the foreign-born population - Thailand (%)
Place of birth for the foreign-born population - Vietnam (%)
Place of birth for the foreign-born population - Other South Eastern Asia (%)
Place of birth for the foreign-born population - Armenia (%)
Place of birth for the foreign-born population - Iraq (%)
Place of birth for the foreign-born population - Israel (%)
Place of birth for the foreign-born population - Jordan (%)
Place of birth for the foreign-born population - Kuwait (%)
Place of birth for the foreign-born population - Lebanon (%)
Place of birth for the foreign-born population - Saudi Arabia (%)
Place of birth for the foreign-born population - Syria (%)
Place of birth for the foreign-born population - Turkey (%)
Place of birth for the foreign-born population - Yemen (%)
Place of birth for the foreign-born population - Other Western Asia (%)
Place of birth for the foreign-born population - Eritrea (%)
Place of birth for the foreign-born population - Ethiopia (%)
Place of birth for the foreign-born population - Kenya (%)
Place of birth for the foreign-born population - Somalia (%)
Place of birth for the foreign-born population - Uganda (%)
Place of birth for the foreign-born population - Zimbabwe (%)
Place of birth for the foreign-born population - Other Eastern Africa (%)
Place of birth for the foreign-born population - Cameroon (%)
Place of birth for the foreign-born population - Congo (%)
Place of birth for the foreign-born population - Democratic Republic of Congo (Zaire) (%)
Place of birth for the foreign-born population - Other Middle Africa (%)
Place of birth for the foreign-born population - Egypt (%)
Place of birth for the foreign-born population - Morocco (%)
Place of birth for the foreign-born population - Sudan (%)
Place of birth for the foreign-born population - Other Northern Africa (%)
Place of birth for the foreign-born population - South Africa (%)
Place of birth for the foreign-born population - Other Southern Africa (%)
Place of birth for the foreign-born population - Cabo Verde (%)
Place of birth for the foreign-born population - Ghana (%)
Place of birth for the foreign-born population - Liberia (%)
Place of birth for the foreign-born population - Nigeria (%)
Place of birth for the foreign-born population - Senegal (%)
Place of birth for the foreign-born population - Sierra Leone (%)
Place of birth for the foreign-born population - Other Western Africa (%)
Place of birth for the foreign-born population - Australia (%)
Place of birth for the foreign-born population - New Zealand (%)
Place of birth for the foreign-born population - Fiji (%)
Place of birth for the foreign-born population - Micronesia (%)
Place of birth for the foreign-born population - Bahamas (%)
Place of birth for the foreign-born population - Barbados (%)
Place of birth for the foreign-born population - Cuba (%)
Place of birth for the foreign-born population - Dominica (%)
Place of birth for the foreign-born population - Dominican Republic (%)
Place of birth for the foreign-born population - Grenada (%)
Place of birth for the foreign-born population - Haiti (%)
Place of birth for the foreign-born population - Jamaica (%)
Place of birth for the foreign-born population - St. Vincent and the Grenadines (%)
Place of birth for the foreign-born population - Trinidad and Tobago (%)
Place of birth for the foreign-born population - West Indies (%)
Place of birth for the foreign-born population - Other Caribbean (%)
Place of birth for the foreign-born population - Belize (%)
Place of birth for the foreign-born population - Costa Rica (%)
Place of birth for the foreign-born population - El Salvador (%)
Place of birth for the foreign-born population - Guatemala (%)
Place of birth for the foreign-born population - Honduras (%)
Place of birth for the foreign-born population - Mexico (%)
Place of birth for the foreign-born population - Nicaragua (%)
Place of birth for the foreign-born population - Panama (%)
Place of birth for the foreign-born population - Other Central America (%)
Place of birth for the foreign-born population - Argentina (%)
Place of birth for the foreign-born population - Bolivia (%)
Place of birth for the foreign-born population - Brazil (%)
Place of birth for the foreign-born population - Chile (%)
Place of birth for the foreign-born population - Colombia (%)
Place of birth for the foreign-born population - Ecuador (%)
Place of birth for the foreign-born population - Guyana (%)
Place of birth for the foreign-born population - Peru (%)
Place of birth for the foreign-born population - Uruguay (%)
Place of birth for the foreign-born population - Venezuela (%)
Place of birth for the foreign-born population - Other South America (%)
Place of birth for the foreign-born population - Canada (%)
Place of birth for the foreign-born population - Other Northern America (%)
Place of birth for the foreign-born population - Other (%)
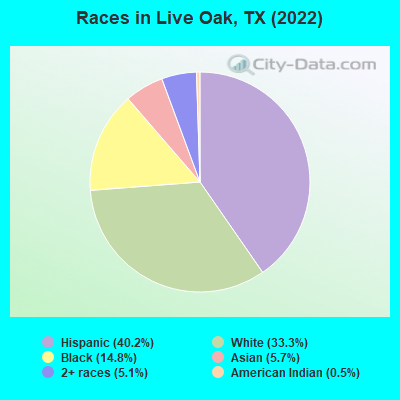
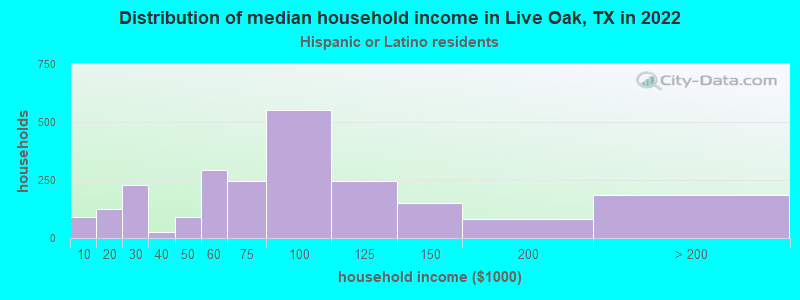
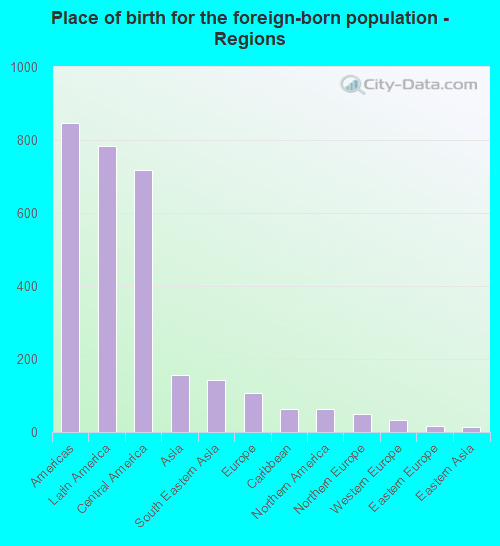
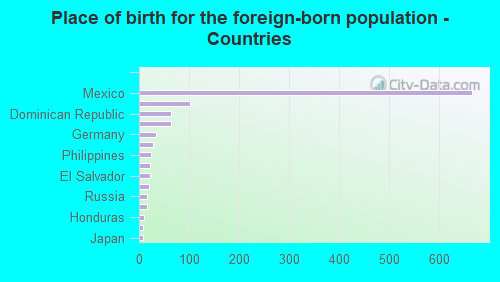
According to 2022 data, the most numerous races in Live Oak, TX are Hispanic (6,466 residents), White alone (5,349 residents), and Black alone (2,385 residents). 77.7% of Live Oak residents speak English at home. 6.9% of Live Oak, TX residents are foreign-born (4.8% born in Latin America, 1.0% born in Asia), which is 146.3% less than the foreign-born rate of 17.0% across the entire state of Texas.
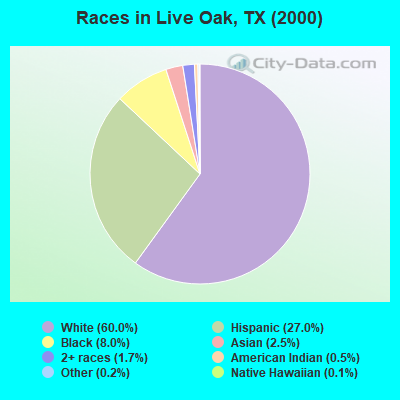
Race distribution in Live Oak
2000 2022
10,933,313 52.4% White alone 6,669,666 32.0% Hispanic 2,364,255 11.3% Black alone 554,445 2.7% Asian alone 230,567 1.1% Two or more races 68,859 0.3% American Indian alone 19,958 0.10% Other race alone 10,757 0.05% Native Hawaiian and Other
12,070,642 40.2% Hispanic 11,683,430 38.9% White alone 3,508,706 11.7% Black alone 1,608,173 5.4% Asian alone 956,560 3.2% Two or more races 125,763 0.4% Other race alone 47,023 0.2% American Indian alone 29,275 0.10% Native Hawaiian and Other
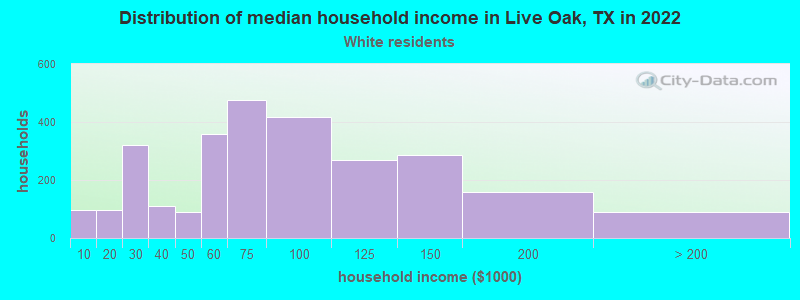
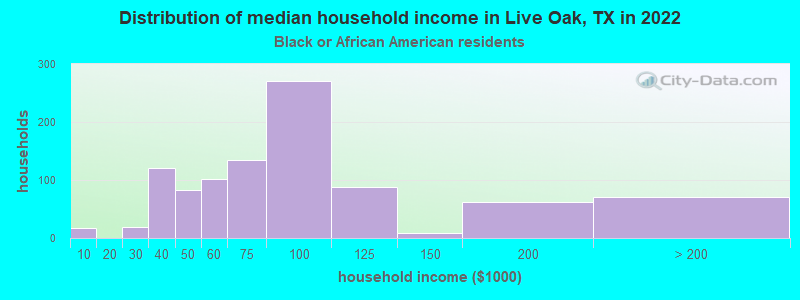
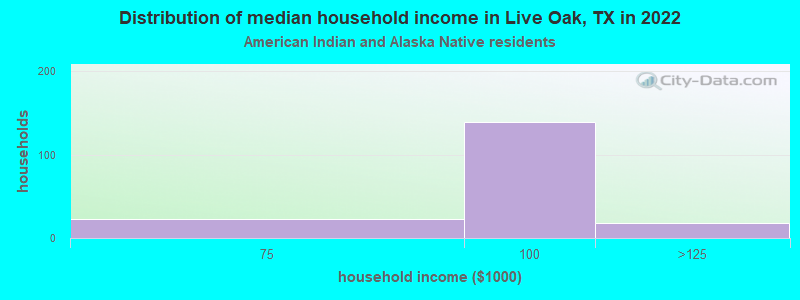
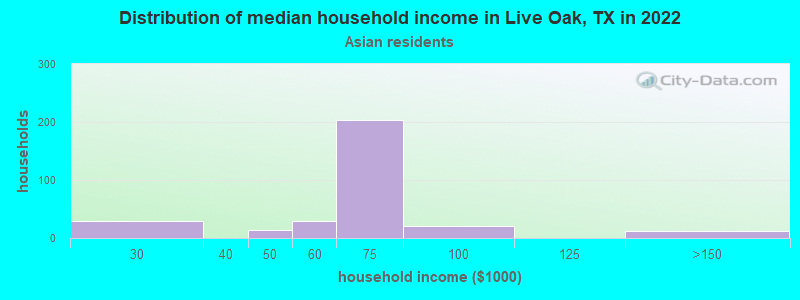
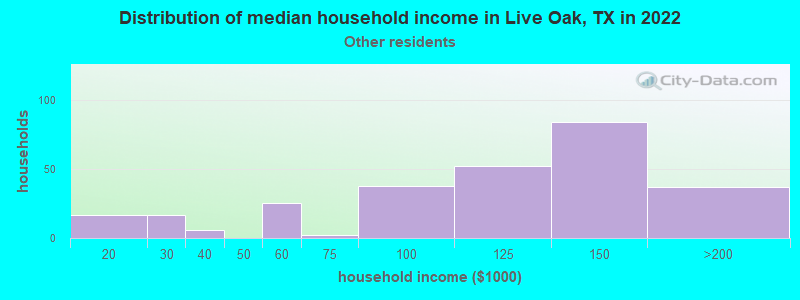
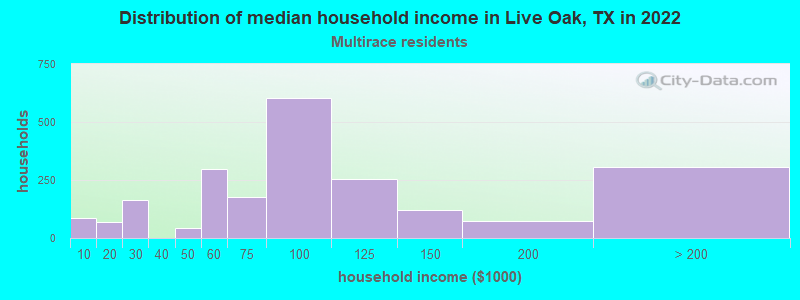
Income and house value in Live Oak Median household income in 2022 $73,269 White non-Hispanic householders$89,223 Black householders$106,553 American Indian and Alaska Native householders$70,965 Asian householders$122,949 Some other race householders$74,136 Two or more races householders$74,958 Hispanic or Latino race householdersMedian 2022 house value $243,344 White Non-Hispanic householders$276,109 Black or African American householders$156,314 American Indian or Alaska Native householders $226,280 Asian householders$290,102 Native Hawaiian and other Pacific Islander householders$256,314 Some other race householders$324,232 Two or more races householders$254,949 Hispanic or Latino householders
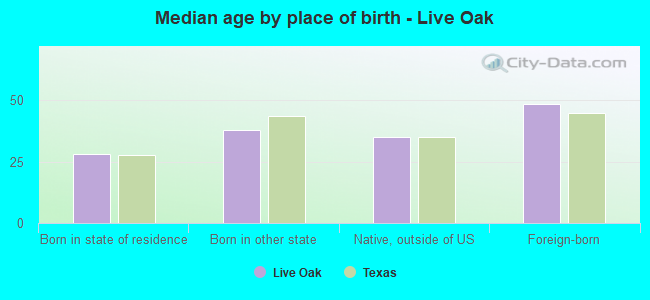
Median age by race in Live Oak
37.7 Median age for White residents34.5 39.8 35.7 Median age for Black or African American residents40.6 29.6 28.6 Median age for American Indian / Alaska Native residents28.3 40.1 29.0 Median age for Asian residents30.2 11.0 -674,441,204.4 Median age for Native Hawaiian / Pacific Islander residents-596,986,816.7 -748,387,096.0 26.6 Median age for Other race residents30.8 25.9 32.7 Median age for Two or more races residents28.2 43.6 38.2 Median age for White alone residents38.2 38.1 32.0 Median age for Hispanic or Latino residents29.2 37.8
Owner/renter occupied households by race in Live Oak
House owners and renters - White residents 1,808 63.4% Owner occupied1,044 36.6% Renter occupiedHouse owners and renters - Black or African American residents 481 51.4% Owner occupied455 48.6% Renter occupiedHouse owners and renters - American Indian / Alaska Native residents 173 100.0% Owner occupiedHouse owners and renters - Asian residents 126 46.2% Owner occupied146 53.8% Renter occupiedHouse owners and renters - Other race residents 173 55.8% Owner occupied137 44.2% Renter occupiedHouse owners and renters - Two or more races residents 1,113 50.4% Owner occupied1,097 49.6% Renter occupiedHouse owners and renters - White alone residents 1,739 64.0% Owner occupied977 36.0% Renter occupiedHouse owners and renters - Hispanic or Latino residents 1,281 54.8% Owner occupied1,058 45.2% Renter occupied
Language usage in Live Oak
English speakers - Total 77.7% of residents of Live Oak speak English at home.
19.7% of residents speak Spanish at home 2,399 83.0% Speak English very well491 17.0% Speak English less than very well3.0% of residents speak other language at home 259 59.3% Speak English very well178 40.7% Speak English less than very well
English speakers - Born in the United States 92.6% of residents of Live Oak speak English at home.
6.8% of residents speak Spanish at home 351 85.6% Speak English very well59 14.4% Speak English less than very well1.2% of residents speak other language at home 59 81.9% Speak English very well13 18.1% Speak English less than very well
English speakers - Native, born elsewhere 50.3% of residents of Live Oak speak English at home.
43.4% of residents speak Spanish at home 234 77.0% Speak English very well70 23.0% Speak English less than very well4.9% of residents speak other language at home 13 38.2% Speak English very well21 61.8% Speak English less than very well
English speakers - Foreign-born 17.7% of residents of Live Oak speak English at home.
63.6% of residents speak Spanish at home 481 70.1% Speak English very well205 29.9% Speak English less than very well18.5% of residents speak other language at home 62 31.0% Speak English very well138 69.0% Speak English less than very well
White (Caucasian) - Speak only English Native:
99.2% (5,240)Foreign-born:
45.3% (58)
White (Caucasian) - Speak another language Native:
7.4% (393)Foreign-born:
66.7% (85)
Black or African American - Speak only English Native:
99.1% (2,161)Foreign-born:
88.2% (63)
American Indian / Alaska Native - Speak only English Native:
93.3% (300)Foreign-born:
59.2% (38)
American Indian / Alaska Native - Speak another language Native:
7.0% (22)Foreign-born:
58.1% (38)
Asian - Speak only English Native:
84.1% (430)Foreign-born:
18.3% (34)
Asian - Speak another language Native:
20.2% (103)Foreign-born:
81.9% (154)
Other race - Speak another language Native:
44.0% (418)Foreign-born:
100.0% (305)
Two or more races - Speak another language Native:
43.5% (2,029)Foreign-born:
100.0% (436)
White alone - Speak only English Native:
96.6% (4,672)Foreign-born:
46.4% (64)
White alone - Speak another language Native:
3.5% (169)Foreign-born:
53.3% (73)
Hispanic or Latino - Speak only English Native:
60.0% (3,143)Foreign-born:
3.8% (26)
Hispanic or Latino - Speak another language Native:
40.3% (2,112)Foreign-born:
96.0% (660)
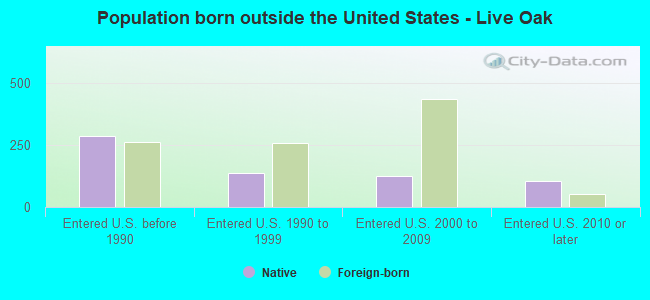
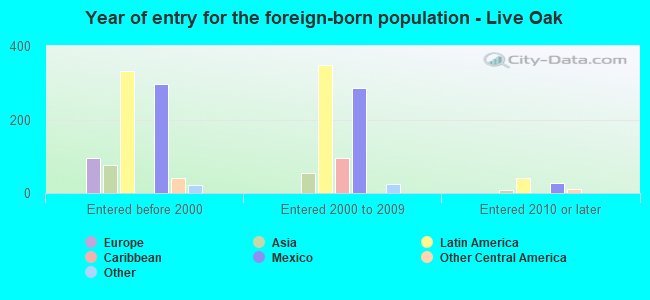
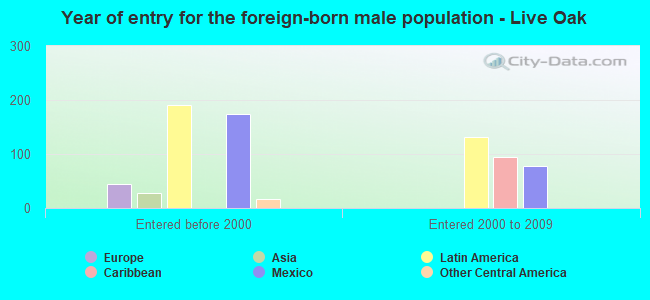
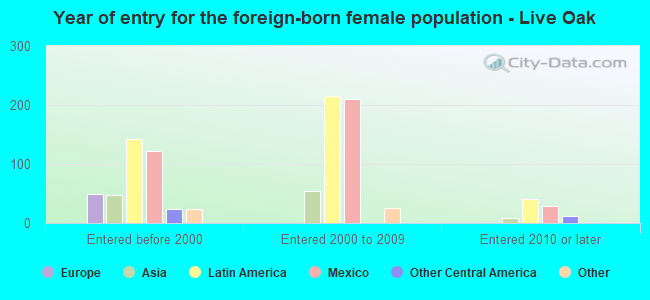
Foreign-born residents in Live Oak 1,110 residents are foreign born (4.8% Latin America , 1.0% Asia ).
This city:
6.9%Texas:
17.1%
Marital status for residents in Live Oak Marital status - White (Caucasian) population 15 years and over
Males 32.2% Never married54.1% Now married1.9% Separated4.6% Widowed7.2% DivorcedFemales 25.7% Never married49.9% Now married1.9% Separated12.0% Widowed10.5% DivorcedWomen who gave birth in the past 12 months Now married:
36.7% (40)Unmarried:
63.3% (68)
Women who did not give birth in the past 12 months Now married:
55.0% (746)Unmarried:
45.0% (611)
Marital status - Black or African American population 15 years and over
Males 13.8% Never married62.0% Now married11.1% Separated2.7% Widowed10.4% DivorcedFemales 27.5% Never married45.5% Now married7.2% Separated0.0% Widowed19.7% DivorcedWomen who gave birth in the past 12 months Now married:
0.0% (0)Unmarried:
100.0% (24)
Women who did not give birth in the past 12 months Now married:
55.8% (417)Unmarried:
44.2% (330)
Marital status - American Indian / Alaska Native population 15 years and over
Males 30.4% Never married11.6% Now married0.0% Separated0.0% Widowed58.0% DivorcedFemales 25.0% Never married58.8% Now married0.0% Separated0.0% Widowed16.2% DivorcedWomen who did not give birth in the past 12 months Now married:
62.2% (40)Unmarried:
37.8% (24)
Marital status - Asian population 15 years and over
Males 18.0% Never married73.9% Now married0.0% Separated8.1% Widowed0.0% DivorcedFemales 30.3% Never married59.2% Now married0.0% Separated0.0% Widowed10.4% DivorcedWomen who did not give birth in the past 12 months Now married:
55.2% (84)Unmarried:
44.8% (68)
Marital status - Other race population 15 years and over
Males 37.3% Never married50.8% Now married6.5% Separated0.2% Widowed5.1% DivorcedFemales 44.0% Never married48.9% Now married0.0% Separated0.0% Widowed7.1% DivorcedWomen who did not give birth in the past 12 months Now married:
46.9% (268)Unmarried:
53.1% (303)
Marital status - Two or more races population 15 years and over
Males 46.5% Never married49.8% Now married0.0% Separated0.0% Widowed3.7% DivorcedFemales 15.5% Never married36.8% Now married1.1% Separated8.7% Widowed37.9% DivorcedWomen who gave birth in the past 12 months Now married:
100.0% (148)Unmarried:
0.0% (0)
Women who did not give birth in the past 12 months Now married:
36.2% (525)Unmarried:
63.8% (927)
Marital status - White alone, not Hispanic / Latino population 15 years and over
Males 29.1% Never married57.1% Now married2.6% Separated1.6% Widowed9.7% DivorcedFemales 20.9% Never married53.0% Now married1.2% Separated14.8% Widowed10.2% DivorcedWomen who gave birth in the past 12 months Now married:
100.0% (54)Unmarried:
0.0% (0)
Women who did not give birth in the past 12 months Now married:
55.7% (703)Unmarried:
44.3% (559)
Marital status - Hispanic or Latino population 15 years and over
Males 39.8% Never married51.8% Now married1.2% Separated4.4% Widowed2.8% DivorcedFemales 29.3% Never married41.2% Now married2.0% Separated6.6% Widowed20.9% DivorcedWomen who gave birth in the past 12 months Now married:
38.4% (75)Unmarried:
61.6% (120)
Women who did not give birth in the past 12 months Now married:
47.0% (887)Unmarried:
53.0% (1,002)
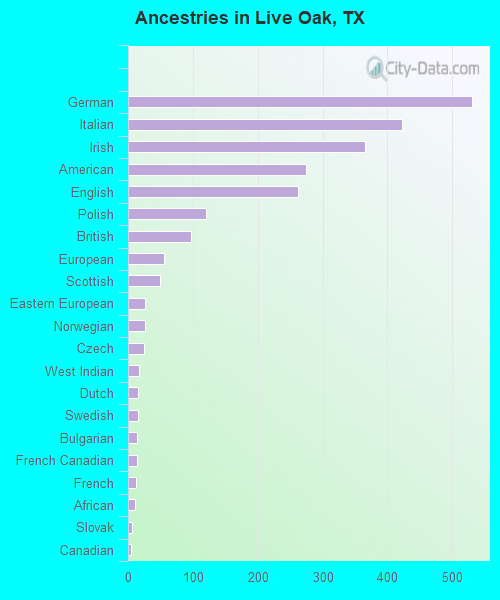
Ancestries in Live Oak
530 5.6% German423 4.4% Italian366 3.8% Irish275 2.9% American262 2.7% English120 1.3% Polish97 1.0% British56 0.6% European50 0.5% Scottish26 0.3% Eastern European26 0.3% Norwegian24 0.3% Czech17 0.2% West Indian15 0.2% Dutch15 0.2% Swedish14 0.1% Bulgarian14 0.1% French Canadian12 0.1% French11 0.1% African6 0.06% Slovak5 0.05% Canadian3 0.03% Lebanese2 0.02% Croatian
Geographical mobility in Live Oak Same house 1 year ago 4,617 82.5% White (Caucasian)2,486 98.4% Black or African American356 98.1% American Indian / Alaska Native916 99.4% Asian11 98.2% Native Hawaiian / Pacific Islander1,191 93.8% Other race4,757 87.1% Two or more races4,447 84.3% White alone, not Hispanic / Latino5,472 87.2% Hispanic or LatinoMoved within same county 569 10.2% White / Caucasian33 2.6% Other race260 4.8% Two or more races436 8.3% White alone, not Hispanic / Latino449 7.2% Hispanic or LatinoMoved within same state 231 4.1% White / Caucasian23 0.9% Black or African American14 3.9% American Indian / Alaska Native33 3.6% Asian34 2.7% Other race118 2.2% Two or more races250 4.7% White alone, not Hispanic / Latino80 1.3% Hispanic or LatinoMoved from different state 186 3.3% White / Caucasian234 4.3% Two or more races125 2.4% White alone, not Hispanic / Latino275 4.4% Hispanic or LatinoMoved from abroad 17 0.3% White16 0.3% White alone, not Hispanic / Latino
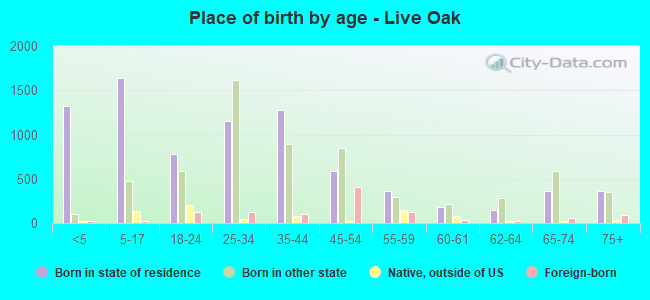
Children Nativity (place of birth) in Live Oak
Children under 6 years - Living with two parents Both parents native 785 100.0% NativeOne native, one foreign-born parent 123 100.0% NativeChildren under 6 years - Living with one parent Native parent 452 100.0% NativeForeign-born parent 105 100.0% NativeChildren 6 to 17 years - Living with two parents Both parents native 938 100.0% NativeBoth parents foreign-born 55 100.0% NativeOne native, one foreign-born parent 112 100.0% NativeChildren 6 to 17 years - Living with one parent Native parent 863 100.0% NativeForeign-born parent 93 49.9% Native94 50.1% Foreign-born
Grandparents responsible for own grandchildren in Live Oak
Grandparents (30 to 59 years) White / Caucasian 11 11.1% Responsible for grandchildren90 88.9% Not responsible for grandchildrenTwo or more races 53 100.0% Responsible for grandchildrenWhite alone, not Hispanic / Latino 136 100.0% Not responsible for grandchildrenHispanic or Latino 18 81.0% Responsible for grandchildren4 19.0% Not responsible for grandchildrenGrandparents (60 years and over) White / Caucasian 6 41.7% Responsible for grandchildren9 58.3% Not responsible for grandchildrenTwo or more races 126 100.0% Not responsible for grandchildrenWhite alone, not Hispanic / Latino 7 33.6% Responsible for grandchildren15 66.4% Not responsible for grandchildrenHispanic or Latino 6 10.5% Responsible for grandchildren54 89.5% Not responsible for grandchildren