Races in Lodi, New Jersey (NJ) Detailed Stats
Data:
Races - White alone (%)
Races - White alone (% change since 2000)
Races - Black alone (%)
Races - Black alone (% change since 2000)
Races - American Indian alone (%)
Races - American Indian alone (% change since 2000)
Races - Asian alone (%)
Races - Asian alone (% change since 2000)
Races - Hispanic (%)
Races - Hispanic (% change since 2000)
Races - Native Hawaiian and Other Pacific Islander alone (%)
Races - Native Hawaiian and Other Pacific Islander alone (% change since 2000)
Races - Two or more races(%)
Races - Two or more races(% change since 2000)
Races - Other race alone (%)
Races - Other race alone (% change since 2000)
Racial diversity
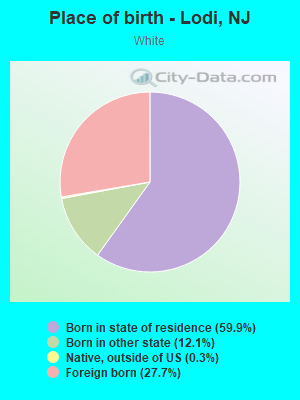
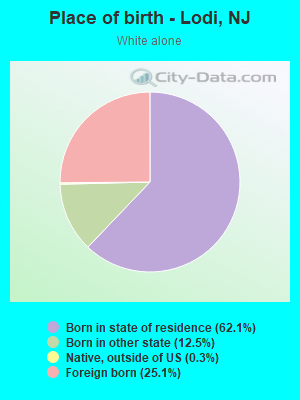
Place of birth - Born in state of residence (%)
Place of birth - Born in state of residence (%) - White
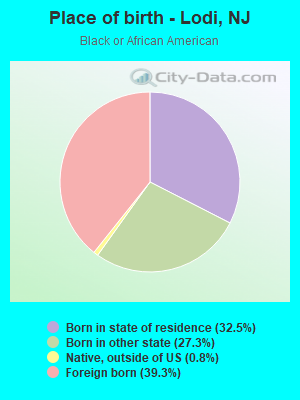
Place of birth - Born in state of residence (%) - Black or African American
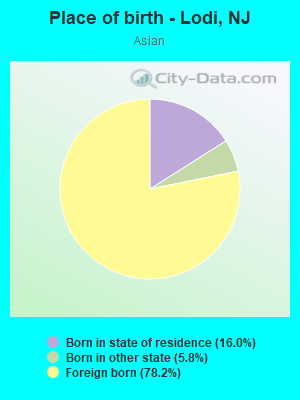
Place of birth - Born in state of residence (%) - Asian
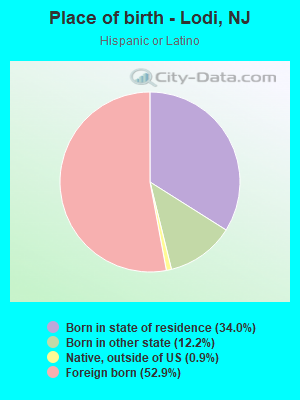
Place of birth - Born in state of residence (%) - Hispanic or Latino
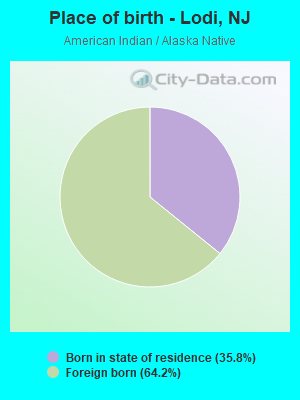
Place of birth - Born in state of residence (%) - American Indian and Alaska Native
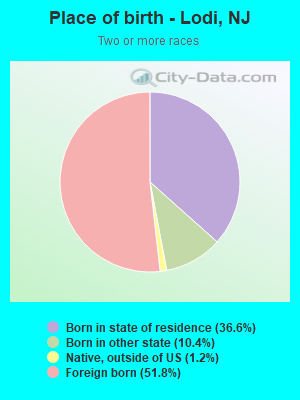
Place of birth - Born in state of residence (%) - Multirace
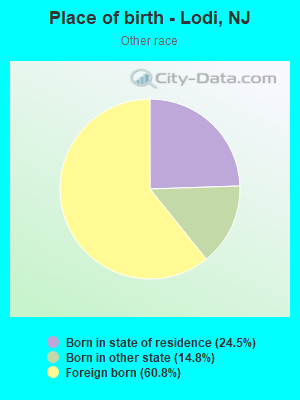
Place of birth - Born in state of residence (%) - Other Race
Place of birth - Born in other state (%)
Place of birth - Born in other state (%) - White
Place of birth - Born in other state (%) - Black or African American
Place of birth - Born in other state (%) - Asian
Place of birth - Born in other state (%) - Hispanic or Latino
Place of birth - Born in other state (%) - American Indian and Alaska Native
Place of birth - Born in other state (%) - Multirace
Place of birth - Born in other state (%) - Other Race
Place of birth - Native, outside of US (%)
Place of birth - Native, outside of US (%) - White
Place of birth - Native, outside of US (%) - Black or African American
Place of birth - Native, outside of US (%) - Asian
Place of birth - Native, outside of US (%) - Hispanic or Latino
Place of birth - Native, outside of US (%) - American Indian and Alaska Native
Place of birth - Native, outside of US (%) - Multirace
Place of birth - Native, outside of US (%) - Other Race
Place of birth - Foreign born (%)
Place of birth - Foreign born (%) - White
Place of birth - Foreign born (%) - Black or African American
Place of birth - Foreign born (%) - Asian
Place of birth - Foreign born (%) - Hispanic or Latino
Place of birth - Foreign born (%) - American Indian and Alaska Native
Place of birth - Foreign born (%) - Multirace
Place of birth - Foreign born (%) - Other Race
Residents speaking English at home (%)
Residents speaking English at home - Born in the United States (%)
Residents speaking English at home - Native, born elsewhere (%)
Residents speaking English at home - Foreign born (%)
Residents speaking Spanish at home (%)
Residents speaking Spanish at home - Born in the United States (%)
Residents speaking Spanish at home - Native, born elsewhere (%)
Residents speaking Spanish at home - Foreign born (%)
Residents speaking other language at home (%)
Residents speaking other language at home - Born in the United States (%)
Residents speaking other language at home - Native, born elsewhere (%)
Residents speaking other language at home - Foreign born (%)
Marital status - Never married (%)
Marital status - Now married (%)
Marital status - Separated (%)
Marital status - Widowed (%)
Marital status - Divorced (%)
Ancestries Reported - Arab (%)
Ancestries Reported - Czech (%)
Ancestries Reported - Danish (%)
Ancestries Reported - Dutch (%)
Ancestries Reported - English (%)
Ancestries Reported - French (%)
Ancestries Reported - French Canadian (%)
Ancestries Reported - German (%)
Ancestries Reported - Greek (%)
Ancestries Reported - Hungarian (%)
Ancestries Reported - Irish (%)
Ancestries Reported - Italian (%)
Ancestries Reported - Lithuanian (%)
Ancestries Reported - Norwegian (%)
Ancestries Reported - Polish (%)
Ancestries Reported - Portuguese (%)
Ancestries Reported - Russian (%)
Ancestries Reported - Scotch-Irish (%)
Ancestries Reported - Scottish (%)
Ancestries Reported - Slovak (%)
Ancestries Reported - Subsaharan African (%)
Ancestries Reported - Swedish (%)
Ancestries Reported - Swiss (%)
Ancestries Reported - Ukrainian (%)
Ancestries Reported - United States (%)
Ancestries Reported - Welsh (%)
Ancestries Reported - West Indian (%)
Ancestries Reported - Other (%)
Geographical mobility - Same house 1 year ago (%)
Geographical mobility - Same house 1 year ago (%) - White
Geographical mobility - Same house 1 year ago (%) - Black or African American
Geographical mobility - Same house 1 year ago (%) - Asian
Geographical mobility - Same house 1 year ago (%) - Hispanic or Latino
Geographical mobility - Same house 1 year ago (%) - American Indian and Alaska Native
Geographical mobility - Same house 1 year ago (%) - Multirace
Geographical mobility - Same house 1 year ago (%) - Other Race
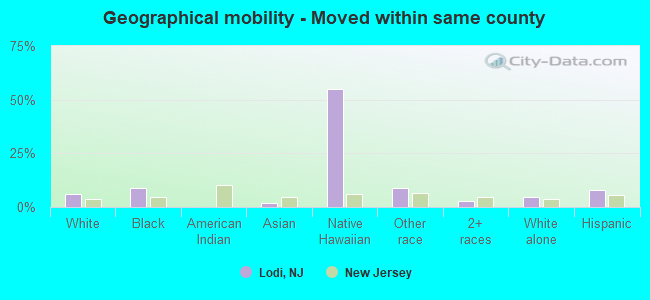
Geographical mobility - Moved within same county (%)
Geographical mobility - Moved within same county (%) - White
Geographical mobility - Moved within same county (%) - Black or African American
Geographical mobility - Moved within same county (%) - Asian
Geographical mobility - Moved within same county (%) - Hispanic or Latino
Geographical mobility - Moved within same county (%) - American Indian and Alaska Native
Geographical mobility - Moved within same county (%) - Multirace
Geographical mobility - Moved within same county (%) - Other Race
Geographical mobility - Moved from different county within same state (%)
Geographical mobility - Moved from different county within same state (%) - White
Geographical mobility - Moved from different county within same state (%) - Black or African American
Geographical mobility - Moved from different county within same state (%) - Asian
Geographical mobility - Moved from different county within same state (%) - Hispanic or Latino
Geographical mobility - Moved from different county within same state (%) - American Indian and Alaska Native
Geographical mobility - Moved from different county within same state (%) - Multirace
Geographical mobility - Moved from different county within same state (%) - Other Race
Geographical mobility - Moved from different state (%)
Geographical mobility - Moved from different state (%) - White
Geographical mobility - Moved from different state (%) - Black or African American
Geographical mobility - Moved from different state (%) - Asian
Geographical mobility - Moved from different state (%) - Hispanic or Latino
Geographical mobility - Moved from different state (%) - American Indian and Alaska Native
Geographical mobility - Moved from different state (%) - Multirace
Geographical mobility - Moved from different state (%) - Other Race
Geographical mobility - Moved from abroad (%)
Geographical mobility - Moved from abroad (%) - White
Geographical mobility - Moved from abroad (%) - Black or African American
Geographical mobility - Moved from abroad (%) - Asian
Geographical mobility - Moved from abroad (%) - Hispanic or Latino
Geographical mobility - Moved from abroad (%) - American Indian and Alaska Native
Geographical mobility - Moved from abroad (%) - Multirace
Geographical mobility - Moved from abroad (%) - Other Race
Place of birth for the foreign-born population - Ireland (%)
Place of birth for the foreign-born population - Denmark (%)
Place of birth for the foreign-born population - Norway (%)
Place of birth for the foreign-born population - Sweden (%)
Place of birth for the foreign-born population - United Kingdom (%)
Place of birth for the foreign-born population - England (%)
Place of birth for the foreign-born population - Scotland (%)
Place of birth for the foreign-born population - Other Northern Europe (%)
Place of birth for the foreign-born population - Austria (%)
Place of birth for the foreign-born population - Belgium (%)
Place of birth for the foreign-born population - France (%)
Place of birth for the foreign-born population - Germany (%)
Place of birth for the foreign-born population - Netherlands (%)
Place of birth for the foreign-born population - Switzerland (%)
Place of birth for the foreign-born population - Other Western Europe (%)
Place of birth for the foreign-born population - Greece (%)
Place of birth for the foreign-born population - Italy (%)
Place of birth for the foreign-born population - Portugal (%)
Place of birth for the foreign-born population - Spain (%)
Place of birth for the foreign-born population - Other Southern Europe (%)
Place of birth for the foreign-born population - Albania (%)
Place of birth for the foreign-born population - Belarus (%)
Place of birth for the foreign-born population - Bosnia and Herzegovina (%)
Place of birth for the foreign-born population - Bulgaria (%)
Place of birth for the foreign-born population - Croatia (%)
Place of birth for the foreign-born population - Czechoslovakia (%)
Place of birth for the foreign-born population - Hungary (%)
Place of birth for the foreign-born population - Latvia (%)
Place of birth for the foreign-born population - Lithuania (%)
Place of birth for the foreign-born population - North Macedonia (Macedonia) (%)
Place of birth for the foreign-born population - Moldova (%)
Place of birth for the foreign-born population - Poland (%)
Place of birth for the foreign-born population - Romania (%)
Place of birth for the foreign-born population - Russia (%)
Place of birth for the foreign-born population - Serbia (%)
Place of birth for the foreign-born population - Ukraine (%)
Place of birth for the foreign-born population - Other Eastern Europe (%)
Place of birth for the foreign-born population - China (%)
Place of birth for the foreign-born population - Hong Kong (%)
Place of birth for the foreign-born population - Taiwan (%)
Place of birth for the foreign-born population - Japan (%)
Place of birth for the foreign-born population - Korea (%)
Place of birth for the foreign-born population - Other Eastern Asia (%)
Place of birth for the foreign-born population - Afghanistan (%)
Place of birth for the foreign-born population - Bangladesh (%)
Place of birth for the foreign-born population - India (%)
Place of birth for the foreign-born population - Iran (%)
Place of birth for the foreign-born population - Kazakhstan (%)
Place of birth for the foreign-born population - Nepal (%)
Place of birth for the foreign-born population - Pakistan (%)
Place of birth for the foreign-born population - Sri Lanka (%)
Place of birth for the foreign-born population - Uzbekistan (%)
Place of birth for the foreign-born population - Other South Central Asia (%)
Place of birth for the foreign-born population - Burma (%)
Place of birth for the foreign-born population - Cambodia (%)
Place of birth for the foreign-born population - Indonesia (%)
Place of birth for the foreign-born population - Laos (%)
Place of birth for the foreign-born population - Malaysia (%)
Place of birth for the foreign-born population - Philippines (%)
Place of birth for the foreign-born population - Singapore (%)
Place of birth for the foreign-born population - Thailand (%)
Place of birth for the foreign-born population - Vietnam (%)
Place of birth for the foreign-born population - Other South Eastern Asia (%)
Place of birth for the foreign-born population - Armenia (%)
Place of birth for the foreign-born population - Iraq (%)
Place of birth for the foreign-born population - Israel (%)
Place of birth for the foreign-born population - Jordan (%)
Place of birth for the foreign-born population - Kuwait (%)
Place of birth for the foreign-born population - Lebanon (%)
Place of birth for the foreign-born population - Saudi Arabia (%)
Place of birth for the foreign-born population - Syria (%)
Place of birth for the foreign-born population - Turkey (%)
Place of birth for the foreign-born population - Yemen (%)
Place of birth for the foreign-born population - Other Western Asia (%)
Place of birth for the foreign-born population - Eritrea (%)
Place of birth for the foreign-born population - Ethiopia (%)
Place of birth for the foreign-born population - Kenya (%)
Place of birth for the foreign-born population - Somalia (%)
Place of birth for the foreign-born population - Uganda (%)
Place of birth for the foreign-born population - Zimbabwe (%)
Place of birth for the foreign-born population - Other Eastern Africa (%)
Place of birth for the foreign-born population - Cameroon (%)
Place of birth for the foreign-born population - Congo (%)
Place of birth for the foreign-born population - Democratic Republic of Congo (Zaire) (%)
Place of birth for the foreign-born population - Other Middle Africa (%)
Place of birth for the foreign-born population - Egypt (%)
Place of birth for the foreign-born population - Morocco (%)
Place of birth for the foreign-born population - Sudan (%)
Place of birth for the foreign-born population - Other Northern Africa (%)
Place of birth for the foreign-born population - South Africa (%)
Place of birth for the foreign-born population - Other Southern Africa (%)
Place of birth for the foreign-born population - Cabo Verde (%)
Place of birth for the foreign-born population - Ghana (%)
Place of birth for the foreign-born population - Liberia (%)
Place of birth for the foreign-born population - Nigeria (%)
Place of birth for the foreign-born population - Senegal (%)
Place of birth for the foreign-born population - Sierra Leone (%)
Place of birth for the foreign-born population - Other Western Africa (%)
Place of birth for the foreign-born population - Australia (%)
Place of birth for the foreign-born population - New Zealand (%)
Place of birth for the foreign-born population - Fiji (%)
Place of birth for the foreign-born population - Micronesia (%)
Place of birth for the foreign-born population - Bahamas (%)
Place of birth for the foreign-born population - Barbados (%)
Place of birth for the foreign-born population - Cuba (%)
Place of birth for the foreign-born population - Dominica (%)
Place of birth for the foreign-born population - Dominican Republic (%)
Place of birth for the foreign-born population - Grenada (%)
Place of birth for the foreign-born population - Haiti (%)
Place of birth for the foreign-born population - Jamaica (%)
Place of birth for the foreign-born population - St. Vincent and the Grenadines (%)
Place of birth for the foreign-born population - Trinidad and Tobago (%)
Place of birth for the foreign-born population - West Indies (%)
Place of birth for the foreign-born population - Other Caribbean (%)
Place of birth for the foreign-born population - Belize (%)
Place of birth for the foreign-born population - Costa Rica (%)
Place of birth for the foreign-born population - El Salvador (%)
Place of birth for the foreign-born population - Guatemala (%)
Place of birth for the foreign-born population - Honduras (%)
Place of birth for the foreign-born population - Mexico (%)
Place of birth for the foreign-born population - Nicaragua (%)
Place of birth for the foreign-born population - Panama (%)
Place of birth for the foreign-born population - Other Central America (%)
Place of birth for the foreign-born population - Argentina (%)
Place of birth for the foreign-born population - Bolivia (%)
Place of birth for the foreign-born population - Brazil (%)
Place of birth for the foreign-born population - Chile (%)
Place of birth for the foreign-born population - Colombia (%)
Place of birth for the foreign-born population - Ecuador (%)
Place of birth for the foreign-born population - Guyana (%)
Place of birth for the foreign-born population - Peru (%)
Place of birth for the foreign-born population - Uruguay (%)
Place of birth for the foreign-born population - Venezuela (%)
Place of birth for the foreign-born population - Other South America (%)
Place of birth for the foreign-born population - Canada (%)
Place of birth for the foreign-born population - Other Northern America (%)
Place of birth for the foreign-born population - Other (%)
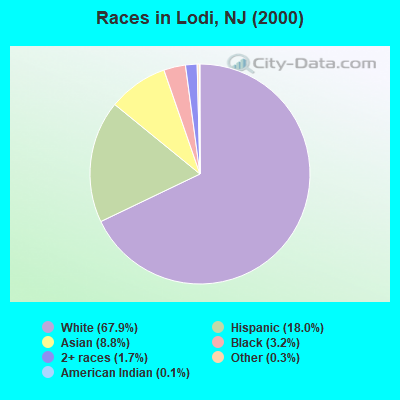
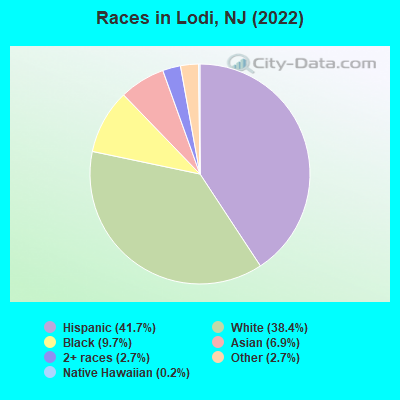
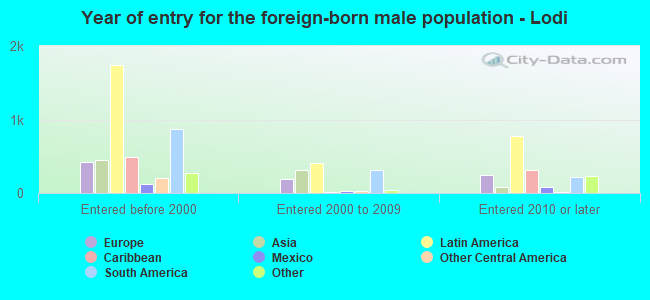
According to 2022 data, the most numerous races in Lodi, NJ are White alone (9,979 residents), Hispanic (10,820 residents), and Black alone (2,515 residents). 45.7% of Lodi residents speak English at home. 42.1% of Lodi, NJ residents are foreign-born (22.9% born in Latin America, 7.8% born in Europe, 6.8% born in Asia), which is 45.4% greater than the foreign-born rate of 23.0% across the entire state of New Jersey.
Race distribution in Lodi
2000 2022
5,557,209 66.0% White alone 1,117,191 13.3% Hispanic 1,096,171 13.0% Black alone 477,012 5.7% Asian alone 133,689 1.6% Two or more races 19,565 0.2% Other race alone 11,338 0.1% American Indian alone 2,175 0.03% Native Hawaiian and Other
4,766,476 51.5% White alone 2,028,470 21.9% Hispanic 1,111,632 12.0% Black alone 923,546 10.0% Asian alone 332,237 3.6% Two or more races 89,847 1.0% Other race alone 8,557 0.09% American Indian alone 934 0.01% Native Hawaiian and Other
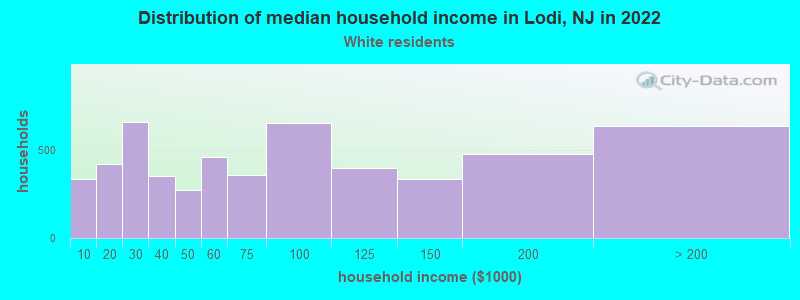
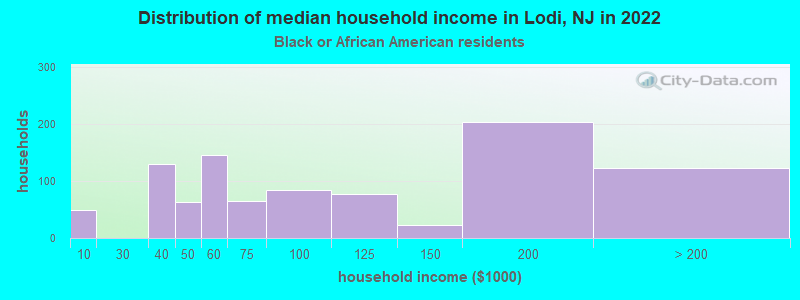
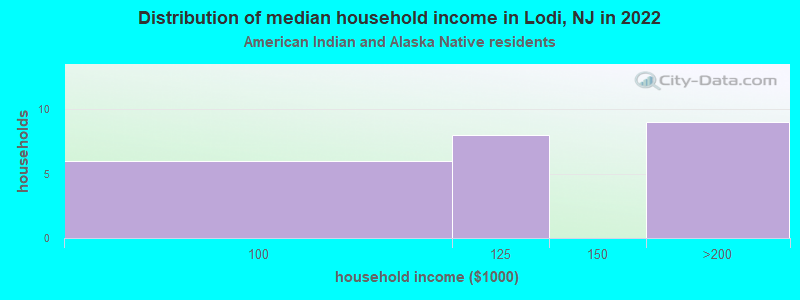
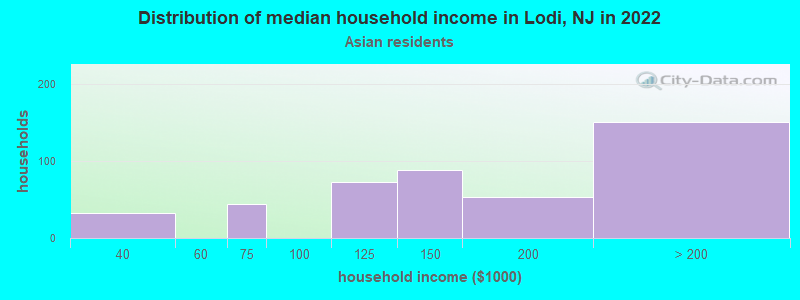
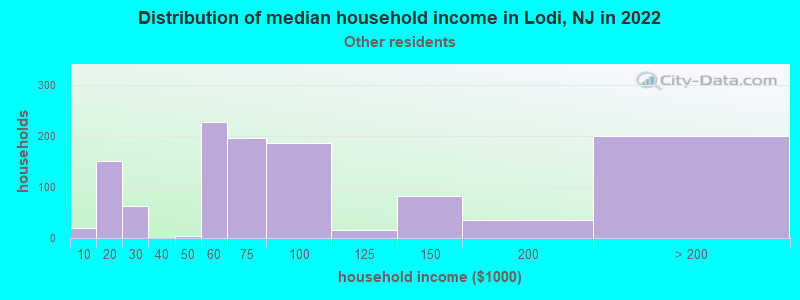
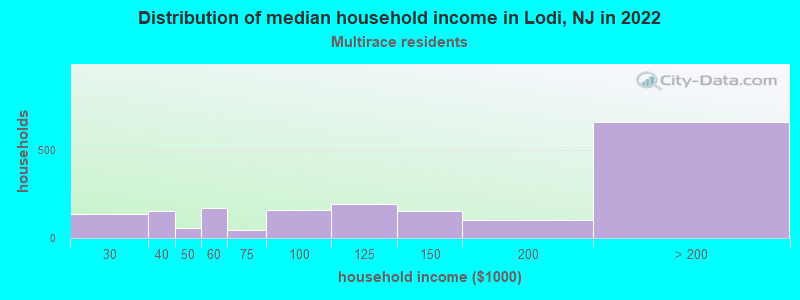
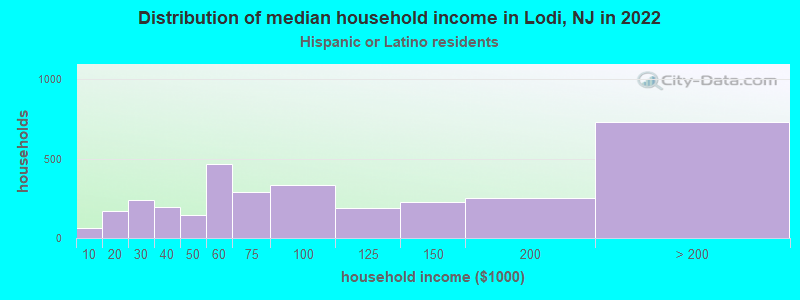
Income and house value in Lodi Median household income in 2022 $71,364 White non-Hispanic householders$96,320 Black householders$93,667 American Indian and Alaska Native householders$135,415 Asian householders$61,186 Some other race householders$130,371 Two or more races householders$77,568 Hispanic or Latino race householdersMedian 2022 house value $406,668 White Non-Hispanic householders $409,965 Asian householders$437,280 Some other race householders$382,649 Two or more races householders$402,194 Hispanic or Latino householders
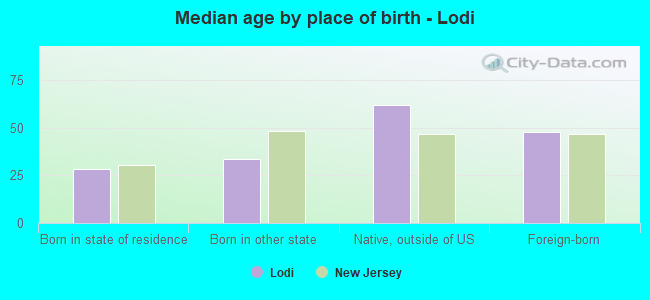
Median age by race in Lodi
43.1 Median age for White residents46.5 39.9 33.6 Median age for Black or African American residents35.9 31.6 40.7 Median age for American Indian / Alaska Native residents36.2 -753,722,794.2 43.4 Median age for Asian residents48.5 38.9 -510,460,250.5 Median age for Native Hawaiian / Pacific Islander residents-514,767,932.0 -713,070,378.3 36.4 Median age for Other race residents35.9 39.4 36.6 Median age for Two or more races residents36.6 38.7 49.1 Median age for White alone residents53.6 44.5 34.9 Median age for Hispanic or Latino residents36.0 34.4
Owner/renter occupied households by race in Lodi
House owners and renters - White residents 2,597 49.5% Owner occupied2,651 50.5% Renter occupiedHouse owners and renters - Black or African American residents 223 26.3% Owner occupied625 73.7% Renter occupiedHouse owners and renters - American Indian / Alaska Native residents 28 100.0% Renter occupiedHouse owners and renters - Asian residents 389 83.9% Owner occupied74 16.1% Renter occupiedHouse owners and renters - Native Hawaiian / Pacific Islander residents 17 100.0% Renter occupiedHouse owners and renters - Other race residents 478 40.0% Owner occupied716 60.0% Renter occupiedHouse owners and renters - Two or more races residents 744 40.2% Owner occupied1,106 59.8% Renter occupiedHouse owners and renters - White alone residents 2,279 50.7% Owner occupied2,216 49.3% Renter occupiedHouse owners and renters - Hispanic or Latino residents 1,245 37.0% Owner occupied2,119 63.0% Renter occupied
Language usage in Lodi
English speakers - Total 45.7% of residents of Lodi speak English at home.
35.9% of residents speak Spanish at home 5,111 57.5% Speak English very well3,779 42.5% Speak English less than very well20.0% of residents speak other language at home 2,912 58.7% Speak English very well2,050 41.3% Speak English less than very well
English speakers - Born in the United States 63.7% of residents of Lodi speak English at home.
34.1% of residents speak Spanish at home 953 88.3% Speak English very well126 11.7% Speak English less than very well6.1% of residents speak other language at home 194 100.0% Speak English very well
English speakers - Native, born elsewhere 56.8% of residents of Lodi speak English at home.
44.7% of residents speak Spanish at home 41 69.5% Speak English very well18 30.5% Speak English less than very well
English speakers - Foreign-born 16.9% of residents of Lodi speak English at home.
49.3% of residents speak Spanish at home 1,928 36.1% Speak English very well3,420 63.9% Speak English less than very well35.0% of residents speak other language at home 1,802 47.5% Speak English very well1,991 52.5% Speak English less than very well
White (Caucasian) - Speak only English Native:
78.9% (6,820)Foreign-born:
20.1% (698)
White (Caucasian) - Speak another language Native:
18.5% (1,597)Foreign-born:
79.5% (2,764)
Black or African American - Speak only English Native:
73.5% (1,180)Foreign-born:
46.2% (503)
Black or African American - Speak another language Native:
26.7% (428)Foreign-born:
49.7% (541)
American Indian / Alaska Native - Speak another language Native:
100.0% (35)Foreign-born:
100.0% (48)
Asian - Speak only English Native:
65.2% (276)Foreign-born:
13.3% (182)
Asian - Speak another language Native:
35.6% (151)Foreign-born:
86.6% (1,187)
Other race - Speak only English Native:
12.1% (168)Foreign-born:
8.5% (191)
Other race - Speak another language Native:
92.2% (1,285)Foreign-born:
89.4% (2,010)
Two or more races - Speak only English Native:
48.4% (1,160)Foreign-born:
8.2% (260)
Two or more races - Speak another language Native:
52.9% (1,270)Foreign-born:
92.4% (2,936)
White alone - Speak only English Native:
87.8% (6,194)Foreign-born:
23.4% (582)
White alone - Speak another language Native:
11.9% (842)Foreign-born:
76.6% (1,903)
Hispanic or Latino - Speak only English Native:
31.3% (1,449)Foreign-born:
5.2% (296)
Hispanic or Latino - Speak another language Native:
70.2% (3,255)Foreign-born:
94.2% (5,357)
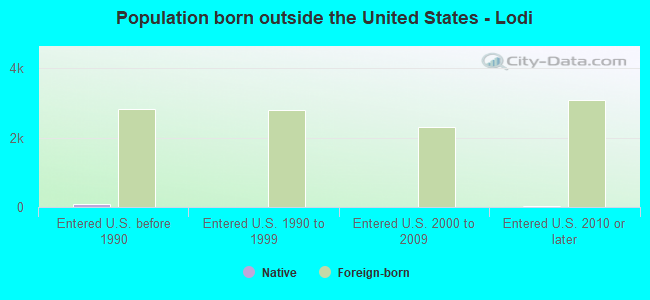
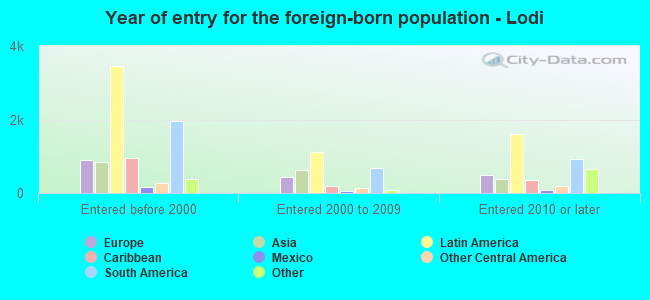
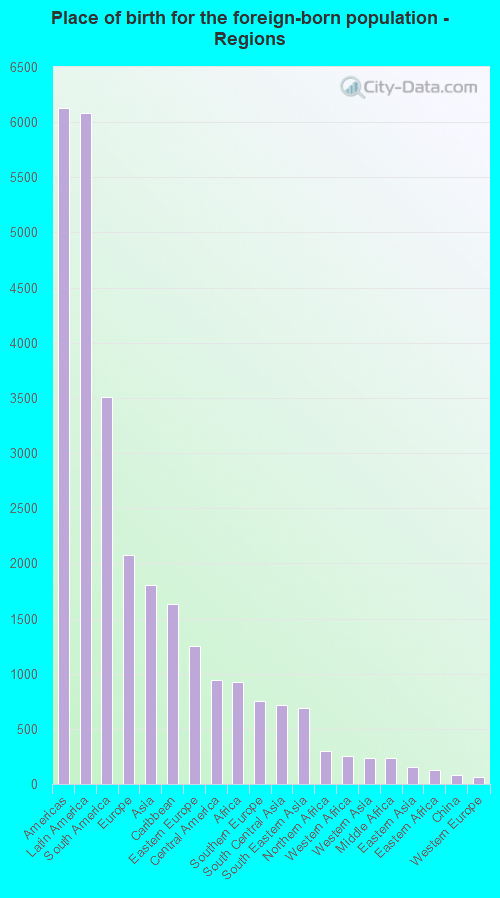
Foreign-born residents in Lodi 10,935 residents are foreign born (22.9% Latin America , 7.8% Europe , 6.8% Asia ).
This city:
42.1%New Jersey:
23.2%
Marital status for residents in Lodi Marital status - White (Caucasian) population 15 years and over
Males 31.3% Never married52.8% Now married1.9% Separated2.2% Widowed11.8% DivorcedFemales 37.1% Never married38.9% Now married2.9% Separated8.5% Widowed12.6% DivorcedWomen who gave birth in the past 12 months Now married:
77.4% (161)Unmarried:
22.6% (47)
Women who did not give birth in the past 12 months Now married:
32.7% (955)Unmarried:
67.3% (1,965)
Marital status - Black or African American population 15 years and over
Males 43.3% Never married43.5% Now married1.5% Separated0.0% Widowed11.7% DivorcedFemales 42.1% Never married44.8% Now married1.3% Separated2.6% Widowed9.1% DivorcedWomen who gave birth in the past 12 months Now married:
100.0% (8)Unmarried:
0.0% (0)
Women who did not give birth in the past 12 months Now married:
49.3% (461)Unmarried:
50.7% (475)
Marital status - American Indian / Alaska Native population 15 years and over
Males 0.0% Never married100.0% Now married0.0% Separated0.0% Widowed0.0% DivorcedFemales 0.0% Never married38.5% Now married0.0% Separated61.5% Widowed0.0% DivorcedMarital status - Asian population 15 years and over
Males 33.1% Never married62.4% Now married1.8% Separated0.3% Widowed2.4% DivorcedFemales 36.8% Never married56.5% Now married0.0% Separated4.6% Widowed2.1% DivorcedWomen who did not give birth in the past 12 months Now married:
42.2% (221)Unmarried:
57.8% (302)
Marital status - Native Hawaiian / Pacific Islander population 15 years and over
Males 100.0% Never married0.0% Now married0.0% Separated0.0% Widowed0.0% DivorcedFemales 100.0% Never married0.0% Now married0.0% Separated0.0% Widowed0.0% DivorcedWomen who did not give birth in the past 12 months Now married:
0.0% (0)Unmarried:
100.0% (15)
Marital status - Other race population 15 years and over
Males 50.1% Never married36.3% Now married0.0% Separated2.5% Widowed11.2% DivorcedFemales 39.2% Never married22.4% Now married0.0% Separated20.2% Widowed18.3% DivorcedWomen who gave birth in the past 12 months Now married:
100.0% (41)Unmarried:
0.0% (0)
Women who did not give birth in the past 12 months Now married:
5.7% (55)Unmarried:
94.3% (906)
Marital status - Two or more races population 15 years and over
Males 39.8% Never married46.4% Now married1.7% Separated0.0% Widowed12.1% DivorcedFemales 40.2% Never married36.9% Now married4.4% Separated1.4% Widowed17.0% DivorcedWomen who did not give birth in the past 12 months Now married:
41.5% (697)Unmarried:
58.5% (985)
Marital status - White alone, not Hispanic / Latino population 15 years and over
Males 29.8% Never married52.6% Now married1.8% Separated3.0% Widowed12.7% DivorcedFemales 35.7% Never married41.6% Now married0.2% Separated10.1% Widowed12.4% DivorcedWomen who gave birth in the past 12 months Now married:
100.0% (149)Unmarried:
0.0% (0)
Women who did not give birth in the past 12 months Now married:
32.1% (686)Unmarried:
67.9% (1,452)
Marital status - Hispanic or Latino population 15 years and over
Males 39.0% Never married48.6% Now married1.5% Separated0.6% Widowed10.3% DivorcedFemales 40.8% Never married31.6% Now married5.9% Separated6.4% Widowed15.4% DivorcedWomen who gave birth in the past 12 months Now married:
51.7% (64)Unmarried:
48.3% (60)
Women who did not give birth in the past 12 months Now married:
33.3% (1,029)Unmarried:
66.7% (2,059)
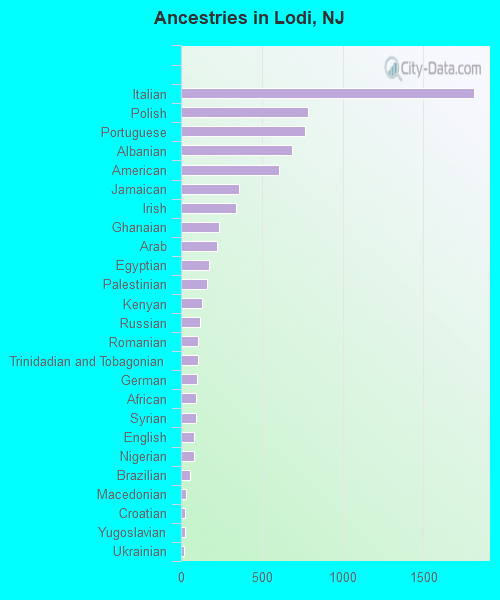
Ancestries in Lodi
1,815 11.1% Italian787 4.8% Polish770 4.7% Portuguese686 4.2% Albanian606 3.7% American359 2.2% Jamaican343 2.1% Irish233 1.4% Ghanaian225 1.4% Arab172 1.1% Egyptian161 1.0% Palestinian128 0.8% Kenyan120 0.7% Russian108 0.7% Romanian104 0.6% Trinidadian and Tobagonian98 0.6% German94 0.6% African90 0.6% Syrian83 0.5% English81 0.5% Nigerian54 0.3% Brazilian30 0.2% Macedonian25 0.2% Croatian23 0.1% Yugoslavian17 0.1% Ukrainian15 0.09% Dutch10 0.06% Bulgarian10 0.06% Scottish9 0.06% Hungarian8 0.05% Turkish7 0.04% European7 0.04% Greek7 0.04% Slavic5 0.03% French Canadian
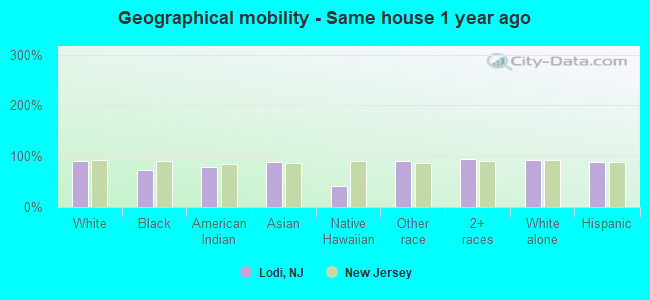
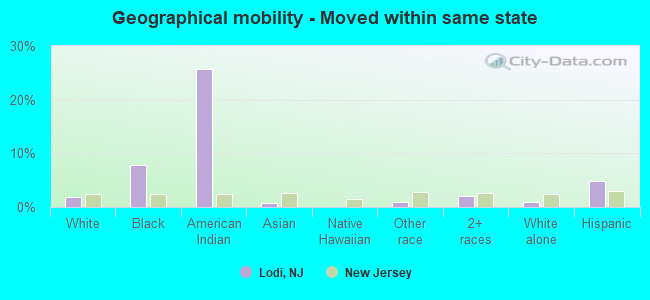
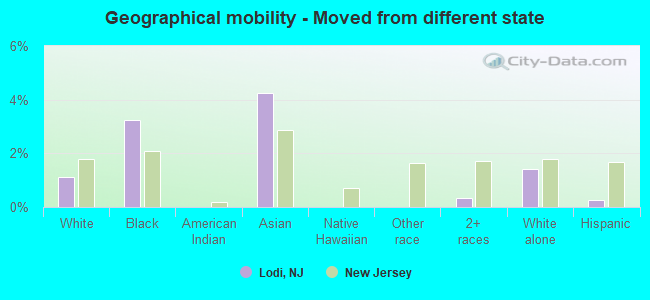
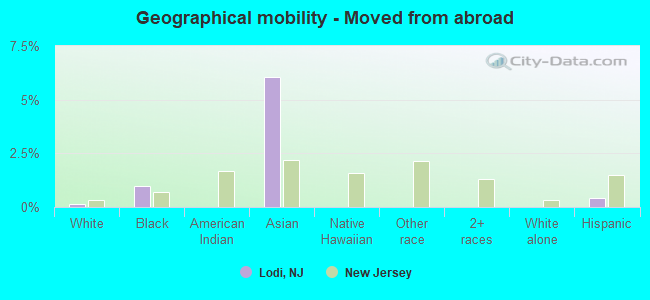
Geographical mobility in Lodi Same house 1 year ago 11,578 90.4% White (Caucasian)2,123 72.1% Black or African American85 78.4% American Indian / Alaska Native1,571 88.0% Asian11 42.1% Native Hawaiian / Pacific Islander3,367 90.5% Other race5,573 94.2% Two or more races9,133 92.9% White alone, not Hispanic / Latino9,555 88.0% Hispanic or LatinoMoved within same county 799 6.2% White / Caucasian256 8.7% Black or African American36 2.0% Asian14 55.2% Native Hawaiian / Pacific Islander322 8.6% Other race170 2.9% Two or more races472 4.8% White alone, not Hispanic / Latino836 7.7% Hispanic or LatinoMoved within same state 248 1.9% White / Caucasian231 7.9% Black or African American28 25.7% American Indian / Alaska Native14 0.8% Asian36 1.0% Other race119 2.0% Two or more races87 0.9% White alone, not Hispanic / Latino526 4.8% Hispanic or LatinoMoved from different state 144 1.1% White / Caucasian95 3.2% Black or African American76 4.3% Asian20 0.3% Two or more races138 1.4% White alone, not Hispanic / Latino30 0.3% Hispanic or LatinoMoved from abroad 15 0.1% White29 1.0% Black or African American108 6.1% Asian46 0.4% Hispanic or Latino
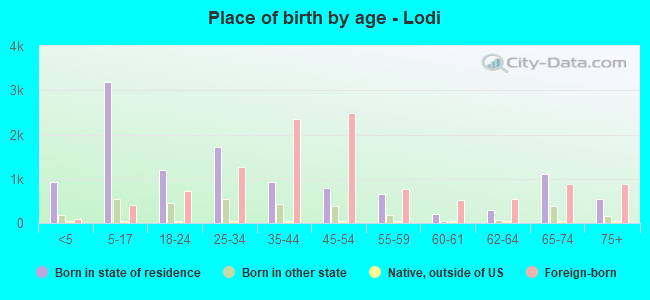
Children Nativity (place of birth) in Lodi
Children under 6 years - Living with two parents Both parents native 424 100.0% NativeBoth parents foreign-born 390 93.3% Native28 6.7% Foreign-bornOne native, one foreign-born parent 60 100.0% NativeChildren under 6 years - Living with one parent Native parent 208 100.0% NativeForeign-born parent 313 82.3% Native67 17.7% Foreign-bornChildren 6 to 17 years - Living with two parents Both parents native 572 96.3% Native22 3.7% Foreign-bornBoth parents foreign-born 1,317 82.2% Native285 17.8% Foreign-bornOne native, one foreign-born parent 213 100.0% NativeChildren 6 to 17 years - Living with one parent Native parent 255 100.0% NativeForeign-born parent 1,018 51.5% Native958 48.5% Foreign-born
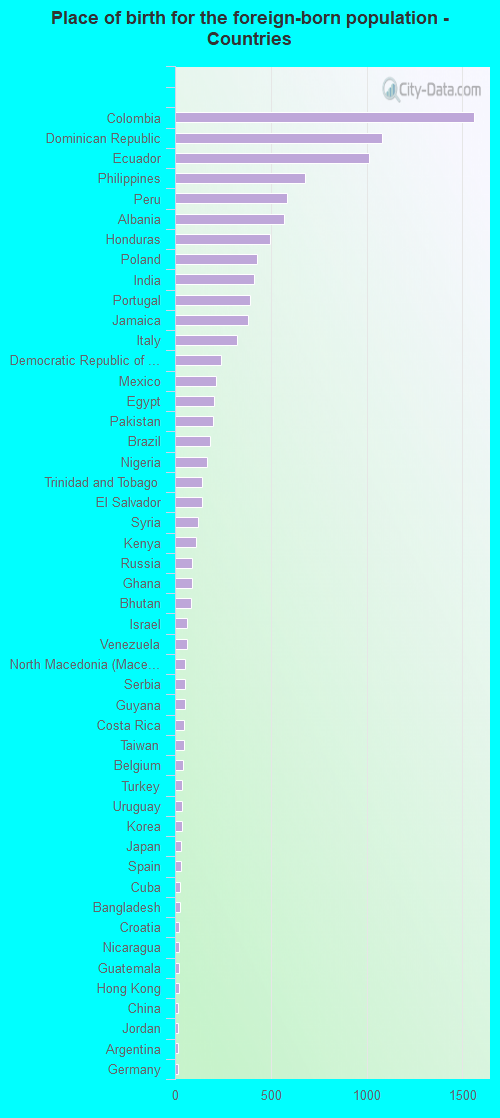
Place of birth for residents in Lodi 6,128 Americas6,086 Latin America3,512 South America2,078 Europe1,803 Asia1,629 Caribbean1,252 Eastern Europe945 Central America925 Africa748 Southern Europe719 South Central Asia693 South Eastern Asia301 Northern Africa257 Western Africa239 Western Asia238 Middle Africa150 Eastern Asia128 Eastern Africa83 China60 Western Europe42 Northern America16 Northern Europe1,561 Colombia1,079 Dominican Republic1,012 Ecuador681 Philippines587 Peru569 Albania496 Honduras429 Poland413 India393 Portugal379 Jamaica322 Italy238 Democratic Republic of Congo (Zaire)216 Mexico204 Egypt199 Pakistan185 Brazil167 Nigeria140 Trinidad and Tobago139 El Salvador120 Syria112 Kenya91 Russia90 Ghana82 Bhutan65 Israel61 Venezuela53 North Macedonia (Macedonia)53 Serbia50 Guyana47 Costa Rica45 Taiwan44 Belgium35 Turkey35 Uruguay34 Korea32 Japan31 Spain27 Cuba24 Bangladesh23 Croatia21 Nicaragua19 Guatemala19 Hong Kong18 China17 Jordan17 Argentina16 Germany14 United Kingdom11 Vietnam6 Tanzania5 Belize2 England2 Dominica
Grandparents responsible for own grandchildren in Lodi
Grandparents (30 to 59 years) White / Caucasian 13 28.8% Responsible for grandchildren33 71.2% Not responsible for grandchildrenTwo or more races 146 100.0% Not responsible for grandchildrenWhite alone, not Hispanic / Latino 15 35.9% Responsible for grandchildren26 64.1% Not responsible for grandchildrenHispanic or Latino 52 100.0% Not responsible for grandchildren
Grandparents (60 years and over) White / Caucasian 104 100.0% Not responsible for grandchildrenTwo or more races 224 100.0% Not responsible for grandchildrenWhite alone, not Hispanic / Latino 20 100.0% Not responsible for grandchildrenHispanic or Latino 288 100.0% Not responsible for grandchildren