Races in Lower Rutherford Creek, Tennessee (TN) Detailed Stats
Ancestries, Foreign-born residents, place of birth
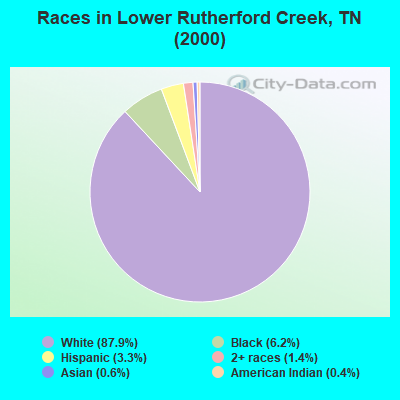
Race distribution in Lower Rutherford Creek

- 5,88787.9%White alone
- 4176.2%Black alone
- 2213.3%Hispanic
- 951.4%Two or more races
- 410.6%Asian alone
- 280.4%American Indian alone
- 50.07%Other race alone
- 20.03%Native Hawaiian and Other
Pacific Islander alone
2000
2022
-
- 4,505,93079.2%White alone
- 928,20416.3%Black alone
- 123,8382.2%Hispanic
- 54,8241.0%Two or more races
- 56,0771.0%Asian alone
- 13,8200.2%American Indian alone
- 4,7800.08%Other race alone
- 1,8100.03%Native Hawaiian and Other
Pacific Islander alone

-
- 5,070,02671.9%White alone
- 1,089,73815.5%Black alone
- 442,6296.3%Hispanic
- 279,3814.0%Two or more races
- 131,8171.9%Asian alone
- 26,9720.4%Other race alone
- 6,3870.09%American Indian alone
- 4,3890.06%Native Hawaiian and Other
Pacific Islander alone

Income and house value in Lower Rutherford Creek
- Median household income in 2022
- $90,247White non-Hispanic householders
- $91,779Black householders
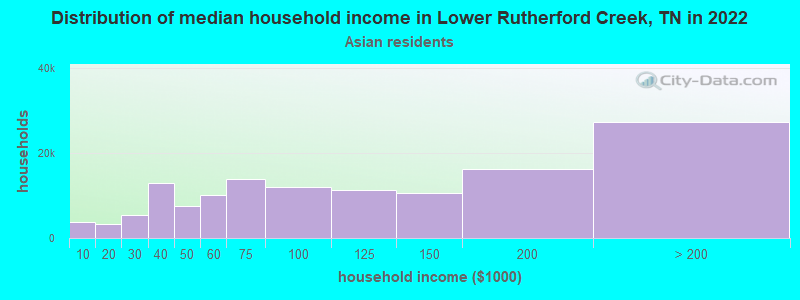
- $101,945Asian householders
- $114,787Some other race householders
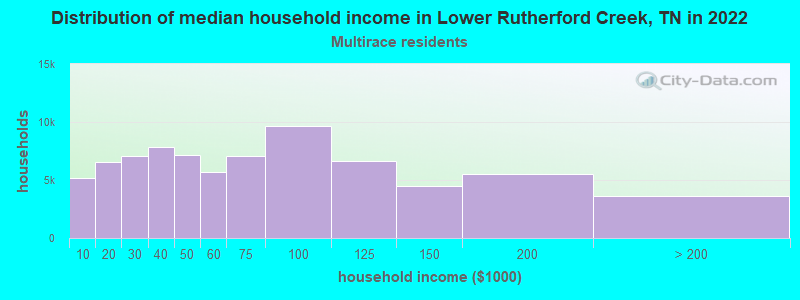
- $53,179Two or more races householders
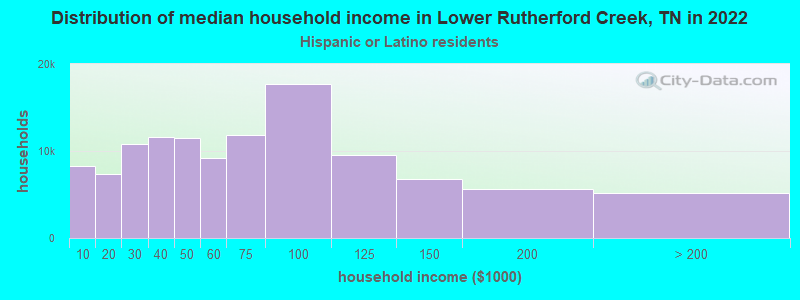
- $122,997Hispanic or Latino race householders
- Median 2022 house value
- $469,702White Non-Hispanic householders
- $425,425Black or African American householders
- over $1,000,000Asian householders
- $429,115Some other race householders
- $415,094Two or more races householders
- $430,960Hispanic or Latino householders
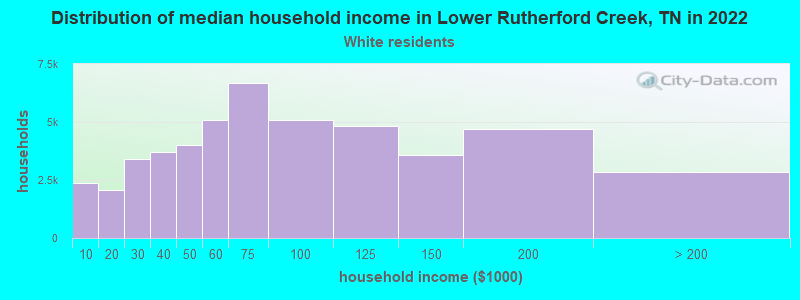
Household income for White non-Hispanic householders
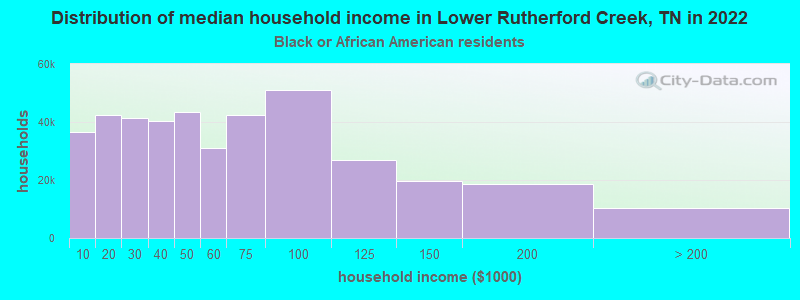
Household income for Black householders
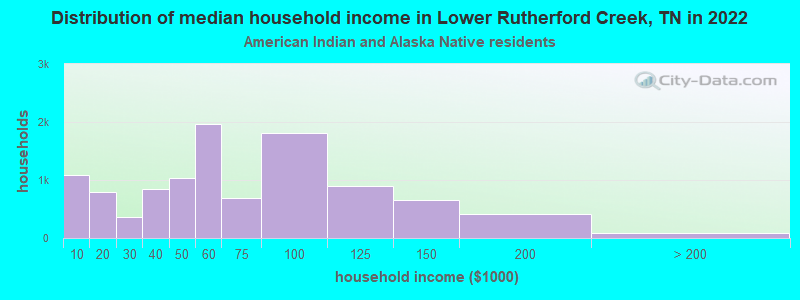
Household income for American Indian and Alaska Native householders
Household income for Asian householders
Household income for Two or more races householders
Household income for Hispanic or Latino race householders
Zip code: 38401