Races in Lower Valley-Somers, Montana (MT) Detailed Stats
Ancestries, Foreign-born residents, place of birth
Race distribution in Lower Valley-Somers

- 3,78496.3%White alone
- 631.6%Hispanic
- 370.9%Two or more races
- 230.6%American Indian alone
- 140.4%Asian alone
- 40.1%Other race alone
- 30.08%Native Hawaiian and Other
Pacific Islander alone - 10.03%Black alone

2000
2022
-
- 807,82389.5%White alone
- 54,4266.0%American Indian alone
- 18,0812.0%Hispanic
- 13,7681.5%Two or more races
- 4,5690.5%Asian alone
- 2,5340.3%Black alone
- 5690.06%Other race alone
- 4250.05%Native Hawaiian and Other
Pacific Islander alone

-
- 937,36583.5%White alone
- 58,7485.2%American Indian alone
- 55,1724.9%Two or more races
- 49,8304.4%Hispanic
- 9,0120.8%Other race alone
- 7,7000.7%Asian alone
- 3,4280.3%Black alone
- 1,6120.1%Native Hawaiian and Other
Pacific Islander alone

Income and house value in Lower Valley-Somers
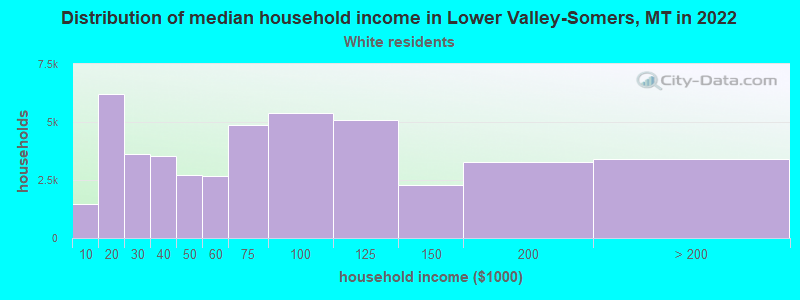
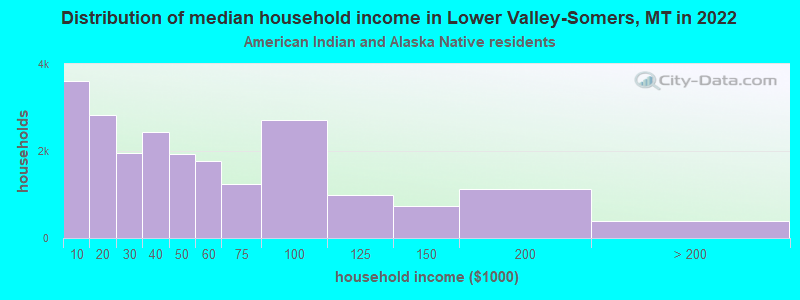
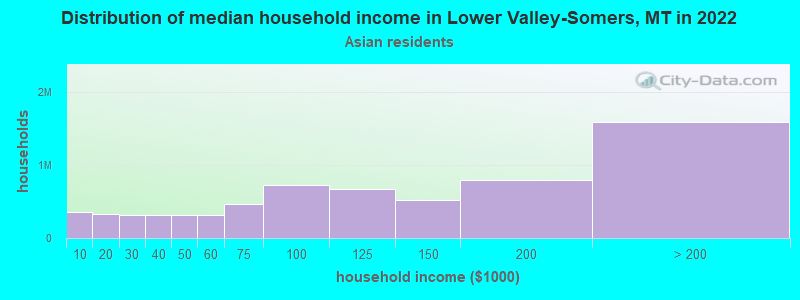
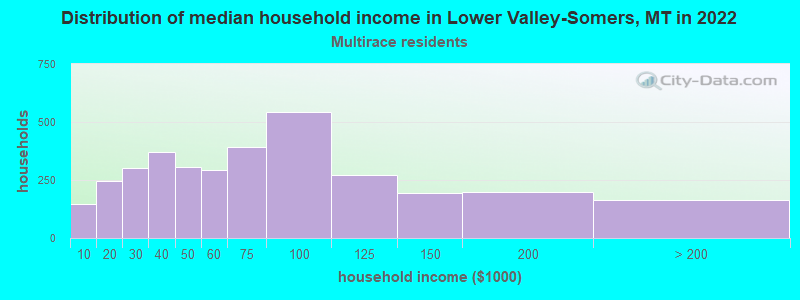
- Median household income in 2022
- $68,262White non-Hispanic householders
- $53,865American Indian and Alaska Native householders
- $74,902Asian householders
- $20,700Some other race householders
- $18,729Two or more races householders
- $32,179Hispanic or Latino race householders
- Median 2022 house value
- $666,995White Non-Hispanic householders
- $624,314Some other race householders
- $340,535Two or more races householders
- $605,244Hispanic or Latino householders
Household income for White non-Hispanic householders
Household income for American Indian and Alaska Native householders
Household income for Asian householders
Household income for Two or more races householders
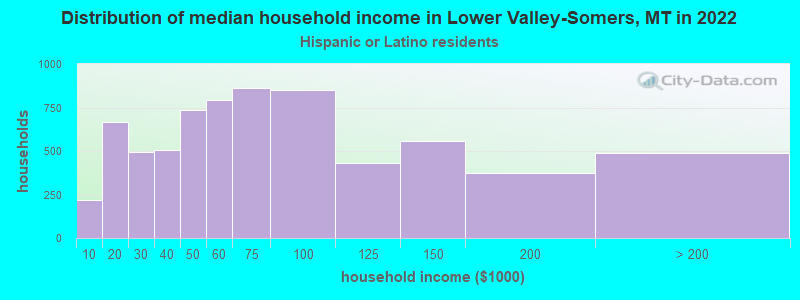
Household income for Hispanic or Latino race householders
Zip code: 59922