Races in Lumberton, North Carolina (NC) Detailed Stats
Data:
Races - White alone (%)
Races - White alone (% change since 2000)
Races - Black alone (%)
Races - Black alone (% change since 2000)
Races - American Indian alone (%)
Races - American Indian alone (% change since 2000)
Races - Asian alone (%)
Races - Asian alone (% change since 2000)
Races - Hispanic (%)
Races - Hispanic (% change since 2000)
Races - Native Hawaiian and Other Pacific Islander alone (%)
Races - Native Hawaiian and Other Pacific Islander alone (% change since 2000)
Races - Two or more races(%)
Races - Two or more races(% change since 2000)
Races - Other race alone (%)
Races - Other race alone (% change since 2000)
Racial diversity
Place of birth - Born in state of residence (%)
Place of birth - Born in state of residence (%) - White
Place of birth - Born in state of residence (%) - Black or African American
Place of birth - Born in state of residence (%) - Asian
Place of birth - Born in state of residence (%) - Hispanic or Latino
Place of birth - Born in state of residence (%) - American Indian and Alaska Native
Place of birth - Born in state of residence (%) - Multirace
Place of birth - Born in state of residence (%) - Other Race
Place of birth - Born in other state (%)
Place of birth - Born in other state (%) - White
Place of birth - Born in other state (%) - Black or African American
Place of birth - Born in other state (%) - Asian
Place of birth - Born in other state (%) - Hispanic or Latino
Place of birth - Born in other state (%) - American Indian and Alaska Native
Place of birth - Born in other state (%) - Multirace
Place of birth - Born in other state (%) - Other Race
Place of birth - Native, outside of US (%)
Place of birth - Native, outside of US (%) - White
Place of birth - Native, outside of US (%) - Black or African American
Place of birth - Native, outside of US (%) - Asian
Place of birth - Native, outside of US (%) - Hispanic or Latino
Place of birth - Native, outside of US (%) - American Indian and Alaska Native
Place of birth - Native, outside of US (%) - Multirace
Place of birth - Native, outside of US (%) - Other Race
Place of birth - Foreign born (%)
Place of birth - Foreign born (%) - White
Place of birth - Foreign born (%) - Black or African American
Place of birth - Foreign born (%) - Asian
Place of birth - Foreign born (%) - Hispanic or Latino
Place of birth - Foreign born (%) - American Indian and Alaska Native
Place of birth - Foreign born (%) - Multirace
Place of birth - Foreign born (%) - Other Race
Residents speaking English at home (%)
Residents speaking English at home - Born in the United States (%)
Residents speaking English at home - Native, born elsewhere (%)
Residents speaking English at home - Foreign born (%)
Residents speaking Spanish at home (%)
Residents speaking Spanish at home - Born in the United States (%)
Residents speaking Spanish at home - Native, born elsewhere (%)
Residents speaking Spanish at home - Foreign born (%)
Residents speaking other language at home (%)
Residents speaking other language at home - Born in the United States (%)
Residents speaking other language at home - Native, born elsewhere (%)
Residents speaking other language at home - Foreign born (%)
Marital status - Never married (%)
Marital status - Now married (%)
Marital status - Separated (%)
Marital status - Widowed (%)
Marital status - Divorced (%)
Ancestries Reported - Arab (%)
Ancestries Reported - Czech (%)
Ancestries Reported - Danish (%)
Ancestries Reported - Dutch (%)
Ancestries Reported - English (%)
Ancestries Reported - French (%)
Ancestries Reported - French Canadian (%)
Ancestries Reported - German (%)
Ancestries Reported - Greek (%)
Ancestries Reported - Hungarian (%)
Ancestries Reported - Irish (%)
Ancestries Reported - Italian (%)
Ancestries Reported - Lithuanian (%)
Ancestries Reported - Norwegian (%)
Ancestries Reported - Polish (%)
Ancestries Reported - Portuguese (%)
Ancestries Reported - Russian (%)
Ancestries Reported - Scotch-Irish (%)
Ancestries Reported - Scottish (%)
Ancestries Reported - Slovak (%)
Ancestries Reported - Subsaharan African (%)
Ancestries Reported - Swedish (%)
Ancestries Reported - Swiss (%)
Ancestries Reported - Ukrainian (%)
Ancestries Reported - United States (%)
Ancestries Reported - Welsh (%)
Ancestries Reported - West Indian (%)
Ancestries Reported - Other (%)
Geographical mobility - Same house 1 year ago (%)
Geographical mobility - Same house 1 year ago (%) - White
Geographical mobility - Same house 1 year ago (%) - Black or African American
Geographical mobility - Same house 1 year ago (%) - Asian
Geographical mobility - Same house 1 year ago (%) - Hispanic or Latino
Geographical mobility - Same house 1 year ago (%) - American Indian and Alaska Native
Geographical mobility - Same house 1 year ago (%) - Multirace
Geographical mobility - Same house 1 year ago (%) - Other Race
Geographical mobility - Moved within same county (%)
Geographical mobility - Moved within same county (%) - White
Geographical mobility - Moved within same county (%) - Black or African American
Geographical mobility - Moved within same county (%) - Asian
Geographical mobility - Moved within same county (%) - Hispanic or Latino
Geographical mobility - Moved within same county (%) - American Indian and Alaska Native
Geographical mobility - Moved within same county (%) - Multirace
Geographical mobility - Moved within same county (%) - Other Race
Geographical mobility - Moved from different county within same state (%)
Geographical mobility - Moved from different county within same state (%) - White
Geographical mobility - Moved from different county within same state (%) - Black or African American
Geographical mobility - Moved from different county within same state (%) - Asian
Geographical mobility - Moved from different county within same state (%) - Hispanic or Latino
Geographical mobility - Moved from different county within same state (%) - American Indian and Alaska Native
Geographical mobility - Moved from different county within same state (%) - Multirace
Geographical mobility - Moved from different county within same state (%) - Other Race
Geographical mobility - Moved from different state (%)
Geographical mobility - Moved from different state (%) - White
Geographical mobility - Moved from different state (%) - Black or African American
Geographical mobility - Moved from different state (%) - Asian
Geographical mobility - Moved from different state (%) - Hispanic or Latino
Geographical mobility - Moved from different state (%) - American Indian and Alaska Native
Geographical mobility - Moved from different state (%) - Multirace
Geographical mobility - Moved from different state (%) - Other Race
Geographical mobility - Moved from abroad (%)
Geographical mobility - Moved from abroad (%) - White
Geographical mobility - Moved from abroad (%) - Black or African American
Geographical mobility - Moved from abroad (%) - Asian
Geographical mobility - Moved from abroad (%) - Hispanic or Latino
Geographical mobility - Moved from abroad (%) - American Indian and Alaska Native
Geographical mobility - Moved from abroad (%) - Multirace
Geographical mobility - Moved from abroad (%) - Other Race
Place of birth for the foreign-born population - Ireland (%)
Place of birth for the foreign-born population - Denmark (%)
Place of birth for the foreign-born population - Norway (%)
Place of birth for the foreign-born population - Sweden (%)
Place of birth for the foreign-born population - United Kingdom (%)
Place of birth for the foreign-born population - England (%)
Place of birth for the foreign-born population - Scotland (%)
Place of birth for the foreign-born population - Other Northern Europe (%)
Place of birth for the foreign-born population - Austria (%)
Place of birth for the foreign-born population - Belgium (%)
Place of birth for the foreign-born population - France (%)
Place of birth for the foreign-born population - Germany (%)
Place of birth for the foreign-born population - Netherlands (%)
Place of birth for the foreign-born population - Switzerland (%)
Place of birth for the foreign-born population - Other Western Europe (%)
Place of birth for the foreign-born population - Greece (%)
Place of birth for the foreign-born population - Italy (%)
Place of birth for the foreign-born population - Portugal (%)
Place of birth for the foreign-born population - Spain (%)
Place of birth for the foreign-born population - Other Southern Europe (%)
Place of birth for the foreign-born population - Albania (%)
Place of birth for the foreign-born population - Belarus (%)
Place of birth for the foreign-born population - Bosnia and Herzegovina (%)
Place of birth for the foreign-born population - Bulgaria (%)
Place of birth for the foreign-born population - Croatia (%)
Place of birth for the foreign-born population - Czechoslovakia (%)
Place of birth for the foreign-born population - Hungary (%)
Place of birth for the foreign-born population - Latvia (%)
Place of birth for the foreign-born population - Lithuania (%)
Place of birth for the foreign-born population - North Macedonia (Macedonia) (%)
Place of birth for the foreign-born population - Moldova (%)
Place of birth for the foreign-born population - Poland (%)
Place of birth for the foreign-born population - Romania (%)
Place of birth for the foreign-born population - Russia (%)
Place of birth for the foreign-born population - Serbia (%)
Place of birth for the foreign-born population - Ukraine (%)
Place of birth for the foreign-born population - Other Eastern Europe (%)
Place of birth for the foreign-born population - China (%)
Place of birth for the foreign-born population - Hong Kong (%)
Place of birth for the foreign-born population - Taiwan (%)
Place of birth for the foreign-born population - Japan (%)
Place of birth for the foreign-born population - Korea (%)
Place of birth for the foreign-born population - Other Eastern Asia (%)
Place of birth for the foreign-born population - Afghanistan (%)
Place of birth for the foreign-born population - Bangladesh (%)
Place of birth for the foreign-born population - India (%)
Place of birth for the foreign-born population - Iran (%)
Place of birth for the foreign-born population - Kazakhstan (%)
Place of birth for the foreign-born population - Nepal (%)
Place of birth for the foreign-born population - Pakistan (%)
Place of birth for the foreign-born population - Sri Lanka (%)
Place of birth for the foreign-born population - Uzbekistan (%)
Place of birth for the foreign-born population - Other South Central Asia (%)
Place of birth for the foreign-born population - Burma (%)
Place of birth for the foreign-born population - Cambodia (%)
Place of birth for the foreign-born population - Indonesia (%)
Place of birth for the foreign-born population - Laos (%)
Place of birth for the foreign-born population - Malaysia (%)
Place of birth for the foreign-born population - Philippines (%)
Place of birth for the foreign-born population - Singapore (%)
Place of birth for the foreign-born population - Thailand (%)
Place of birth for the foreign-born population - Vietnam (%)
Place of birth for the foreign-born population - Other South Eastern Asia (%)
Place of birth for the foreign-born population - Armenia (%)
Place of birth for the foreign-born population - Iraq (%)
Place of birth for the foreign-born population - Israel (%)
Place of birth for the foreign-born population - Jordan (%)
Place of birth for the foreign-born population - Kuwait (%)
Place of birth for the foreign-born population - Lebanon (%)
Place of birth for the foreign-born population - Saudi Arabia (%)
Place of birth for the foreign-born population - Syria (%)
Place of birth for the foreign-born population - Turkey (%)
Place of birth for the foreign-born population - Yemen (%)
Place of birth for the foreign-born population - Other Western Asia (%)
Place of birth for the foreign-born population - Eritrea (%)
Place of birth for the foreign-born population - Ethiopia (%)
Place of birth for the foreign-born population - Kenya (%)
Place of birth for the foreign-born population - Somalia (%)
Place of birth for the foreign-born population - Uganda (%)
Place of birth for the foreign-born population - Zimbabwe (%)
Place of birth for the foreign-born population - Other Eastern Africa (%)
Place of birth for the foreign-born population - Cameroon (%)
Place of birth for the foreign-born population - Congo (%)
Place of birth for the foreign-born population - Democratic Republic of Congo (Zaire) (%)
Place of birth for the foreign-born population - Other Middle Africa (%)
Place of birth for the foreign-born population - Egypt (%)
Place of birth for the foreign-born population - Morocco (%)
Place of birth for the foreign-born population - Sudan (%)
Place of birth for the foreign-born population - Other Northern Africa (%)
Place of birth for the foreign-born population - South Africa (%)
Place of birth for the foreign-born population - Other Southern Africa (%)
Place of birth for the foreign-born population - Cabo Verde (%)
Place of birth for the foreign-born population - Ghana (%)
Place of birth for the foreign-born population - Liberia (%)
Place of birth for the foreign-born population - Nigeria (%)
Place of birth for the foreign-born population - Senegal (%)
Place of birth for the foreign-born population - Sierra Leone (%)
Place of birth for the foreign-born population - Other Western Africa (%)
Place of birth for the foreign-born population - Australia (%)
Place of birth for the foreign-born population - New Zealand (%)
Place of birth for the foreign-born population - Fiji (%)
Place of birth for the foreign-born population - Micronesia (%)
Place of birth for the foreign-born population - Bahamas (%)
Place of birth for the foreign-born population - Barbados (%)
Place of birth for the foreign-born population - Cuba (%)
Place of birth for the foreign-born population - Dominica (%)
Place of birth for the foreign-born population - Dominican Republic (%)
Place of birth for the foreign-born population - Grenada (%)
Place of birth for the foreign-born population - Haiti (%)
Place of birth for the foreign-born population - Jamaica (%)
Place of birth for the foreign-born population - St. Vincent and the Grenadines (%)
Place of birth for the foreign-born population - Trinidad and Tobago (%)
Place of birth for the foreign-born population - West Indies (%)
Place of birth for the foreign-born population - Other Caribbean (%)
Place of birth for the foreign-born population - Belize (%)
Place of birth for the foreign-born population - Costa Rica (%)
Place of birth for the foreign-born population - El Salvador (%)
Place of birth for the foreign-born population - Guatemala (%)
Place of birth for the foreign-born population - Honduras (%)
Place of birth for the foreign-born population - Mexico (%)
Place of birth for the foreign-born population - Nicaragua (%)
Place of birth for the foreign-born population - Panama (%)
Place of birth for the foreign-born population - Other Central America (%)
Place of birth for the foreign-born population - Argentina (%)
Place of birth for the foreign-born population - Bolivia (%)
Place of birth for the foreign-born population - Brazil (%)
Place of birth for the foreign-born population - Chile (%)
Place of birth for the foreign-born population - Colombia (%)
Place of birth for the foreign-born population - Ecuador (%)
Place of birth for the foreign-born population - Guyana (%)
Place of birth for the foreign-born population - Peru (%)
Place of birth for the foreign-born population - Uruguay (%)
Place of birth for the foreign-born population - Venezuela (%)
Place of birth for the foreign-born population - Other South America (%)
Place of birth for the foreign-born population - Canada (%)
Place of birth for the foreign-born population - Other Northern America (%)
Place of birth for the foreign-born population - Other (%)
Latest news about races in Lumberton, NC collected exclusively by city-data.com from local newspapers, TV, and radio stations
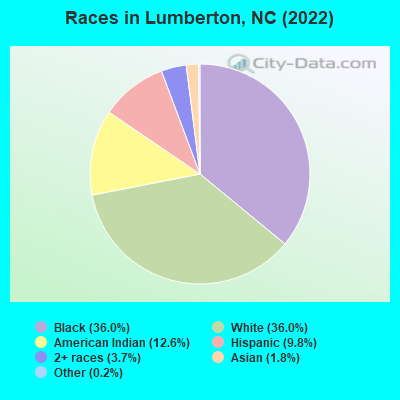
According to 2022 data, the most numerous races in Lumberton, NC are White alone (6,818 residents), Black alone (6,831 residents), and Hispanic (1,866 residents). 89.3% of Lumberton residents speak English at home. 7.6% of Lumberton, NC residents are foreign-born (4.5% born in Latin America, 1.4% born in Asia), which is 4.7% less than the foreign-born rate of 8.0% across the entire state of North Carolina.
Race distribution in Lumberton
2000 2022
5,647,155 70.2% White alone 1,723,301 21.4% Black alone 378,963 4.7% Hispanic 112,416 1.4% Asian alone 95,333 1.2% American Indian alone 79,965 1.0% Two or more races 9,015 0.1% Other race alone 3,165 0.04% Native Hawaiian and Other
6,497,519 60.7% White alone 2,155,650 20.1% Black alone 1,114,799 10.4% Hispanic 438,061 4.1% Two or more races 341,052 3.2% Asian alone 91,758 0.9% American Indian alone 50,180 0.5% Other race alone 9,954 0.09% Native Hawaiian and Other
Income and house value in Lumberton Median household income in 2022 $60,155 White non-Hispanic householders$21,858 Black householders$21,798 American Indian and Alaska Native householders$109,012 Asian householders$49,130 Some other race householders$95,102 Two or more races householders$51,561 Hispanic or Latino race householdersMedian 2022 house value $150,493 White Non-Hispanic householders$127,448 Black or African American householders$97,991 American Indian or Alaska Native householders $150,293 Asian householders$178,748 Native Hawaiian and other Pacific Islander householders$174,340 Two or more races householders$170,332 Hispanic or Latino householders
Median age by race in Lumberton
49.3 Median age for White residents46.1 53.9 32.7 Median age for Black or African American residents33.1 32.0 36.8 Median age for American Indian / Alaska Native residents39.8 33.4 29.6 Median age for Asian residents85.8 24.9 -609,884,331.7 Median age for Native Hawaiian / Pacific Islander residents-611,708,482.1 -666,666,666.0 16.6 Median age for Other race residents18.5 16.9 18.3 Median age for Two or more races residents14.1 25.6 49.2 Median age for White alone residents45.5 53.5 14.8 Median age for Hispanic or Latino residents14.1 16.2
Owner/renter occupied households by race in Lumberton
House owners and renters - White residents 1,951 67.5% Owner occupied939 32.5% Renter occupiedHouse owners and renters - Black or African American residents 759 30.6% Owner occupied1,720 69.4% Renter occupiedHouse owners and renters - American Indian / Alaska Native residents 426 38.1% Owner occupied693 61.9% Renter occupiedHouse owners and renters - Asian residents 22 34.7% Owner occupied41 65.3% Renter occupiedHouse owners and renters - Other race residents 56 25.8% Owner occupied162 74.2% Renter occupiedHouse owners and renters - Two or more races residents 45 29.5% Owner occupied107 70.5% Renter occupiedHouse owners and renters - White alone residents 1,900 66.4% Owner occupied960 33.6% Renter occupiedHouse owners and renters - Hispanic or Latino residents 113 37.7% Owner occupied187 62.3% Renter occupied
Language usage in Lumberton
English speakers - Total 89.3% of residents of Lumberton speak English at home.
7.5% of residents speak Spanish at home 747 57.2% Speak English very well559 42.8% Speak English less than very well3.9% of residents speak other language at home 296 43.1% Speak English very well390 56.9% Speak English less than very well
English speakers - Born in the United States 85.8% of residents of Lumberton speak English at home.
7.6% of residents speak Spanish at home 235 85.1% Speak English very well41 14.9% Speak English less than very well1.3% of residents speak other language at home 48 100.0% Speak English very well
English speakers - Native, born elsewhere 63.0% of residents of Lumberton speak English at home.
14.1% of residents speak Spanish at home 17 89.5% Speak English very well2 10.5% Speak English less than very well
English speakers - Foreign-born 12.2% of residents of Lumberton speak English at home.
49.7% of residents speak Spanish at home 263 45.6% Speak English very well314 54.4% Speak English less than very well56.6% of residents speak other language at home 271 41.2% Speak English very well386 58.8% Speak English less than very well
White (Caucasian) - Speak only English Native:
98.5% (6,510)Foreign-born:
35.5% (53)
White (Caucasian) - Speak another language Native:
1.7% (112)Foreign-born:
62.6% (94)
Black or African American - Speak only English Native:
98.5% (5,833)Foreign-born:
19.1% (64)
Black or African American - Speak another language Native:
1.5% (89)Foreign-born:
80.5% (272)
American Indian / Alaska Native - Speak only English Native:
96.5% (2,291)Foreign-born:
53.7% (9)
Asian - Speak only English Native:
72.3% (26)Foreign-born:
34.8% (82)
Asian - Speak another language Native:
27.4% (10)Foreign-born:
64.8% (153)
Other race - Speak only English Native:
43.4% (286)Foreign-born:
4.8% (23)
Other race - Speak another language Native:
57.9% (382)Foreign-born:
100.0% (473)
Two or more races - Speak another language Native:
7.1% (53)Foreign-born:
100.0% (28)
White alone - Speak only English Native:
99.4% (6,736)Foreign-born:
62.7% (55)
White alone - Speak another language Native:
0.5% (34)Foreign-born:
37.3% (33)
Hispanic or Latino - Speak only English Native:
46.2% (442)Foreign-born:
1.6% (9)
Hispanic or Latino - Speak another language Native:
55.9% (536)Foreign-born:
98.6% (569)
Foreign-born residents in Lumberton 1,448 residents are foreign born (4.5% Latin America , 1.4% Asia ).
This city:
7.6%North Carolina:
8.3%
Marital status for residents in Lumberton Marital status - White (Caucasian) population 15 years and over
Males 34.0% Never married47.5% Now married1.5% Separated4.5% Widowed12.6% DivorcedFemales 20.0% Never married41.7% Now married3.6% Separated20.4% Widowed14.4% DivorcedWomen who gave birth in the past 12 months Now married:
70.0% (31)Unmarried:
30.0% (13)
Women who did not give birth in the past 12 months Now married:
48.6% (511)Unmarried:
51.4% (541)
Marital status - Black or African American population 15 years and over
Males 56.1% Never married19.6% Now married6.8% Separated3.1% Widowed14.4% DivorcedFemales 53.4% Never married15.9% Now married3.4% Separated15.9% Widowed11.5% DivorcedWomen who gave birth in the past 12 months Now married:
11.9% (14)Unmarried:
88.1% (104)
Women who did not give birth in the past 12 months Now married:
17.0% (241)Unmarried:
83.0% (1,177)
Marital status - American Indian / Alaska Native population 15 years and over
Males 55.0% Never married23.6% Now married4.2% Separated3.6% Widowed13.6% DivorcedFemales 44.0% Never married21.4% Now married1.5% Separated15.5% Widowed17.6% DivorcedWomen who gave birth in the past 12 months Now married:
55.3% (21)Unmarried:
44.7% (17)
Women who did not give birth in the past 12 months Now married:
17.5% (118)Unmarried:
82.5% (559)
Marital status - Asian population 15 years and over
Males 58.2% Never married35.8% Now married3.7% Separated0.0% Widowed2.2% DivorcedFemales 41.6% Never married52.8% Now married4.0% Separated0.0% Widowed1.6% DivorcedWomen who did not give birth in the past 12 months Now married:
44.9% (46)Unmarried:
55.1% (57)
Marital status - Other race population 15 years and over
Males 61.6% Never married36.2% Now married0.8% Separated0.0% Widowed1.4% DivorcedFemales 54.2% Never married37.2% Now married5.3% Separated0.0% Widowed3.3% DivorcedWomen who gave birth in the past 12 months Now married:
100.0% (27)Unmarried:
0.0% (0)
Women who did not give birth in the past 12 months Now married:
41.4% (128)Unmarried:
58.6% (181)
Marital status - Two or more races population 15 years and over
Males 75.4% Never married22.0% Now married0.0% Separated0.0% Widowed2.6% DivorcedFemales 37.2% Never married40.6% Now married4.8% Separated11.1% Widowed6.3% DivorcedWomen who gave birth in the past 12 months Now married:
100.0% (26)Unmarried:
0.0% (0)
Women who did not give birth in the past 12 months Now married:
36.8% (77)Unmarried:
63.2% (131)
Marital status - White alone, not Hispanic / Latino population 15 years and over
Males 34.3% Never married46.8% Now married1.5% Separated4.4% Widowed13.0% DivorcedFemales 19.6% Never married41.6% Now married3.5% Separated20.6% Widowed14.7% DivorcedWomen who gave birth in the past 12 months Now married:
70.0% (32)Unmarried:
30.0% (14)
Women who did not give birth in the past 12 months Now married:
48.6% (506)Unmarried:
51.4% (534)
Marital status - Hispanic or Latino population 15 years and over
Males 55.7% Never married40.0% Now married1.7% Separated1.5% Widowed1.1% DivorcedFemales 47.1% Never married39.2% Now married5.0% Separated5.3% Widowed3.3% DivorcedWomen who gave birth in the past 12 months Now married:
100.0% (35)Unmarried:
0.0% (0)
Women who did not give birth in the past 12 months Now married:
39.8% (146)Unmarried:
60.2% (220)
Ancestries in Lumberton
5,113 33.2% American599 3.9% English216 1.4% Irish169 1.1% Scotch-Irish168 1.1% African167 1.1% Scottish94 0.6% European93 0.6% German80 0.5% Haitian57 0.4% French51 0.3% Nigerian34 0.2% Polish26 0.2% British21 0.1% Scandinavian18 0.1% Norwegian16 0.1% Eastern European16 0.1% Italian15 0.10% Ukrainian10 0.06% Ethiopian10 0.06% Sudanese9 0.06% Swedish8 0.05% Israeli7 0.05% French Canadian5 0.03% Austrian3 0.02% Canadian
Geographical mobility in Lumberton Same house 1 year ago 6,445 93.6% White (Caucasian)5,870 88.1% Black or African American2,451 94.1% American Indian / Alaska Native277 100.0% Asian1,476 89.5% Other race751 78.5% Two or more races6,320 93.6% White alone, not Hispanic / Latino1,578 84.6% Hispanic or LatinoMoved within same county 167 2.4% White / Caucasian601 9.0% Black or African American111 4.2% American Indian / Alaska Native3 1.0% Asian78 4.7% Other race110 11.5% Two or more races167 2.5% White alone, not Hispanic / Latino119 6.4% Hispanic or LatinoMoved within same state 162 2.4% White / Caucasian164 2.5% Black or African American16 0.6% American Indian / Alaska Native36 2.2% Other race173 2.6% White alone, not Hispanic / Latino35 1.9% Hispanic or LatinoMoved from different state 110 1.6% White / Caucasian309 4.6% Black or African American27 1.1% American Indian / Alaska Native57 3.4% Other race79 8.3% Two or more races86 1.3% White alone, not Hispanic / Latino127 6.8% Hispanic or LatinoMoved from abroad 0 0.0% White1 0.1% Hispanic or Latino
Children Nativity (place of birth) in Lumberton
Children under 6 years - Living with two parents Both parents native 582 100.0% Native0 0.0% Foreign-bornBoth parents foreign-born 76 74.6% Native26 25.4% Foreign-bornOne native, one foreign-born parent 46 100.0% NativeChildren under 6 years - Living with one parent Native parent 921 100.0% NativeForeign-born parent 29 100.0% NativeChildren 6 to 17 years - Living with two parents Both parents native 940 100.0% NativeBoth parents foreign-born 86 35.1% Native160 64.9% Foreign-bornOne native, one foreign-born parent 18 100.0% NativeChildren 6 to 17 years - Living with one parent Native parent 1,694 100.0% NativeForeign-born parent 112 53.4% Native98 46.6% Foreign-born
Grandparents responsible for own grandchildren in Lumberton
Grandparents (30 to 59 years) White / Caucasian 24 58.6% Responsible for grandchildren17 41.4% Not responsible for grandchildrenBlack or African American 38 57.1% Responsible for grandchildren28 42.9% Not responsible for grandchildrenAmerican Indian / Alaska Native 51 100.0% Responsible for grandchildrenOther race 6 100.0% Not responsible for grandchildrenWhite alone, not Hispanic / Latino 26 59.4% Responsible for grandchildren18 40.6% Not responsible for grandchildrenHispanic or Latino 5 100.0% Not responsible for grandchildrenGrandparents (60 years and over) White / Caucasian 126 91.2% Responsible for grandchildren12 8.8% Not responsible for grandchildrenBlack or African American 9 11.9% Responsible for grandchildren63 88.1% Not responsible for grandchildrenAmerican Indian / Alaska Native 30 82.0% Responsible for grandchildren7 18.0% Not responsible for grandchildrenWhite alone, not Hispanic / Latino 72 90.9% Responsible for grandchildren7 9.1% Not responsible for grandchildren