Races in Maili, Hawaii (HI) Detailed Stats
Data:
Races - White alone (%)
Races - White alone (% change since 2000)
Races - Black alone (%)
Races - Black alone (% change since 2000)
Races - American Indian alone (%)
Races - American Indian alone (% change since 2000)
Races - Asian alone (%)
Races - Asian alone (% change since 2000)
Races - Hispanic (%)
Races - Hispanic (% change since 2000)
Races - Native Hawaiian and Other Pacific Islander alone (%)
Races - Native Hawaiian and Other Pacific Islander alone (% change since 2000)
Races - Two or more races(%)
Races - Two or more races(% change since 2000)
Races - Other race alone (%)
Races - Other race alone (% change since 2000)
Racial diversity
Place of birth - Born in state of residence (%)
Place of birth - Born in state of residence (%) - White
Place of birth - Born in state of residence (%) - Black or African American
Place of birth - Born in state of residence (%) - Asian
Place of birth - Born in state of residence (%) - Hispanic or Latino
Place of birth - Born in state of residence (%) - American Indian and Alaska Native
Place of birth - Born in state of residence (%) - Multirace
Place of birth - Born in state of residence (%) - Other Race
Place of birth - Born in other state (%)
Place of birth - Born in other state (%) - White
Place of birth - Born in other state (%) - Black or African American
Place of birth - Born in other state (%) - Asian
Place of birth - Born in other state (%) - Hispanic or Latino
Place of birth - Born in other state (%) - American Indian and Alaska Native
Place of birth - Born in other state (%) - Multirace
Place of birth - Born in other state (%) - Other Race
Place of birth - Native, outside of US (%)
Place of birth - Native, outside of US (%) - White
Place of birth - Native, outside of US (%) - Black or African American
Place of birth - Native, outside of US (%) - Asian
Place of birth - Native, outside of US (%) - Hispanic or Latino
Place of birth - Native, outside of US (%) - American Indian and Alaska Native
Place of birth - Native, outside of US (%) - Multirace
Place of birth - Native, outside of US (%) - Other Race
Place of birth - Foreign born (%)
Place of birth - Foreign born (%) - White
Place of birth - Foreign born (%) - Black or African American
Place of birth - Foreign born (%) - Asian
Place of birth - Foreign born (%) - Hispanic or Latino
Place of birth - Foreign born (%) - American Indian and Alaska Native
Place of birth - Foreign born (%) - Multirace
Place of birth - Foreign born (%) - Other Race
Residents speaking English at home (%)
Residents speaking English at home - Born in the United States (%)
Residents speaking English at home - Native, born elsewhere (%)
Residents speaking English at home - Foreign born (%)
Residents speaking Spanish at home (%)
Residents speaking Spanish at home - Born in the United States (%)
Residents speaking Spanish at home - Native, born elsewhere (%)
Residents speaking Spanish at home - Foreign born (%)
Residents speaking other language at home (%)
Residents speaking other language at home - Born in the United States (%)
Residents speaking other language at home - Native, born elsewhere (%)
Residents speaking other language at home - Foreign born (%)
Marital status - Never married (%)
Marital status - Now married (%)
Marital status - Separated (%)
Marital status - Widowed (%)
Marital status - Divorced (%)
Ancestries Reported - Arab (%)
Ancestries Reported - Czech (%)
Ancestries Reported - Danish (%)
Ancestries Reported - Dutch (%)
Ancestries Reported - English (%)
Ancestries Reported - French (%)
Ancestries Reported - French Canadian (%)
Ancestries Reported - German (%)
Ancestries Reported - Greek (%)
Ancestries Reported - Hungarian (%)
Ancestries Reported - Irish (%)
Ancestries Reported - Italian (%)
Ancestries Reported - Lithuanian (%)
Ancestries Reported - Norwegian (%)
Ancestries Reported - Polish (%)
Ancestries Reported - Portuguese (%)
Ancestries Reported - Russian (%)
Ancestries Reported - Scotch-Irish (%)
Ancestries Reported - Scottish (%)
Ancestries Reported - Slovak (%)
Ancestries Reported - Subsaharan African (%)
Ancestries Reported - Swedish (%)
Ancestries Reported - Swiss (%)
Ancestries Reported - Ukrainian (%)
Ancestries Reported - United States (%)
Ancestries Reported - Welsh (%)
Ancestries Reported - West Indian (%)
Ancestries Reported - Other (%)
Geographical mobility - Same house 1 year ago (%)
Geographical mobility - Same house 1 year ago (%) - White
Geographical mobility - Same house 1 year ago (%) - Black or African American
Geographical mobility - Same house 1 year ago (%) - Asian
Geographical mobility - Same house 1 year ago (%) - Hispanic or Latino
Geographical mobility - Same house 1 year ago (%) - American Indian and Alaska Native
Geographical mobility - Same house 1 year ago (%) - Multirace
Geographical mobility - Same house 1 year ago (%) - Other Race
Geographical mobility - Moved within same county (%)
Geographical mobility - Moved within same county (%) - White
Geographical mobility - Moved within same county (%) - Black or African American
Geographical mobility - Moved within same county (%) - Asian
Geographical mobility - Moved within same county (%) - Hispanic or Latino
Geographical mobility - Moved within same county (%) - American Indian and Alaska Native
Geographical mobility - Moved within same county (%) - Multirace
Geographical mobility - Moved within same county (%) - Other Race
Geographical mobility - Moved from different county within same state (%)
Geographical mobility - Moved from different county within same state (%) - White
Geographical mobility - Moved from different county within same state (%) - Black or African American
Geographical mobility - Moved from different county within same state (%) - Asian
Geographical mobility - Moved from different county within same state (%) - Hispanic or Latino
Geographical mobility - Moved from different county within same state (%) - American Indian and Alaska Native
Geographical mobility - Moved from different county within same state (%) - Multirace
Geographical mobility - Moved from different county within same state (%) - Other Race
Geographical mobility - Moved from different state (%)
Geographical mobility - Moved from different state (%) - White
Geographical mobility - Moved from different state (%) - Black or African American
Geographical mobility - Moved from different state (%) - Asian
Geographical mobility - Moved from different state (%) - Hispanic or Latino
Geographical mobility - Moved from different state (%) - American Indian and Alaska Native
Geographical mobility - Moved from different state (%) - Multirace
Geographical mobility - Moved from different state (%) - Other Race
Geographical mobility - Moved from abroad (%)
Geographical mobility - Moved from abroad (%) - White
Geographical mobility - Moved from abroad (%) - Black or African American
Geographical mobility - Moved from abroad (%) - Asian
Geographical mobility - Moved from abroad (%) - Hispanic or Latino
Geographical mobility - Moved from abroad (%) - American Indian and Alaska Native
Geographical mobility - Moved from abroad (%) - Multirace
Geographical mobility - Moved from abroad (%) - Other Race
Place of birth for the foreign-born population - Ireland (%)
Place of birth for the foreign-born population - Denmark (%)
Place of birth for the foreign-born population - Norway (%)
Place of birth for the foreign-born population - Sweden (%)
Place of birth for the foreign-born population - United Kingdom (%)
Place of birth for the foreign-born population - England (%)
Place of birth for the foreign-born population - Scotland (%)
Place of birth for the foreign-born population - Other Northern Europe (%)
Place of birth for the foreign-born population - Austria (%)
Place of birth for the foreign-born population - Belgium (%)
Place of birth for the foreign-born population - France (%)
Place of birth for the foreign-born population - Germany (%)
Place of birth for the foreign-born population - Netherlands (%)
Place of birth for the foreign-born population - Switzerland (%)
Place of birth for the foreign-born population - Other Western Europe (%)
Place of birth for the foreign-born population - Greece (%)
Place of birth for the foreign-born population - Italy (%)
Place of birth for the foreign-born population - Portugal (%)
Place of birth for the foreign-born population - Spain (%)
Place of birth for the foreign-born population - Other Southern Europe (%)
Place of birth for the foreign-born population - Albania (%)
Place of birth for the foreign-born population - Belarus (%)
Place of birth for the foreign-born population - Bosnia and Herzegovina (%)
Place of birth for the foreign-born population - Bulgaria (%)
Place of birth for the foreign-born population - Croatia (%)
Place of birth for the foreign-born population - Czechoslovakia (%)
Place of birth for the foreign-born population - Hungary (%)
Place of birth for the foreign-born population - Latvia (%)
Place of birth for the foreign-born population - Lithuania (%)
Place of birth for the foreign-born population - North Macedonia (Macedonia) (%)
Place of birth for the foreign-born population - Moldova (%)
Place of birth for the foreign-born population - Poland (%)
Place of birth for the foreign-born population - Romania (%)
Place of birth for the foreign-born population - Russia (%)
Place of birth for the foreign-born population - Serbia (%)
Place of birth for the foreign-born population - Ukraine (%)
Place of birth for the foreign-born population - Other Eastern Europe (%)
Place of birth for the foreign-born population - China (%)
Place of birth for the foreign-born population - Hong Kong (%)
Place of birth for the foreign-born population - Taiwan (%)
Place of birth for the foreign-born population - Japan (%)
Place of birth for the foreign-born population - Korea (%)
Place of birth for the foreign-born population - Other Eastern Asia (%)
Place of birth for the foreign-born population - Afghanistan (%)
Place of birth for the foreign-born population - Bangladesh (%)
Place of birth for the foreign-born population - India (%)
Place of birth for the foreign-born population - Iran (%)
Place of birth for the foreign-born population - Kazakhstan (%)
Place of birth for the foreign-born population - Nepal (%)
Place of birth for the foreign-born population - Pakistan (%)
Place of birth for the foreign-born population - Sri Lanka (%)
Place of birth for the foreign-born population - Uzbekistan (%)
Place of birth for the foreign-born population - Other South Central Asia (%)
Place of birth for the foreign-born population - Burma (%)
Place of birth for the foreign-born population - Cambodia (%)
Place of birth for the foreign-born population - Indonesia (%)
Place of birth for the foreign-born population - Laos (%)
Place of birth for the foreign-born population - Malaysia (%)
Place of birth for the foreign-born population - Philippines (%)
Place of birth for the foreign-born population - Singapore (%)
Place of birth for the foreign-born population - Thailand (%)
Place of birth for the foreign-born population - Vietnam (%)
Place of birth for the foreign-born population - Other South Eastern Asia (%)
Place of birth for the foreign-born population - Armenia (%)
Place of birth for the foreign-born population - Iraq (%)
Place of birth for the foreign-born population - Israel (%)
Place of birth for the foreign-born population - Jordan (%)
Place of birth for the foreign-born population - Kuwait (%)
Place of birth for the foreign-born population - Lebanon (%)
Place of birth for the foreign-born population - Saudi Arabia (%)
Place of birth for the foreign-born population - Syria (%)
Place of birth for the foreign-born population - Turkey (%)
Place of birth for the foreign-born population - Yemen (%)
Place of birth for the foreign-born population - Other Western Asia (%)
Place of birth for the foreign-born population - Eritrea (%)
Place of birth for the foreign-born population - Ethiopia (%)
Place of birth for the foreign-born population - Kenya (%)
Place of birth for the foreign-born population - Somalia (%)
Place of birth for the foreign-born population - Uganda (%)
Place of birth for the foreign-born population - Zimbabwe (%)
Place of birth for the foreign-born population - Other Eastern Africa (%)
Place of birth for the foreign-born population - Cameroon (%)
Place of birth for the foreign-born population - Congo (%)
Place of birth for the foreign-born population - Democratic Republic of Congo (Zaire) (%)
Place of birth for the foreign-born population - Other Middle Africa (%)
Place of birth for the foreign-born population - Egypt (%)
Place of birth for the foreign-born population - Morocco (%)
Place of birth for the foreign-born population - Sudan (%)
Place of birth for the foreign-born population - Other Northern Africa (%)
Place of birth for the foreign-born population - South Africa (%)
Place of birth for the foreign-born population - Other Southern Africa (%)
Place of birth for the foreign-born population - Cabo Verde (%)
Place of birth for the foreign-born population - Ghana (%)
Place of birth for the foreign-born population - Liberia (%)
Place of birth for the foreign-born population - Nigeria (%)
Place of birth for the foreign-born population - Senegal (%)
Place of birth for the foreign-born population - Sierra Leone (%)
Place of birth for the foreign-born population - Other Western Africa (%)
Place of birth for the foreign-born population - Australia (%)
Place of birth for the foreign-born population - New Zealand (%)
Place of birth for the foreign-born population - Fiji (%)
Place of birth for the foreign-born population - Micronesia (%)
Place of birth for the foreign-born population - Bahamas (%)
Place of birth for the foreign-born population - Barbados (%)
Place of birth for the foreign-born population - Cuba (%)
Place of birth for the foreign-born population - Dominica (%)
Place of birth for the foreign-born population - Dominican Republic (%)
Place of birth for the foreign-born population - Grenada (%)
Place of birth for the foreign-born population - Haiti (%)
Place of birth for the foreign-born population - Jamaica (%)
Place of birth for the foreign-born population - St. Vincent and the Grenadines (%)
Place of birth for the foreign-born population - Trinidad and Tobago (%)
Place of birth for the foreign-born population - West Indies (%)
Place of birth for the foreign-born population - Other Caribbean (%)
Place of birth for the foreign-born population - Belize (%)
Place of birth for the foreign-born population - Costa Rica (%)
Place of birth for the foreign-born population - El Salvador (%)
Place of birth for the foreign-born population - Guatemala (%)
Place of birth for the foreign-born population - Honduras (%)
Place of birth for the foreign-born population - Mexico (%)
Place of birth for the foreign-born population - Nicaragua (%)
Place of birth for the foreign-born population - Panama (%)
Place of birth for the foreign-born population - Other Central America (%)
Place of birth for the foreign-born population - Argentina (%)
Place of birth for the foreign-born population - Bolivia (%)
Place of birth for the foreign-born population - Brazil (%)
Place of birth for the foreign-born population - Chile (%)
Place of birth for the foreign-born population - Colombia (%)
Place of birth for the foreign-born population - Ecuador (%)
Place of birth for the foreign-born population - Guyana (%)
Place of birth for the foreign-born population - Peru (%)
Place of birth for the foreign-born population - Uruguay (%)
Place of birth for the foreign-born population - Venezuela (%)
Place of birth for the foreign-born population - Other South America (%)
Place of birth for the foreign-born population - Canada (%)
Place of birth for the foreign-born population - Other Northern America (%)
Place of birth for the foreign-born population - Other (%)
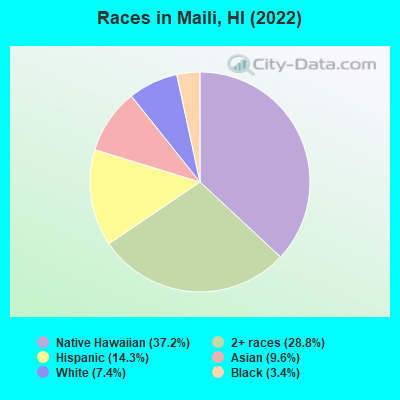
According to 2022 data, the most numerous races in Maili, HI are Asian alone (1,143 residents), Two or more races (3,438 residents), and White alone (885 residents). 87.0% of Maili residents speak English at home. 5.7% of Maili, HI residents are foreign-born (3.0% born in Asia, 1.8% born in Oceania), which is 213.3% less than the foreign-born rate of 18.0% across the entire state of Hawaii.
Race distribution in Maili
2000 2022
494,149 40.8% Asian alone 277,091 22.9% White alone 218,700 18.1% Two or more races 108,441 9.0% Native Hawaiian and Other 87,699 7.2% Hispanic 20,829 1.7% Black alone 2,089 0.2% Other race alone 2,539 0.2% American Indian alone
498,125 34.6% Asian alone 318,574 22.1% Two or more races 297,937 20.7% White alone 160,103 11.1% Hispanic 134,567 9.3% Native Hawaiian and Other 23,682 1.6% Black alone 5,378 0.4% Other race alone 1,830 0.1% American Indian alone
Income and house value in Maili Median household income in 2022 $123,770 White non-Hispanic householders$38,138 Black householders$77,101 Asian householders$102,781 Native Hawaiian and other Pacific Islander householders$168,137 Some other race householders$82,000 Two or more races householders$110,218 Hispanic or Latino race householdersMedian 2022 house value $596,980 White Non-Hispanic householders$835,327 Black or African American householders $635,962 Asian householders$677,914 Native Hawaiian and other Pacific Islander householdersover $1,000,000 Some other race householders$611,459 Two or more races householdersover $1,000,000 Hispanic or Latino householders
Median age by race in Maili
35.9 Median age for White residents42.9 33.6 8.3 Median age for Black or African American residents-714,912,280.0 8.3 -693,430,656.2 Median age for American Indian / Alaska Native residents-715,953,306.7 -629,508,196.1 55.4 Median age for Asian residents62.9 46.5 27.2 Median age for Native Hawaiian / Pacific Islander residents24.1 28.5 37.1 Median age for Other race residents37.6 45.3 24.2 Median age for Two or more races residents24.3 23.5 36.3 Median age for White alone residents43.6 34.2 29.0 Median age for Hispanic or Latino residents31.4 28.9
Owner/renter occupied households by race in Maili
House owners and renters - White residents 358 100.0% Owner occupiedHouse owners and renters - Black or African American residents 138 92.4% Owner occupied11 7.6% Renter occupiedHouse owners and renters - Asian residents 387 80.8% Owner occupied92 19.2% Renter occupiedHouse owners and renters - Native Hawaiian / Pacific Islander residents 388 33.9% Owner occupied757 66.1% Renter occupiedHouse owners and renters - Other race residents 77 100.0% Owner occupiedHouse owners and renters - Two or more races residents 750 81.7% Owner occupied168 18.3% Renter occupiedHouse owners and renters - White alone residents 357 100.0% Owner occupiedHouse owners and renters - Hispanic or Latino residents 211 75.1% Owner occupied70 24.9% Renter occupied
Language usage in Maili
English speakers - Total 87.0% of residents of Maili speak English at home.
1.0% of residents speak Spanish at home 103 100.0% Speak English very well12.7% of residents speak other language at home 1,196 87.4% Speak English very well173 12.6% Speak English less than very well
English speakers - Born in the United States 95.5% of residents of Maili speak English at home.
3.5% of residents speak Spanish at home 59 100.0% Speak English very well1.5% of residents speak other language at home 25 96.2% Speak English very well1 3.8% Speak English less than very well
English speakers - Native, born elsewhere 7.9% of residents of Maili speak English at home.
79.9% of residents speak other language at home 278 98.2% Speak English very well5 1.8% Speak English less than very well
English speakers - Foreign-born 25.1% of residents of Maili speak English at home.
6.0% of residents speak Spanish at home 39 100.0% Speak English very well67.4% of residents speak other language at home 320 73.6% Speak English very well115 26.4% Speak English less than very well
White (Caucasian) - Speak only English Native:
93.8% (676)Foreign-born:
36.7% (16)
White (Caucasian) - Speak another language Native:
6.0% (43)Foreign-born:
60.7% (27)
Black or African American - Speak only English Native:
97.9% (420)Foreign-born:
100.0% (5)
Asian - Speak only English Native:
85.2% (784)Foreign-born:
32.6% (106)
Asian - Speak another language Native:
14.7% (136)Foreign-born:
67.2% (219)
Native Hawaiian / Pacific Islander - Speak only English Native:
85.4% (3,582)Foreign-born:
7.5% (16)
Native Hawaiian / Pacific Islander - Speak another language Native:
15.0% (631)Foreign-born:
92.7% (201)
Two or more races - Speak only English Native:
97.2% (3,363)Foreign-born:
26.0% (13)
Two or more races - Speak another language Native:
2.6% (91)Foreign-born:
73.8% (37)
White alone - Speak only English Native:
95.5% (660)Foreign-born:
34.3% (17)
White alone - Speak another language Native:
4.5% (31)Foreign-born:
65.5% (32)
Hispanic or Latino - Speak another language Native:
2.5% (36)Foreign-born:
95.6% (55)
Foreign-born residents in Maili 686 residents are foreign born (3.0% Asia , 1.8% Oceania ).
This city:
5.7%Hawaii:
18.0%
Marital status for residents in Maili Marital status - White (Caucasian) population 15 years and over
Males 20.7% Never married70.7% Now married0.0% Separated0.0% Widowed8.6% DivorcedFemales 4.9% Never married72.0% Now married0.0% Separated6.6% Widowed16.5% DivorcedWomen who gave birth in the past 12 months Now married:
100.0% (32)Unmarried:
0.0% (0)
Women who did not give birth in the past 12 months Now married:
79.3% (129)Unmarried:
20.7% (34)
Marital status - Black or African American population 15 years and over
Males 0.0% Never married100.0% Now married0.0% Separated0.0% Widowed0.0% DivorcedFemales 34.4% Never married0.0% Now married50.5% Separated0.0% Widowed15.1% DivorcedWomen who did not give birth in the past 12 months Now married:
69.1% (90)Unmarried:
30.9% (40)
Marital status - Asian population 15 years and over
Males 13.1% Never married74.2% Now married0.0% Separated5.6% Widowed7.1% DivorcedFemales 24.2% Never married38.3% Now married6.2% Separated9.9% Widowed21.4% DivorcedWomen who gave birth in the past 12 months Now married:
100.0% (63)Unmarried:
0.0% (0)
Women who did not give birth in the past 12 months Now married:
35.9% (105)Unmarried:
64.1% (186)
Marital status - Native Hawaiian / Pacific Islander population 15 years and over
Males 37.5% Never married51.8% Now married1.1% Separated3.1% Widowed6.5% DivorcedFemales 39.2% Never married49.9% Now married2.7% Separated3.9% Widowed4.2% DivorcedWomen who gave birth in the past 12 months Now married:
35.8% (84)Unmarried:
64.2% (151)
Women who did not give birth in the past 12 months Now married:
49.8% (542)Unmarried:
50.2% (546)
Marital status - Other race population 15 years and over
Males 10.2% Never married89.8% Now married0.0% Separated0.0% Widowed0.0% DivorcedFemales 28.8% Never married71.2% Now married0.0% Separated0.0% Widowed0.0% DivorcedWomen who did not give birth in the past 12 months Now married:
44.1% (19)Unmarried:
55.9% (24)
Marital status - Two or more races population 15 years and over
Males 55.2% Never married36.3% Now married0.0% Separated4.9% Widowed3.6% DivorcedFemales 29.0% Never married44.6% Now married1.8% Separated11.1% Widowed13.5% DivorcedWomen who gave birth in the past 12 months Now married:
100.0% (64)Unmarried:
0.0% (0)
Women who did not give birth in the past 12 months Now married:
45.1% (371)Unmarried:
54.9% (451)
Marital status - White alone, not Hispanic / Latino population 15 years and over
Males 20.1% Never married71.0% Now married0.0% Separated0.0% Widowed9.0% DivorcedFemales 5.1% Never married71.0% Now married0.0% Separated6.9% Widowed17.0% DivorcedWomen who gave birth in the past 12 months Now married:
100.0% (33)Unmarried:
0.0% (0)
Women who did not give birth in the past 12 months Now married:
77.9% (122)Unmarried:
22.1% (35)
Marital status - Hispanic or Latino population 15 years and over
Males 33.9% Never married64.8% Now married0.0% Separated0.0% Widowed1.3% DivorcedFemales 48.4% Never married43.9% Now married0.0% Separated7.7% Widowed0.0% DivorcedWomen who gave birth in the past 12 months Now married:
42.7% (41)Unmarried:
57.3% (55)
Women who did not give birth in the past 12 months Now married:
40.6% (164)Unmarried:
59.4% (241)
Ancestries in Maili
128 2.9% Irish63 1.4% German41 0.9% Dutch38 0.9% Swedish29 0.7% Finnish19 0.4% American19 0.4% Belizean17 0.4% Portuguese16 0.4% African15 0.3% English15 0.3% Italian14 0.3% French Canadian8 0.2% British West Indian
Children Nativity (place of birth) in Maili
Children under 6 years - Living with two parents Both parents native 499 100.0% NativeOne native, one foreign-born parent 45 100.0% NativeChildren under 6 years - Living with one parent Native parent 495 100.0% NativeChildren 6 to 17 years - Living with two parents Both parents native 1,124 100.0% NativeOne native, one foreign-born parent 91 100.0% NativeChildren 6 to 17 years - Living with one parent Native parent 1,187 100.0% NativeForeign-born parent 53 45.6% Native63 54.4% Foreign-born
Grandparents responsible for own grandchildren in Maili
Grandparents (30 to 59 years) Asian 9 100.0% Responsible for grandchildrenNative Hawaiian / Pacific Islander 91 100.0% Responsible for grandchildrenTwo or more races 23 51.6% Responsible for grandchildren21 48.4% Not responsible for grandchildrenHispanic or Latino 29 100.0% Responsible for grandchildrenGrandparents (60 years and over) Native Hawaiian / Pacific Islander 35 12.9% Responsible for grandchildren235 87.1% Not responsible for grandchildrenTwo or more races 30 100.0% Not responsible for grandchildren