Races in Malaga, Washington (WA) Detailed Stats
Ancestries, Foreign-born residents, place of birth
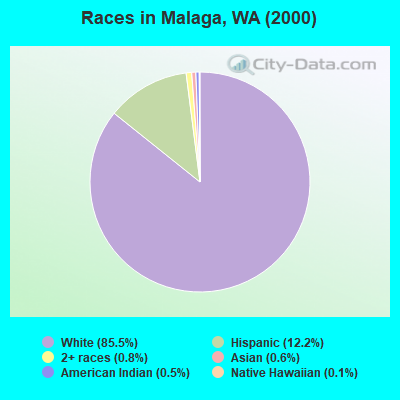
Race distribution in Malaga

- 2,99785.5%White alone
- 42912.2%Hispanic
- 280.8%Two or more races
- 220.6%Asian alone
- 190.5%American Indian alone
- 50.1%Native Hawaiian and Other
Pacific Islander alone - 30.09%Black alone
- 30.09%Other race alone
2000
2022
-
- 4,652,49078.9%White alone
- 441,5097.5%Hispanic
- 319,4015.4%Asian alone
- 184,6313.1%Black alone
- 175,9263.0%Two or more races
- 85,3961.4%American Indian alone
- 22,7790.4%Native Hawaiian and Other
Pacific Islander alone - 11,9890.2%Other race alone

-
- 4,941,45663.5%White alone
- 1,093,31314.0%Hispanic
- 755,8329.7%Asian alone
- 523,4486.7%Two or more races
- 299,5373.8%Black alone
- 69,0240.9%American Indian alone
- 52,2310.7%Native Hawaiian and Other
Pacific Islander alone - 50,9450.7%Other race alone

Income and house value in Malaga
- Median household income in 2022
- $114,193White non-Hispanic householders
- $160,212Some other race householders
- $54,937Two or more races householders
- $143,153Hispanic or Latino race householders
- Median 2022 house value
- $624,636White Non-Hispanic householders
- $520,186Some other race householders
- $644,220Two or more races householders
- $392,716Hispanic or Latino householders
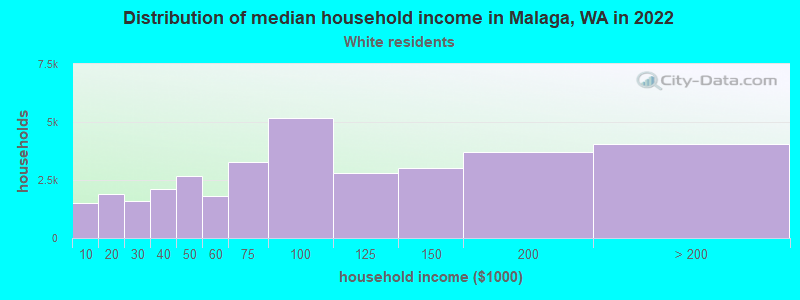
Household income for White non-Hispanic householders
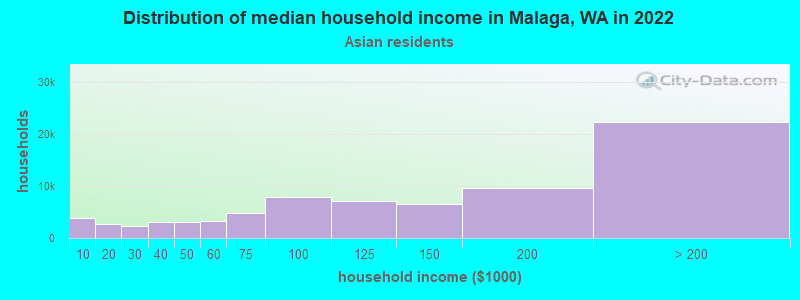
Household income for Asian householders
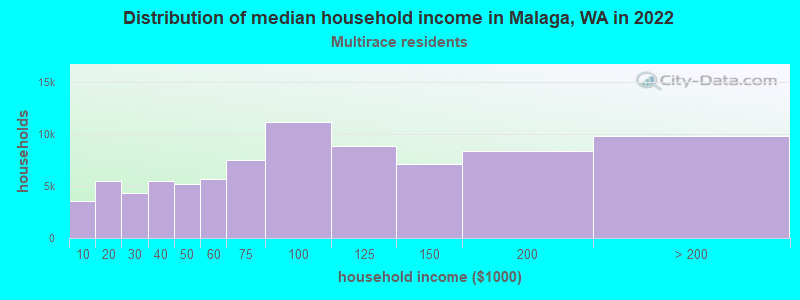
Household income for Two or more races householders
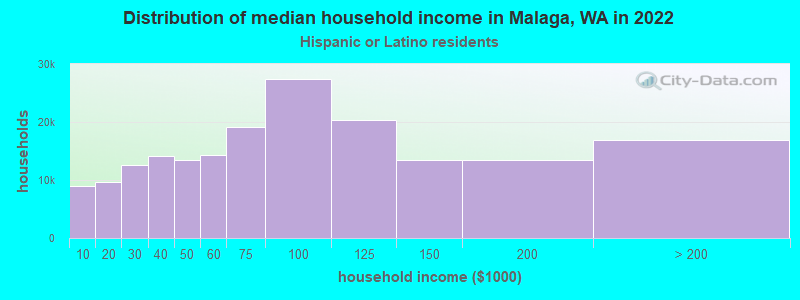
Household income for Hispanic or Latino race householders
Zip code: 98801