Races in Manitowoc, Wisconsin (WI) Detailed Stats
Data:
Races - White alone (%)
Races - White alone (% change since 2000)
Races - Black alone (%)
Races - Black alone (% change since 2000)
Races - American Indian alone (%)
Races - American Indian alone (% change since 2000)
Races - Asian alone (%)
Races - Asian alone (% change since 2000)
Races - Hispanic (%)
Races - Hispanic (% change since 2000)
Races - Native Hawaiian and Other Pacific Islander alone (%)
Races - Native Hawaiian and Other Pacific Islander alone (% change since 2000)
Races - Two or more races(%)
Races - Two or more races(% change since 2000)
Races - Other race alone (%)
Races - Other race alone (% change since 2000)
Racial diversity
Place of birth - Born in state of residence (%)
Place of birth - Born in state of residence (%) - White
Place of birth - Born in state of residence (%) - Black or African American
Place of birth - Born in state of residence (%) - Asian
Place of birth - Born in state of residence (%) - Hispanic or Latino
Place of birth - Born in state of residence (%) - American Indian and Alaska Native
Place of birth - Born in state of residence (%) - Multirace
Place of birth - Born in state of residence (%) - Other Race
Place of birth - Born in other state (%)
Place of birth - Born in other state (%) - White
Place of birth - Born in other state (%) - Black or African American
Place of birth - Born in other state (%) - Asian
Place of birth - Born in other state (%) - Hispanic or Latino
Place of birth - Born in other state (%) - American Indian and Alaska Native
Place of birth - Born in other state (%) - Multirace
Place of birth - Born in other state (%) - Other Race
Place of birth - Native, outside of US (%)
Place of birth - Native, outside of US (%) - White
Place of birth - Native, outside of US (%) - Black or African American
Place of birth - Native, outside of US (%) - Asian
Place of birth - Native, outside of US (%) - Hispanic or Latino
Place of birth - Native, outside of US (%) - American Indian and Alaska Native
Place of birth - Native, outside of US (%) - Multirace
Place of birth - Native, outside of US (%) - Other Race
Place of birth - Foreign born (%)
Place of birth - Foreign born (%) - White
Place of birth - Foreign born (%) - Black or African American
Place of birth - Foreign born (%) - Asian
Place of birth - Foreign born (%) - Hispanic or Latino
Place of birth - Foreign born (%) - American Indian and Alaska Native
Place of birth - Foreign born (%) - Multirace
Place of birth - Foreign born (%) - Other Race
Residents speaking English at home (%)
Residents speaking English at home - Born in the United States (%)
Residents speaking English at home - Native, born elsewhere (%)
Residents speaking English at home - Foreign born (%)
Residents speaking Spanish at home (%)
Residents speaking Spanish at home - Born in the United States (%)
Residents speaking Spanish at home - Native, born elsewhere (%)
Residents speaking Spanish at home - Foreign born (%)
Residents speaking other language at home (%)
Residents speaking other language at home - Born in the United States (%)
Residents speaking other language at home - Native, born elsewhere (%)
Residents speaking other language at home - Foreign born (%)
Marital status - Never married (%)
Marital status - Now married (%)
Marital status - Separated (%)
Marital status - Widowed (%)
Marital status - Divorced (%)
Ancestries Reported - Arab (%)
Ancestries Reported - Czech (%)
Ancestries Reported - Danish (%)
Ancestries Reported - Dutch (%)
Ancestries Reported - English (%)
Ancestries Reported - French (%)
Ancestries Reported - French Canadian (%)
Ancestries Reported - German (%)
Ancestries Reported - Greek (%)
Ancestries Reported - Hungarian (%)
Ancestries Reported - Irish (%)
Ancestries Reported - Italian (%)
Ancestries Reported - Lithuanian (%)
Ancestries Reported - Norwegian (%)
Ancestries Reported - Polish (%)
Ancestries Reported - Portuguese (%)
Ancestries Reported - Russian (%)
Ancestries Reported - Scotch-Irish (%)
Ancestries Reported - Scottish (%)
Ancestries Reported - Slovak (%)
Ancestries Reported - Subsaharan African (%)
Ancestries Reported - Swedish (%)
Ancestries Reported - Swiss (%)
Ancestries Reported - Ukrainian (%)
Ancestries Reported - United States (%)
Ancestries Reported - Welsh (%)
Ancestries Reported - West Indian (%)
Ancestries Reported - Other (%)
Geographical mobility - Same house 1 year ago (%)
Geographical mobility - Same house 1 year ago (%) - White
Geographical mobility - Same house 1 year ago (%) - Black or African American
Geographical mobility - Same house 1 year ago (%) - Asian
Geographical mobility - Same house 1 year ago (%) - Hispanic or Latino
Geographical mobility - Same house 1 year ago (%) - American Indian and Alaska Native
Geographical mobility - Same house 1 year ago (%) - Multirace
Geographical mobility - Same house 1 year ago (%) - Other Race
Geographical mobility - Moved within same county (%)
Geographical mobility - Moved within same county (%) - White
Geographical mobility - Moved within same county (%) - Black or African American
Geographical mobility - Moved within same county (%) - Asian
Geographical mobility - Moved within same county (%) - Hispanic or Latino
Geographical mobility - Moved within same county (%) - American Indian and Alaska Native
Geographical mobility - Moved within same county (%) - Multirace
Geographical mobility - Moved within same county (%) - Other Race
Geographical mobility - Moved from different county within same state (%)
Geographical mobility - Moved from different county within same state (%) - White
Geographical mobility - Moved from different county within same state (%) - Black or African American
Geographical mobility - Moved from different county within same state (%) - Asian
Geographical mobility - Moved from different county within same state (%) - Hispanic or Latino
Geographical mobility - Moved from different county within same state (%) - American Indian and Alaska Native
Geographical mobility - Moved from different county within same state (%) - Multirace
Geographical mobility - Moved from different county within same state (%) - Other Race
Geographical mobility - Moved from different state (%)
Geographical mobility - Moved from different state (%) - White
Geographical mobility - Moved from different state (%) - Black or African American
Geographical mobility - Moved from different state (%) - Asian
Geographical mobility - Moved from different state (%) - Hispanic or Latino
Geographical mobility - Moved from different state (%) - American Indian and Alaska Native
Geographical mobility - Moved from different state (%) - Multirace
Geographical mobility - Moved from different state (%) - Other Race
Geographical mobility - Moved from abroad (%)
Geographical mobility - Moved from abroad (%) - White
Geographical mobility - Moved from abroad (%) - Black or African American
Geographical mobility - Moved from abroad (%) - Asian
Geographical mobility - Moved from abroad (%) - Hispanic or Latino
Geographical mobility - Moved from abroad (%) - American Indian and Alaska Native
Geographical mobility - Moved from abroad (%) - Multirace
Geographical mobility - Moved from abroad (%) - Other Race
Place of birth for the foreign-born population - Ireland (%)
Place of birth for the foreign-born population - Denmark (%)
Place of birth for the foreign-born population - Norway (%)
Place of birth for the foreign-born population - Sweden (%)
Place of birth for the foreign-born population - United Kingdom (%)
Place of birth for the foreign-born population - England (%)
Place of birth for the foreign-born population - Scotland (%)
Place of birth for the foreign-born population - Other Northern Europe (%)
Place of birth for the foreign-born population - Austria (%)
Place of birth for the foreign-born population - Belgium (%)
Place of birth for the foreign-born population - France (%)
Place of birth for the foreign-born population - Germany (%)
Place of birth for the foreign-born population - Netherlands (%)
Place of birth for the foreign-born population - Switzerland (%)
Place of birth for the foreign-born population - Other Western Europe (%)
Place of birth for the foreign-born population - Greece (%)
Place of birth for the foreign-born population - Italy (%)
Place of birth for the foreign-born population - Portugal (%)
Place of birth for the foreign-born population - Spain (%)
Place of birth for the foreign-born population - Other Southern Europe (%)
Place of birth for the foreign-born population - Albania (%)
Place of birth for the foreign-born population - Belarus (%)
Place of birth for the foreign-born population - Bosnia and Herzegovina (%)
Place of birth for the foreign-born population - Bulgaria (%)
Place of birth for the foreign-born population - Croatia (%)
Place of birth for the foreign-born population - Czechoslovakia (%)
Place of birth for the foreign-born population - Hungary (%)
Place of birth for the foreign-born population - Latvia (%)
Place of birth for the foreign-born population - Lithuania (%)
Place of birth for the foreign-born population - North Macedonia (Macedonia) (%)
Place of birth for the foreign-born population - Moldova (%)
Place of birth for the foreign-born population - Poland (%)
Place of birth for the foreign-born population - Romania (%)
Place of birth for the foreign-born population - Russia (%)
Place of birth for the foreign-born population - Serbia (%)
Place of birth for the foreign-born population - Ukraine (%)
Place of birth for the foreign-born population - Other Eastern Europe (%)
Place of birth for the foreign-born population - China (%)
Place of birth for the foreign-born population - Hong Kong (%)
Place of birth for the foreign-born population - Taiwan (%)
Place of birth for the foreign-born population - Japan (%)
Place of birth for the foreign-born population - Korea (%)
Place of birth for the foreign-born population - Other Eastern Asia (%)
Place of birth for the foreign-born population - Afghanistan (%)
Place of birth for the foreign-born population - Bangladesh (%)
Place of birth for the foreign-born population - India (%)
Place of birth for the foreign-born population - Iran (%)
Place of birth for the foreign-born population - Kazakhstan (%)
Place of birth for the foreign-born population - Nepal (%)
Place of birth for the foreign-born population - Pakistan (%)
Place of birth for the foreign-born population - Sri Lanka (%)
Place of birth for the foreign-born population - Uzbekistan (%)
Place of birth for the foreign-born population - Other South Central Asia (%)
Place of birth for the foreign-born population - Burma (%)
Place of birth for the foreign-born population - Cambodia (%)
Place of birth for the foreign-born population - Indonesia (%)
Place of birth for the foreign-born population - Laos (%)
Place of birth for the foreign-born population - Malaysia (%)
Place of birth for the foreign-born population - Philippines (%)
Place of birth for the foreign-born population - Singapore (%)
Place of birth for the foreign-born population - Thailand (%)
Place of birth for the foreign-born population - Vietnam (%)
Place of birth for the foreign-born population - Other South Eastern Asia (%)
Place of birth for the foreign-born population - Armenia (%)
Place of birth for the foreign-born population - Iraq (%)
Place of birth for the foreign-born population - Israel (%)
Place of birth for the foreign-born population - Jordan (%)
Place of birth for the foreign-born population - Kuwait (%)
Place of birth for the foreign-born population - Lebanon (%)
Place of birth for the foreign-born population - Saudi Arabia (%)
Place of birth for the foreign-born population - Syria (%)
Place of birth for the foreign-born population - Turkey (%)
Place of birth for the foreign-born population - Yemen (%)
Place of birth for the foreign-born population - Other Western Asia (%)
Place of birth for the foreign-born population - Eritrea (%)
Place of birth for the foreign-born population - Ethiopia (%)
Place of birth for the foreign-born population - Kenya (%)
Place of birth for the foreign-born population - Somalia (%)
Place of birth for the foreign-born population - Uganda (%)
Place of birth for the foreign-born population - Zimbabwe (%)
Place of birth for the foreign-born population - Other Eastern Africa (%)
Place of birth for the foreign-born population - Cameroon (%)
Place of birth for the foreign-born population - Congo (%)
Place of birth for the foreign-born population - Democratic Republic of Congo (Zaire) (%)
Place of birth for the foreign-born population - Other Middle Africa (%)
Place of birth for the foreign-born population - Egypt (%)
Place of birth for the foreign-born population - Morocco (%)
Place of birth for the foreign-born population - Sudan (%)
Place of birth for the foreign-born population - Other Northern Africa (%)
Place of birth for the foreign-born population - South Africa (%)
Place of birth for the foreign-born population - Other Southern Africa (%)
Place of birth for the foreign-born population - Cabo Verde (%)
Place of birth for the foreign-born population - Ghana (%)
Place of birth for the foreign-born population - Liberia (%)
Place of birth for the foreign-born population - Nigeria (%)
Place of birth for the foreign-born population - Senegal (%)
Place of birth for the foreign-born population - Sierra Leone (%)
Place of birth for the foreign-born population - Other Western Africa (%)
Place of birth for the foreign-born population - Australia (%)
Place of birth for the foreign-born population - New Zealand (%)
Place of birth for the foreign-born population - Fiji (%)
Place of birth for the foreign-born population - Micronesia (%)
Place of birth for the foreign-born population - Bahamas (%)
Place of birth for the foreign-born population - Barbados (%)
Place of birth for the foreign-born population - Cuba (%)
Place of birth for the foreign-born population - Dominica (%)
Place of birth for the foreign-born population - Dominican Republic (%)
Place of birth for the foreign-born population - Grenada (%)
Place of birth for the foreign-born population - Haiti (%)
Place of birth for the foreign-born population - Jamaica (%)
Place of birth for the foreign-born population - St. Vincent and the Grenadines (%)
Place of birth for the foreign-born population - Trinidad and Tobago (%)
Place of birth for the foreign-born population - West Indies (%)
Place of birth for the foreign-born population - Other Caribbean (%)
Place of birth for the foreign-born population - Belize (%)
Place of birth for the foreign-born population - Costa Rica (%)
Place of birth for the foreign-born population - El Salvador (%)
Place of birth for the foreign-born population - Guatemala (%)
Place of birth for the foreign-born population - Honduras (%)
Place of birth for the foreign-born population - Mexico (%)
Place of birth for the foreign-born population - Nicaragua (%)
Place of birth for the foreign-born population - Panama (%)
Place of birth for the foreign-born population - Other Central America (%)
Place of birth for the foreign-born population - Argentina (%)
Place of birth for the foreign-born population - Bolivia (%)
Place of birth for the foreign-born population - Brazil (%)
Place of birth for the foreign-born population - Chile (%)
Place of birth for the foreign-born population - Colombia (%)
Place of birth for the foreign-born population - Ecuador (%)
Place of birth for the foreign-born population - Guyana (%)
Place of birth for the foreign-born population - Peru (%)
Place of birth for the foreign-born population - Uruguay (%)
Place of birth for the foreign-born population - Venezuela (%)
Place of birth for the foreign-born population - Other South America (%)
Place of birth for the foreign-born population - Canada (%)
Place of birth for the foreign-born population - Other Northern America (%)
Place of birth for the foreign-born population - Other (%)
Latest news about races in Manitowoc, WI collected exclusively by city-data.com from local newspapers, TV, and radio stations
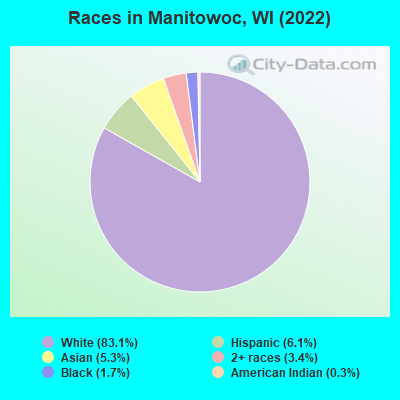
According to 2022 data, the most numerous races in Manitowoc, WI are White alone (28,721 residents), Hispanic (2,102 residents), and Black alone (586 residents). 90.8% of Manitowoc residents speak English at home. 4.6% of Manitowoc, WI residents are foreign-born (2.4% born in Asia, 1.6% born in Latin America, 0.5% born in Europe), which is 8.9% less than the foreign-born rate of 5.0% across the entire state of Wisconsin.
Race distribution in Manitowoc
2000 2022
4,681,630 87.3% White alone 300,245 5.6% Black alone 192,921 3.6% Hispanic 87,995 1.6% Asian alone 51,921 1.0% Two or more races 43,980 0.8% American Indian alone 3,637 0.07% Other race alone 1,346 0.03% Native Hawaiian and Other
4,654,031 79.0% White alone 447,022 7.6% Hispanic 345,678 5.9% Black alone 217,532 3.7% Two or more races 172,242 2.9% Asian alone 33,762 0.6% American Indian alone 19,680 0.3% Other race alone 2,592 0.04% Native Hawaiian and Other
Income and house value in Manitowoc Median household income in 2022 $55,878 White non-Hispanic householders$77,084 Asian householders$67,376 Some other race householders$46,916 Two or more races householders$80,314 Hispanic or Latino race householdersMedian 2022 house value $144,388 White Non-Hispanic householders$142,544 Black or African American householders$139,525 American Indian or Alaska Native householders $155,121 Asian householders$138,351 Some other race householders$160,488 Two or more races householders$97,433 Hispanic or Latino householders
Median age by race in Manitowoc
46.7 Median age for White residents44.0 49.8 49.6 Median age for Black or African American residents19.7 75.8 79.1 Median age for American Indian / Alaska Native residents51.5 -689,393,938.7 26.4 Median age for Asian residents18.8 35.3 -825,688,072.6 Median age for Native Hawaiian / Pacific Islander residents-862,745,097.2 -666,666,666.0 17.7 Median age for Other race residents8.7 18.0 33.9 Median age for Two or more races residents26.9 36.5 48.0 Median age for White alone residents45.5 51.1 20.5 Median age for Hispanic or Latino residents15.2 23.3
Owner/renter occupied households by race in Manitowoc
House owners and renters - White residents 8,743 65.0% Owner occupied4,709 35.0% Renter occupiedHouse owners and renters - Black or African American residents 11 8.0% Owner occupied128 92.0% Renter occupiedHouse owners and renters - American Indian / Alaska Native residents 19 100.0% Renter occupiedHouse owners and renters - Asian residents 386 63.7% Owner occupied220 36.3% Renter occupiedHouse owners and renters - Other race residents 90 94.7% Owner occupied5 5.3% Renter occupiedHouse owners and renters - Two or more races residents 470 49.1% Owner occupied487 50.9% Renter occupiedHouse owners and renters - White alone residents 8,675 65.0% Owner occupied4,667 35.0% Renter occupiedHouse owners and renters - Hispanic or Latino residents 371 71.0% Owner occupied152 29.0% Renter occupied
Language usage in Manitowoc
English speakers - Total 90.8% of residents of Manitowoc speak English at home.
4.4% of residents speak Spanish at home 1,111 76.7% Speak English very well338 23.3% Speak English less than very well5.3% of residents speak other language at home 921 52.6% Speak English very well830 47.4% Speak English less than very well
English speakers - Born in the United States 97.8% of residents of Manitowoc speak English at home.
1.9% of residents speak Spanish at home 96 93.2% Speak English very well7 6.8% Speak English less than very well2.5% of residents speak other language at home 95 68.3% Speak English very well44 31.7% Speak English less than very well
English speakers - Native, born elsewhere 40.8% of residents of Manitowoc speak English at home.
16.5% of residents speak Spanish at home 17 100.0% Speak English very well7.8% of residents speak other language at home 8 100.0% Speak English very well
English speakers - Foreign-born 11.3% of residents of Manitowoc speak English at home.
43.4% of residents speak Spanish at home 540 63.1% Speak English very well316 36.9% Speak English less than very well45.8% of residents speak other language at home 290 32.0% Speak English very well615 68.0% Speak English less than very well
White (Caucasian) - Speak only English Native:
98.4% (27,518)Foreign-born:
17.5% (34)
White (Caucasian) - Speak another language Native:
1.4% (405)Foreign-born:
88.3% (173)
Black or African American - Speak another language Native:
2.7% (14)Foreign-born:
100.0% (22)
Asian - Speak only English Native:
38.1% (469)Foreign-born:
11.2% (105)
Asian - Speak another language Native:
62.0% (764)Foreign-born:
86.0% (802)
Other race - Speak only English Native:
36.0% (54)Foreign-born:
27.4% (52)
Other race - Speak another language Native:
53.5% (80)Foreign-born:
74.8% (142)
Two or more races - Speak only English Native:
83.7% (1,283)Foreign-born:
1.9% (7)
Two or more races - Speak another language Native:
15.3% (235)Foreign-born:
100.0% (367)
White alone - Speak only English Native:
98.9% (27,047)Foreign-born:
16.5% (38)
White alone - Speak another language Native:
1.1% (293)Foreign-born:
52.0% (121)
Hispanic or Latino - Speak only English Native:
54.4% (655)Foreign-born:
7.6% (59)
Hispanic or Latino - Speak another language Native:
45.8% (552)Foreign-born:
95.9% (746)
Foreign-born residents in Manitowoc 1,583 residents are foreign born (2.4% Asia , 1.6% Latin America , 0.5% Europe ).
This city:
4.6%Wisconsin:
5.0%
Marital status for residents in Manitowoc Marital status - White (Caucasian) population 15 years and over
Males 37.7% Never married45.4% Now married0.8% Separated3.7% Widowed12.3% DivorcedFemales 25.7% Never married46.0% Now married1.2% Separated12.1% Widowed15.1% DivorcedWomen who gave birth in the past 12 months Now married:
61.5% (208)Unmarried:
38.5% (130)
Women who did not give birth in the past 12 months Now married:
37.4% (1,886)Unmarried:
62.6% (3,164)
Marital status - Black or African American population 15 years and over
Males 70.6% Never married14.0% Now married0.0% Separated0.0% Widowed15.4% DivorcedFemales 52.2% Never married31.7% Now married12.2% Separated0.0% Widowed3.9% DivorcedWomen who did not give birth in the past 12 months Now married:
30.2% (34)Unmarried:
69.8% (78)
Marital status - American Indian / Alaska Native population 15 years and over
Males 18.2% Never married56.8% Now married0.0% Separated0.0% Widowed25.0% DivorcedFemales 100.0% Never married0.0% Now married0.0% Separated0.0% Widowed0.0% DivorcedWomen who did not give birth in the past 12 months Now married:
0.0% (0)Unmarried:
100.0% (25)
Marital status - Asian population 15 years and over
Males 56.5% Never married33.3% Now married0.0% Separated0.0% Widowed10.2% DivorcedFemales 46.7% Never married22.5% Now married4.2% Separated0.1% Widowed26.5% DivorcedWomen who gave birth in the past 12 months Now married:
46.8% (22)Unmarried:
53.2% (25)
Women who did not give birth in the past 12 months Now married:
23.4% (100)Unmarried:
76.6% (325)
Marital status - Other race population 15 years and over
Males 19.8% Never married76.0% Now married0.0% Separated0.0% Widowed4.1% DivorcedFemales 29.9% Never married61.7% Now married0.9% Separated7.5% Widowed0.0% DivorcedWomen who did not give birth in the past 12 months Now married:
60.5% (44)Unmarried:
39.5% (29)
Marital status - Two or more races population 15 years and over
Males 43.7% Never married35.6% Now married1.0% Separated6.7% Widowed13.1% DivorcedFemales 53.2% Never married23.0% Now married4.4% Separated0.0% Widowed19.4% DivorcedWomen who gave birth in the past 12 months Now married:
0.0% (0)Unmarried:
100.0% (15)
Women who did not give birth in the past 12 months Now married:
23.9% (152)Unmarried:
76.1% (484)
Marital status - White alone, not Hispanic / Latino population 15 years and over
Males 37.2% Never married45.8% Now married0.8% Separated3.8% Widowed12.4% DivorcedFemales 25.2% Never married46.7% Now married1.1% Separated12.2% Widowed14.8% DivorcedWomen who gave birth in the past 12 months Now married:
59.8% (198)Unmarried:
40.2% (133)
Women who did not give birth in the past 12 months Now married:
38.4% (1,887)Unmarried:
61.6% (3,024)
Marital status - Hispanic or Latino population 15 years and over
Males 44.0% Never married44.2% Now married0.9% Separated0.0% Widowed10.9% DivorcedFemales 42.2% Never married30.3% Now married4.1% Separated4.9% Widowed18.5% DivorcedWomen who gave birth in the past 12 months Now married:
100.0% (16)Unmarried:
0.0% (0)
Women who did not give birth in the past 12 months Now married:
25.2% (130)Unmarried:
74.8% (387)
Ancestries in Manitowoc
5,525 36.6% German1,379 9.1% American818 5.4% Irish758 5.0% Polish523 3.5% English380 2.5% Norwegian351 2.3% Czech261 1.7% European249 1.6% Italian153 1.0% French116 0.8% French Canadian109 0.7% Finnish108 0.7% Swedish88 0.6% Belgian84 0.6% Russian82 0.5% Eastern European69 0.5% Scandinavian69 0.5% Scottish54 0.4% Austrian47 0.3% Dutch31 0.2% Luxembourger30 0.2% Scotch-Irish29 0.2% Croatian23 0.2% Iranian19 0.1% Celtic19 0.1% Czechoslovakian19 0.1% Greek15 0.10% Danish13 0.09% Latvian8 0.05% Welsh6 0.04% African6 0.04% Yugoslavian
Geographical mobility in Manitowoc Same house 1 year ago 25,313 86.6% White (Caucasian)445 73.7% Black or African American103 100.0% American Indian / Alaska Native1,778 97.5% Asian319 94.3% Other race2,061 95.1% Two or more races24,808 87.2% White alone, not Hispanic / Latino1,611 77.0% Hispanic or LatinoMoved within same county 1,690 5.8% White / Caucasian56 9.2% Black or African American21 1.1% Asian6 1.9% Other race74 3.4% Two or more races1,634 5.7% White alone, not Hispanic / Latino195 9.3% Hispanic or LatinoMoved within same state 1,195 4.1% White / Caucasian15 2.5% Black or African American45 2.1% Two or more races1,049 3.7% White alone, not Hispanic / Latino227 10.8% Hispanic or LatinoMoved from different state 610 2.1% White / Caucasian103 17.0% Black or African American1 0.6% American Indian / Alaska Native591 2.1% White alone, not Hispanic / Latino20 1.0% Hispanic or LatinoMoved from abroad 58 0.2% White19 1.1% Asian62 0.2% White alone, not Hispanic / Latino
Children Nativity (place of birth) in Manitowoc
Children under 6 years - Living with two parents Both parents native 1,070 100.0% NativeBoth parents foreign-born 30 100.0% NativeOne native, one foreign-born parent 118 100.0% NativeChildren under 6 years - Living with one parent Native parent 709 100.0% NativeForeign-born parent 218 100.0% NativeChildren 6 to 17 years - Living with two parents Both parents native 2,310 97.2% Native66 2.8% Foreign-bornBoth parents foreign-born 243 79.4% Native63 20.6% Foreign-bornOne native, one foreign-born parent 125 100.0% NativeChildren 6 to 17 years - Living with one parent Native parent 1,890 100.0% NativeForeign-born parent 76 52.4% Native69 47.6% Foreign-born
Grandparents responsible for own grandchildren in Manitowoc
Grandparents (30 to 59 years) White / Caucasian 33 26.6% Responsible for grandchildren92 73.4% Not responsible for grandchildrenAsian 19 100.0% Not responsible for grandchildrenWhite alone, not Hispanic / Latino 34 27.5% Responsible for grandchildren91 72.5% Not responsible for grandchildrenHispanic or Latino 6 100.0% Not responsible for grandchildrenGrandparents (60 years and over) White / Caucasian 51 67.8% Responsible for grandchildren24 32.2% Not responsible for grandchildrenAsian 27 100.0% Not responsible for grandchildrenWhite alone, not Hispanic / Latino 51 67.2% Responsible for grandchildren25 32.8% Not responsible for grandchildren