Races in Maple Plain, Wisconsin (WI) Detailed Stats
Ancestries, Foreign-born residents, place of birth
Race distribution in Maple Plain

- 73183.4%White alone
- 13815.8%American Indian alone
- 60.7%Two or more races
- 10.1%Black alone

2000
2022
-
- 4,681,63087.3%White alone
- 300,2455.6%Black alone
- 192,9213.6%Hispanic
- 87,9951.6%Asian alone
- 51,9211.0%Two or more races
- 43,9800.8%American Indian alone
- 3,6370.07%Other race alone
- 1,3460.03%Native Hawaiian and Other
Pacific Islander alone

-
- 4,654,03179.0%White alone
- 447,0227.6%Hispanic
- 345,6785.9%Black alone
- 217,5323.7%Two or more races
- 172,2422.9%Asian alone
- 33,7620.6%American Indian alone
- 19,6800.3%Other race alone
- 2,5920.04%Native Hawaiian and Other
Pacific Islander alone

Income and house value in Maple Plain
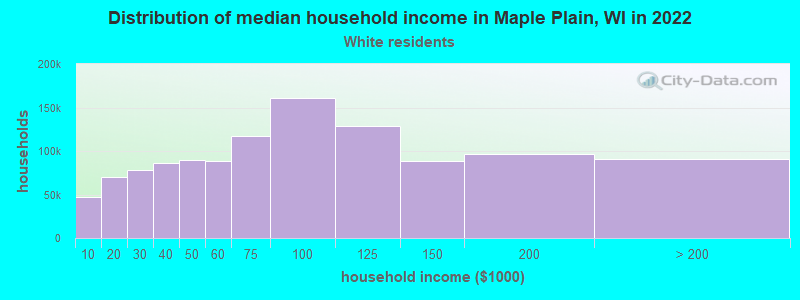
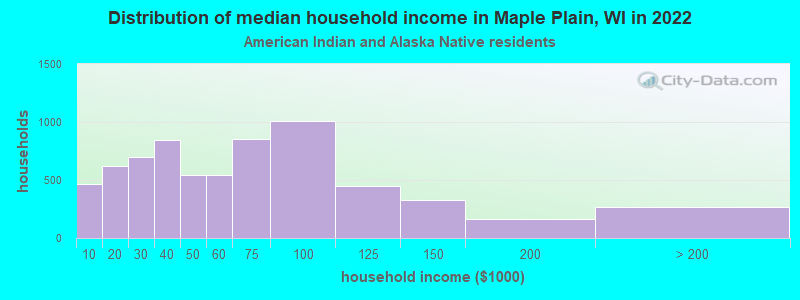
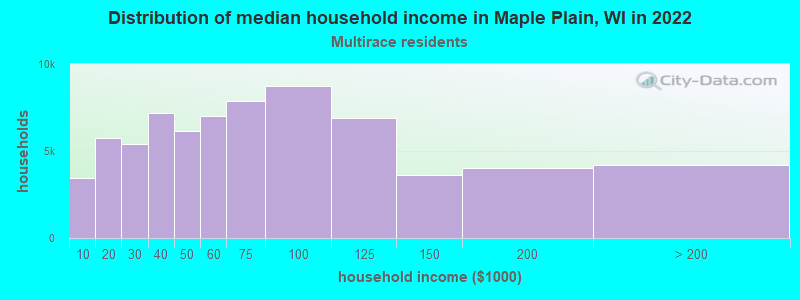
- Median household income in 2022
- $82,843White non-Hispanic householders
- $44,723American Indian and Alaska Native householders
- $6,356Native Hawaiian and other Pacific Islander householders
- $65,492Two or more races householders
- Median 2022 house value
- $399,721White Non-Hispanic householders
- $97,748American Indian or Alaska Native householders
Household income for White non-Hispanic householders
Household income for American Indian and Alaska Native householders
Household income for Native Hawaiian and other Pacific Islander householders

Household income for Two or more races householders
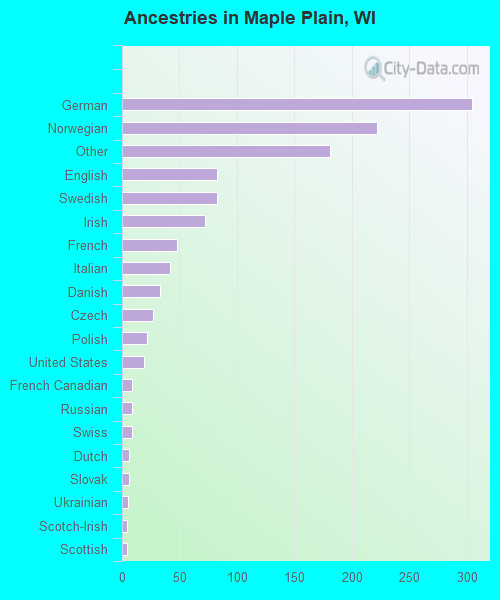
Ancestries in Maple Plain

- 30425.5%German
- 22218.6%Norwegian
- 18115.2%Other
- 837.0%English
- 837.0%Swedish
- 726.0%Irish
- 484.0%French
- 423.5%Italian
- 332.8%Danish
- 272.3%Czech
- 221.8%Polish
- 191.6%United States
- 90.8%French Canadian
- 90.8%Russian
- 90.8%Swiss
- 60.5%Dutch
- 60.5%Slovak
- 50.4%Ukrainian
- 40.3%Scotch-Irish
- 40.3%Scottish
- 20.2%Arab
- 20.2%Hungarian
- 10.08%Welsh
Zip codes: 54829.