Races in Margate, Florida (FL) Detailed Stats
Data:
Races - White alone (%)
Races - White alone (% change since 2000)
Races - Black alone (%)
Races - Black alone (% change since 2000)
Races - American Indian alone (%)
Races - American Indian alone (% change since 2000)
Races - Asian alone (%)
Races - Asian alone (% change since 2000)
Races - Hispanic (%)
Races - Hispanic (% change since 2000)
Races - Native Hawaiian and Other Pacific Islander alone (%)
Races - Native Hawaiian and Other Pacific Islander alone (% change since 2000)
Races - Two or more races(%)
Races - Two or more races(% change since 2000)
Races - Other race alone (%)
Races - Other race alone (% change since 2000)
Racial diversity
Place of birth - Born in state of residence (%)
Place of birth - Born in state of residence (%) - White
Place of birth - Born in state of residence (%) - Black or African American
Place of birth - Born in state of residence (%) - Asian
Place of birth - Born in state of residence (%) - Hispanic or Latino
Place of birth - Born in state of residence (%) - American Indian and Alaska Native
Place of birth - Born in state of residence (%) - Multirace
Place of birth - Born in state of residence (%) - Other Race
Place of birth - Born in other state (%)
Place of birth - Born in other state (%) - White
Place of birth - Born in other state (%) - Black or African American
Place of birth - Born in other state (%) - Asian
Place of birth - Born in other state (%) - Hispanic or Latino
Place of birth - Born in other state (%) - American Indian and Alaska Native
Place of birth - Born in other state (%) - Multirace
Place of birth - Born in other state (%) - Other Race
Place of birth - Native, outside of US (%)
Place of birth - Native, outside of US (%) - White
Place of birth - Native, outside of US (%) - Black or African American
Place of birth - Native, outside of US (%) - Asian
Place of birth - Native, outside of US (%) - Hispanic or Latino
Place of birth - Native, outside of US (%) - American Indian and Alaska Native
Place of birth - Native, outside of US (%) - Multirace
Place of birth - Native, outside of US (%) - Other Race
Place of birth - Foreign born (%)
Place of birth - Foreign born (%) - White
Place of birth - Foreign born (%) - Black or African American
Place of birth - Foreign born (%) - Asian
Place of birth - Foreign born (%) - Hispanic or Latino
Place of birth - Foreign born (%) - American Indian and Alaska Native
Place of birth - Foreign born (%) - Multirace
Place of birth - Foreign born (%) - Other Race
Residents speaking English at home (%)
Residents speaking English at home - Born in the United States (%)
Residents speaking English at home - Native, born elsewhere (%)
Residents speaking English at home - Foreign born (%)
Residents speaking Spanish at home (%)
Residents speaking Spanish at home - Born in the United States (%)
Residents speaking Spanish at home - Native, born elsewhere (%)
Residents speaking Spanish at home - Foreign born (%)
Residents speaking other language at home (%)
Residents speaking other language at home - Born in the United States (%)
Residents speaking other language at home - Native, born elsewhere (%)
Residents speaking other language at home - Foreign born (%)
Marital status - Never married (%)
Marital status - Now married (%)
Marital status - Separated (%)
Marital status - Widowed (%)
Marital status - Divorced (%)
Ancestries Reported - Arab (%)
Ancestries Reported - Czech (%)
Ancestries Reported - Danish (%)
Ancestries Reported - Dutch (%)
Ancestries Reported - English (%)
Ancestries Reported - French (%)
Ancestries Reported - French Canadian (%)
Ancestries Reported - German (%)
Ancestries Reported - Greek (%)
Ancestries Reported - Hungarian (%)
Ancestries Reported - Irish (%)
Ancestries Reported - Italian (%)
Ancestries Reported - Lithuanian (%)
Ancestries Reported - Norwegian (%)
Ancestries Reported - Polish (%)
Ancestries Reported - Portuguese (%)
Ancestries Reported - Russian (%)
Ancestries Reported - Scotch-Irish (%)
Ancestries Reported - Scottish (%)
Ancestries Reported - Slovak (%)
Ancestries Reported - Subsaharan African (%)
Ancestries Reported - Swedish (%)
Ancestries Reported - Swiss (%)
Ancestries Reported - Ukrainian (%)
Ancestries Reported - United States (%)
Ancestries Reported - Welsh (%)
Ancestries Reported - West Indian (%)
Ancestries Reported - Other (%)
Geographical mobility - Same house 1 year ago (%)
Geographical mobility - Same house 1 year ago (%) - White
Geographical mobility - Same house 1 year ago (%) - Black or African American
Geographical mobility - Same house 1 year ago (%) - Asian
Geographical mobility - Same house 1 year ago (%) - Hispanic or Latino
Geographical mobility - Same house 1 year ago (%) - American Indian and Alaska Native
Geographical mobility - Same house 1 year ago (%) - Multirace
Geographical mobility - Same house 1 year ago (%) - Other Race
Geographical mobility - Moved within same county (%)
Geographical mobility - Moved within same county (%) - White
Geographical mobility - Moved within same county (%) - Black or African American
Geographical mobility - Moved within same county (%) - Asian
Geographical mobility - Moved within same county (%) - Hispanic or Latino
Geographical mobility - Moved within same county (%) - American Indian and Alaska Native
Geographical mobility - Moved within same county (%) - Multirace
Geographical mobility - Moved within same county (%) - Other Race
Geographical mobility - Moved from different county within same state (%)
Geographical mobility - Moved from different county within same state (%) - White
Geographical mobility - Moved from different county within same state (%) - Black or African American
Geographical mobility - Moved from different county within same state (%) - Asian
Geographical mobility - Moved from different county within same state (%) - Hispanic or Latino
Geographical mobility - Moved from different county within same state (%) - American Indian and Alaska Native
Geographical mobility - Moved from different county within same state (%) - Multirace
Geographical mobility - Moved from different county within same state (%) - Other Race
Geographical mobility - Moved from different state (%)
Geographical mobility - Moved from different state (%) - White
Geographical mobility - Moved from different state (%) - Black or African American
Geographical mobility - Moved from different state (%) - Asian
Geographical mobility - Moved from different state (%) - Hispanic or Latino
Geographical mobility - Moved from different state (%) - American Indian and Alaska Native
Geographical mobility - Moved from different state (%) - Multirace
Geographical mobility - Moved from different state (%) - Other Race
Geographical mobility - Moved from abroad (%)
Geographical mobility - Moved from abroad (%) - White
Geographical mobility - Moved from abroad (%) - Black or African American
Geographical mobility - Moved from abroad (%) - Asian
Geographical mobility - Moved from abroad (%) - Hispanic or Latino
Geographical mobility - Moved from abroad (%) - American Indian and Alaska Native
Geographical mobility - Moved from abroad (%) - Multirace
Geographical mobility - Moved from abroad (%) - Other Race
Place of birth for the foreign-born population - Ireland (%)
Place of birth for the foreign-born population - Denmark (%)
Place of birth for the foreign-born population - Norway (%)
Place of birth for the foreign-born population - Sweden (%)
Place of birth for the foreign-born population - United Kingdom (%)
Place of birth for the foreign-born population - England (%)
Place of birth for the foreign-born population - Scotland (%)
Place of birth for the foreign-born population - Other Northern Europe (%)
Place of birth for the foreign-born population - Austria (%)
Place of birth for the foreign-born population - Belgium (%)
Place of birth for the foreign-born population - France (%)
Place of birth for the foreign-born population - Germany (%)
Place of birth for the foreign-born population - Netherlands (%)
Place of birth for the foreign-born population - Switzerland (%)
Place of birth for the foreign-born population - Other Western Europe (%)
Place of birth for the foreign-born population - Greece (%)
Place of birth for the foreign-born population - Italy (%)
Place of birth for the foreign-born population - Portugal (%)
Place of birth for the foreign-born population - Spain (%)
Place of birth for the foreign-born population - Other Southern Europe (%)
Place of birth for the foreign-born population - Albania (%)
Place of birth for the foreign-born population - Belarus (%)
Place of birth for the foreign-born population - Bosnia and Herzegovina (%)
Place of birth for the foreign-born population - Bulgaria (%)
Place of birth for the foreign-born population - Croatia (%)
Place of birth for the foreign-born population - Czechoslovakia (%)
Place of birth for the foreign-born population - Hungary (%)
Place of birth for the foreign-born population - Latvia (%)
Place of birth for the foreign-born population - Lithuania (%)
Place of birth for the foreign-born population - North Macedonia (Macedonia) (%)
Place of birth for the foreign-born population - Moldova (%)
Place of birth for the foreign-born population - Poland (%)
Place of birth for the foreign-born population - Romania (%)
Place of birth for the foreign-born population - Russia (%)
Place of birth for the foreign-born population - Serbia (%)
Place of birth for the foreign-born population - Ukraine (%)
Place of birth for the foreign-born population - Other Eastern Europe (%)
Place of birth for the foreign-born population - China (%)
Place of birth for the foreign-born population - Hong Kong (%)
Place of birth for the foreign-born population - Taiwan (%)
Place of birth for the foreign-born population - Japan (%)
Place of birth for the foreign-born population - Korea (%)
Place of birth for the foreign-born population - Other Eastern Asia (%)
Place of birth for the foreign-born population - Afghanistan (%)
Place of birth for the foreign-born population - Bangladesh (%)
Place of birth for the foreign-born population - India (%)
Place of birth for the foreign-born population - Iran (%)
Place of birth for the foreign-born population - Kazakhstan (%)
Place of birth for the foreign-born population - Nepal (%)
Place of birth for the foreign-born population - Pakistan (%)
Place of birth for the foreign-born population - Sri Lanka (%)
Place of birth for the foreign-born population - Uzbekistan (%)
Place of birth for the foreign-born population - Other South Central Asia (%)
Place of birth for the foreign-born population - Burma (%)
Place of birth for the foreign-born population - Cambodia (%)
Place of birth for the foreign-born population - Indonesia (%)
Place of birth for the foreign-born population - Laos (%)
Place of birth for the foreign-born population - Malaysia (%)
Place of birth for the foreign-born population - Philippines (%)
Place of birth for the foreign-born population - Singapore (%)
Place of birth for the foreign-born population - Thailand (%)
Place of birth for the foreign-born population - Vietnam (%)
Place of birth for the foreign-born population - Other South Eastern Asia (%)
Place of birth for the foreign-born population - Armenia (%)
Place of birth for the foreign-born population - Iraq (%)
Place of birth for the foreign-born population - Israel (%)
Place of birth for the foreign-born population - Jordan (%)
Place of birth for the foreign-born population - Kuwait (%)
Place of birth for the foreign-born population - Lebanon (%)
Place of birth for the foreign-born population - Saudi Arabia (%)
Place of birth for the foreign-born population - Syria (%)
Place of birth for the foreign-born population - Turkey (%)
Place of birth for the foreign-born population - Yemen (%)
Place of birth for the foreign-born population - Other Western Asia (%)
Place of birth for the foreign-born population - Eritrea (%)
Place of birth for the foreign-born population - Ethiopia (%)
Place of birth for the foreign-born population - Kenya (%)
Place of birth for the foreign-born population - Somalia (%)
Place of birth for the foreign-born population - Uganda (%)
Place of birth for the foreign-born population - Zimbabwe (%)
Place of birth for the foreign-born population - Other Eastern Africa (%)
Place of birth for the foreign-born population - Cameroon (%)
Place of birth for the foreign-born population - Congo (%)
Place of birth for the foreign-born population - Democratic Republic of Congo (Zaire) (%)
Place of birth for the foreign-born population - Other Middle Africa (%)
Place of birth for the foreign-born population - Egypt (%)
Place of birth for the foreign-born population - Morocco (%)
Place of birth for the foreign-born population - Sudan (%)
Place of birth for the foreign-born population - Other Northern Africa (%)
Place of birth for the foreign-born population - South Africa (%)
Place of birth for the foreign-born population - Other Southern Africa (%)
Place of birth for the foreign-born population - Cabo Verde (%)
Place of birth for the foreign-born population - Ghana (%)
Place of birth for the foreign-born population - Liberia (%)
Place of birth for the foreign-born population - Nigeria (%)
Place of birth for the foreign-born population - Senegal (%)
Place of birth for the foreign-born population - Sierra Leone (%)
Place of birth for the foreign-born population - Other Western Africa (%)
Place of birth for the foreign-born population - Australia (%)
Place of birth for the foreign-born population - New Zealand (%)
Place of birth for the foreign-born population - Fiji (%)
Place of birth for the foreign-born population - Micronesia (%)
Place of birth for the foreign-born population - Bahamas (%)
Place of birth for the foreign-born population - Barbados (%)
Place of birth for the foreign-born population - Cuba (%)
Place of birth for the foreign-born population - Dominica (%)
Place of birth for the foreign-born population - Dominican Republic (%)
Place of birth for the foreign-born population - Grenada (%)
Place of birth for the foreign-born population - Haiti (%)
Place of birth for the foreign-born population - Jamaica (%)
Place of birth for the foreign-born population - St. Vincent and the Grenadines (%)
Place of birth for the foreign-born population - Trinidad and Tobago (%)
Place of birth for the foreign-born population - West Indies (%)
Place of birth for the foreign-born population - Other Caribbean (%)
Place of birth for the foreign-born population - Belize (%)
Place of birth for the foreign-born population - Costa Rica (%)
Place of birth for the foreign-born population - El Salvador (%)
Place of birth for the foreign-born population - Guatemala (%)
Place of birth for the foreign-born population - Honduras (%)
Place of birth for the foreign-born population - Mexico (%)
Place of birth for the foreign-born population - Nicaragua (%)
Place of birth for the foreign-born population - Panama (%)
Place of birth for the foreign-born population - Other Central America (%)
Place of birth for the foreign-born population - Argentina (%)
Place of birth for the foreign-born population - Bolivia (%)
Place of birth for the foreign-born population - Brazil (%)
Place of birth for the foreign-born population - Chile (%)
Place of birth for the foreign-born population - Colombia (%)
Place of birth for the foreign-born population - Ecuador (%)
Place of birth for the foreign-born population - Guyana (%)
Place of birth for the foreign-born population - Peru (%)
Place of birth for the foreign-born population - Uruguay (%)
Place of birth for the foreign-born population - Venezuela (%)
Place of birth for the foreign-born population - Other South America (%)
Place of birth for the foreign-born population - Canada (%)
Place of birth for the foreign-born population - Other Northern America (%)
Place of birth for the foreign-born population - Other (%)
Latest news about races in Margate, FL collected exclusively by city-data.com from local newspapers, TV, and radio stations
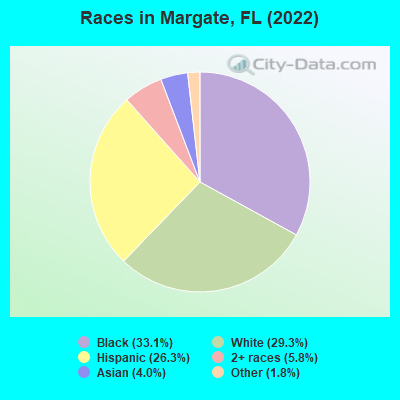
According to 2022 data, the most numerous races in Margate, FL are White alone (17,156 residents), Hispanic (15,391 residents), and Black alone (19,413 residents). 62.6% of Margate residents speak English at home. 39.6% of Margate, FL residents are foreign-born (31.6% born in Latin America), which is 47.0% greater than the foreign-born rate of 21.0% across the entire state of Florida.
Race distribution in Margate
2000 2022
36,534 67.8% White alone 8,238 15.3% Hispanic 6,069 11.3% Black alone 1,485 2.8% Asian alone 1,271 2.4% Two or more races 189 0.4% Other race alone 95 0.2% American Indian alone 28 0.05% Native Hawaiian and Other
19,413 33.1% Black alone 17,156 29.3% White alone 15,391 26.3% Hispanic 3,402 5.8% Two or more races 2,340 4.0% Asian alone 1,057 1.8% Other race alone 29 0.05% American Indian alone
2000 2022
10,458,509 65.4% White alone 2,682,715 16.8% Hispanic 2,264,268 14.2% Black alone 261,693 1.6% Asian alone 236,954 1.5% Two or more races 42,358 0.3% American Indian alone 28,994 0.2% Other race alone 6,887 0.04% Native Hawaiian and Other
11,309,403 50.8% White alone 6,025,039 27.1% Hispanic 3,241,015 14.6% Black alone 861,630 3.9% Two or more races 623,692 2.8% Asian alone 152,054 0.7% Other race alone 22,504 0.1% American Indian alone 9,486 0.04% Native Hawaiian and Other
Income and house value in Margate Median household income in 2022 $57,343 White non-Hispanic householders$57,444 Black householders$63,390 Asian householders$51,426 Some other race householders$82,537 Two or more races householders$56,531 Hispanic or Latino race householdersMedian 2022 house value $387,562 White Non-Hispanic householders$424,987 Black or African American householders$562,451 American Indian or Alaska Native householders $404,835 Asian householders$400,157 Some other race householders$401,956 Two or more races householders$390,441 Hispanic or Latino householders
Median age by race in Margate
59.6 Median age for White residents56.4 61.6 37.6 Median age for Black or African American residents34.9 39.2 -660,098,521.5 Median age for American Indian / Alaska Native residents-518,333,332.8 -735,362,996.9 54.2 Median age for Asian residents53.5 55.4 -437,357,630.5 Median age for Native Hawaiian / Pacific Islander residents-454,756,380.1 -666,666,666.0 40.8 Median age for Other race residents40.1 41.0 42.9 Median age for Two or more races residents39.4 44.9 61.8 Median age for White alone residents59.3 63.5 44.2 Median age for Hispanic or Latino residents44.7 43.4
Owner/renter occupied households by race in Margate
House owners and renters - White residents 8,321 79.6% Owner occupied2,128 20.4% Renter occupiedHouse owners and renters - Black or African American residents 5,331 72.6% Owner occupied2,008 27.4% Renter occupiedHouse owners and renters - American Indian / Alaska Native residents 27 100.0% Owner occupiedHouse owners and renters - Asian residents 853 91.2% Owner occupied82 8.8% Renter occupiedHouse owners and renters - Other race residents 1,675 72.0% Owner occupied653 28.0% Renter occupiedHouse owners and renters - Two or more races residents 4,003 77.6% Owner occupied1,152 22.4% Renter occupiedHouse owners and renters - White alone residents 7,837 83.0% Owner occupied1,603 17.0% Renter occupiedHouse owners and renters - Hispanic or Latino residents 4,280 66.3% Owner occupied2,179 33.7% Renter occupied
Language usage in Margate
English speakers - Total 62.6% of residents of Margate speak English at home.
22.5% of residents speak Spanish at home 7,045 55.5% Speak English very well5,660 44.5% Speak English less than very well14.6% of residents speak other language at home 5,300 64.4% Speak English very well2,935 35.6% Speak English less than very well
English speakers - Born in the United States 86.7% of residents of Margate speak English at home.
10.4% of residents speak Spanish at home 1,575 89.3% Speak English very well188 10.7% Speak English less than very well2.3% of residents speak other language at home 375 95.2% Speak English very well19 4.8% Speak English less than very well
English speakers - Native, born elsewhere 32.1% of residents of Margate speak English at home.
69.1% of residents speak Spanish at home 1,109 83.8% Speak English very well214 16.2% Speak English less than very well1.3% of residents speak other language at home 11 45.8% Speak English very well13 54.2% Speak English less than very well
English speakers - Foreign-born 38.2% of residents of Margate speak English at home.
31.9% of residents speak Spanish at home 2,548 34.5% Speak English very well4,828 65.5% Speak English less than very well28.5% of residents speak other language at home 3,836 58.2% Speak English very well2,752 41.8% Speak English less than very well
White (Caucasian) - Speak only English Native:
89.6% (14,470)Foreign-born:
20.8% (663)
White (Caucasian) - Speak another language Native:
11.6% (1,871)Foreign-born:
79.6% (2,534)
Black or African American - Speak only English Native:
88.0% (8,008)Foreign-born:
61.9% (5,899)
Black or African American - Speak another language Native:
12.0% (1,094)Foreign-born:
36.8% (3,505)
Asian - Speak only English Native:
69.6% (251)Foreign-born:
25.3% (502)
Asian - Speak another language Native:
28.4% (102)Foreign-born:
74.4% (1,474)
Other race - Speak only English Native:
47.9% (792)Foreign-born:
27.5% (714)
Other race - Speak another language Native:
53.2% (880)Foreign-born:
73.0% (1,895)
Two or more races - Speak only English Native:
49.7% (3,252)Foreign-born:
22.0% (1,226)
Two or more races - Speak another language Native:
50.2% (3,282)Foreign-born:
76.0% (4,243)
White alone - Speak only English Native:
94.3% (14,233)Foreign-born:
40.0% (697)
White alone - Speak another language Native:
5.6% (848)Foreign-born:
60.7% (1,056)
Hispanic or Latino - Speak only English Native:
33.6% (2,368)Foreign-born:
5.1% (391)
Hispanic or Latino - Speak another language Native:
66.4% (4,680)Foreign-born:
94.9% (7,238)
Foreign-born residents in Margate 23,211 residents are foreign born (31.6% Latin America ).
This city:
39.6%Florida:
21.1%
Marital status for residents in Margate Marital status - White (Caucasian) population 15 years and over
Males 24.9% Never married54.0% Now married1.3% Separated4.8% Widowed15.0% DivorcedFemales 21.3% Never married43.1% Now married1.7% Separated12.9% Widowed21.1% DivorcedWomen who gave birth in the past 12 months Now married:
15.2% (29)Unmarried:
84.8% (162)
Women who did not give birth in the past 12 months Now married:
43.2% (1,195)Unmarried:
56.8% (1,573)
Marital status - Black or African American population 15 years and over
Males 38.2% Never married47.4% Now married5.4% Separated1.1% Widowed7.9% DivorcedFemales 33.0% Never married41.9% Now married2.9% Separated7.0% Widowed15.3% DivorcedWomen who gave birth in the past 12 months Now married:
100.0% (38)Unmarried:
0.0% (0)
Women who did not give birth in the past 12 months Now married:
39.7% (1,880)Unmarried:
60.3% (2,850)
Marital status - American Indian / Alaska Native population 15 years and over
Males 0.0% Never married100.0% Now married0.0% Separated0.0% Widowed0.0% DivorcedFemales 0.0% Never married100.0% Now married0.0% Separated0.0% Widowed0.0% DivorcedMarital status - Asian population 15 years and over
Males 26.0% Never married57.9% Now married0.0% Separated1.1% Widowed15.1% DivorcedFemales 13.5% Never married62.5% Now married0.0% Separated17.5% Widowed6.5% DivorcedWomen who gave birth in the past 12 months Now married:
100.0% (44)Unmarried:
0.0% (0)
Women who did not give birth in the past 12 months Now married:
59.8% (230)Unmarried:
40.2% (155)
Marital status - Other race population 15 years and over
Males 33.5% Never married45.6% Now married10.2% Separated0.0% Widowed10.7% DivorcedFemales 16.2% Never married53.5% Now married3.6% Separated0.9% Widowed25.8% DivorcedWomen who gave birth in the past 12 months Now married:
54.3% (57)Unmarried:
45.7% (48)
Women who did not give birth in the past 12 months Now married:
30.6% (314)Unmarried:
69.4% (713)
Marital status - Two or more races population 15 years and over
Males 26.7% Never married47.4% Now married0.7% Separated8.9% Widowed16.2% DivorcedFemales 30.7% Never married41.8% Now married2.4% Separated9.0% Widowed16.2% DivorcedWomen who gave birth in the past 12 months Now married:
100.0% (27)Unmarried:
0.0% (0)
Women who did not give birth in the past 12 months Now married:
50.3% (1,406)Unmarried:
49.7% (1,388)
Marital status - White alone, not Hispanic / Latino population 15 years and over
Males 24.8% Never married53.1% Now married0.5% Separated5.7% Widowed15.9% DivorcedFemales 19.7% Never married42.0% Now married2.0% Separated14.7% Widowed21.5% DivorcedWomen who gave birth in the past 12 months Now married:
18.7% (25)Unmarried:
81.3% (109)
Women who did not give birth in the past 12 months Now married:
40.5% (855)Unmarried:
59.5% (1,257)
Marital status - Hispanic or Latino population 15 years and over
Males 24.3% Never married52.6% Now married4.0% Separated5.4% Widowed13.7% DivorcedFemales 26.6% Never married43.7% Now married2.4% Separated6.9% Widowed20.5% DivorcedWomen who gave birth in the past 12 months Now married:
34.4% (69)Unmarried:
65.6% (131)
Women who did not give birth in the past 12 months Now married:
44.7% (1,553)Unmarried:
55.3% (1,923)
Ancestries in Margate
5,028 12.8% Jamaican3,845 9.8% American3,500 8.9% Haitian1,924 4.9% Italian1,075 2.7% English871 2.2% German805 2.0% Trinidadian and Tobagonian624 1.6% Irish483 1.2% Brazilian369 0.9% European314 0.8% Russian288 0.7% Greek259 0.7% Ukrainian203 0.5% Dutch196 0.5% Canadian194 0.5% West Indian187 0.5% Polish182 0.5% British West Indian163 0.4% U.S. Virgin Islander101 0.3% French97 0.2% African95 0.2% Scottish89 0.2% Guyanese81 0.2% French Canadian79 0.2% Palestinian74 0.2% Portuguese55 0.1% Slovak52 0.1% British52 0.1% Hungarian49 0.1% Barbadian48 0.1% Eastern European48 0.1% Danish44 0.1% Scotch-Irish40 0.1% Senegalese30 0.08% Lithuanian30 0.08% Nigerian25 0.06% Ghanaian21 0.05% Croatian21 0.05% Norwegian20 0.05% Romanian15 0.04% Bahamian15 0.04% Iranian14 0.04% Scandinavian12 0.03% Serbian11 0.03% Israeli10 0.03% Armenian10 0.03% Pennsylvania German8 0.02% Swedish8 0.02% Turkish7 0.02% Finnish
Geographical mobility in Margate Same house 1 year ago 17,380 89.8% White (Caucasian)18,115 93.4% Black or African American52 100.0% American Indian / Alaska Native2,168 92.5% Asian3,504 79.8% Other race11,449 87.9% Two or more races15,635 91.5% White alone, not Hispanic / Latino12,817 84.4% Hispanic or LatinoMoved within same county 1,151 5.9% White / Caucasian1,063 5.5% Black or African American45 1.9% Asian718 16.4% Other race842 6.5% Two or more races877 5.1% White alone, not Hispanic / Latino1,465 9.6% Hispanic or LatinoMoved within same state 254 1.3% White / Caucasian120 0.6% Black or African American418 3.2% Two or more races111 0.6% White alone, not Hispanic / Latino490 3.2% Hispanic or LatinoMoved from different state 276 1.4% White / Caucasian106 0.5% Black or African American79 3.4% Asian15 0.3% Other race204 1.6% Two or more races296 1.7% White alone, not Hispanic / Latino84 0.6% Hispanic or LatinoMoved from abroad 282 1.5% White44 0.2% Black or African American62 2.7% Asian78 1.8% Other race31 0.2% Two or more races181 1.1% White alone, not Hispanic / Latino286 1.9% Hispanic or Latino
Children Nativity (place of birth) in Margate
Children under 6 years - Living with two parents Both parents native 671 99.7% Native2 0.3% Foreign-bornBoth parents foreign-born 550 96.1% Native23 3.9% Foreign-bornOne native, one foreign-born parent 152 100.0% NativeChildren under 6 years - Living with one parent Native parent 388 99.2% Native3 0.8% Foreign-bornForeign-born parent 673 87.7% Native94 12.3% Foreign-bornChildren 6 to 17 years - Living with two parents Both parents native 1,400 100.0% NativeBoth parents foreign-born 1,502 79.7% Native382 20.3% Foreign-bornOne native, one foreign-born parent 606 97.5% Native15 2.5% Foreign-bornChildren 6 to 17 years - Living with one parent Native parent 797 100.0% NativeForeign-born parent 1,921 52.1% Native1,764 47.9% Foreign-born
Place of birth for residents in Margate 20,083 Americas19,643 Latin America12,785 Caribbean4,792 South America2,064 Central America1,717 Asia1,307 Europe808 South Eastern Asia586 South Central Asia573 Eastern Europe440 Northern America371 Western Europe255 Eastern Asia255 China245 Southern Europe118 Northern Europe103 Africa65 Western Africa46 Western Asia37 Northern Africa5,406 Jamaica3,287 Haiti2,375 Trinidad and Tobago1,978 Colombia735 Peru710 Vietnam671 Cuba657 Dominican Republic493 Nicaragua473 Brazil466 Ecuador440 Canada416 Mexico411 Honduras376 India355 Guyana314 Argentina311 Guatemala253 Ukraine249 China236 El Salvador208 Russia208 Italy181 Venezuela175 Costa Rica164 Germany143 Netherlands108 Pakistan93 Bolivia86 Dominica70 Bangladesh62 England54 Switzerland47 Barbados47 Bahamas44 West Indies44 Poland44 Chile43 Malaysia42 Senegal30 Philippines24 Jordan23 Grenada23 Czechoslovakia23 United Kingdom23 Liberia23 Thailand22 Georgia20 Portugal20 Panama19 Romania19 Denmark18 Egypt17 Spain9 Morocco9 Algeria8 Serbia8 Hungary8 Austria7 Croatia5 Taiwan
Grandparents responsible for own grandchildren in Margate
Grandparents (30 to 59 years) White / Caucasian 115 69.6% Responsible for grandchildren50 30.4% Not responsible for grandchildrenBlack or African American 161 69.2% Responsible for grandchildren72 30.8% Not responsible for grandchildrenOther race 22 86.9% Responsible for grandchildren3 13.1% Not responsible for grandchildrenTwo or more races 17 100.0% Responsible for grandchildrenWhite alone, not Hispanic / Latino 99 97.0% Responsible for grandchildren3 3.0% Not responsible for grandchildrenHispanic or Latino 101 48.4% Responsible for grandchildren108 51.6% Not responsible for grandchildrenGrandparents (60 years and over) White / Caucasian 74 46.0% Responsible for grandchildren87 54.0% Not responsible for grandchildrenBlack or African American 46 19.7% Responsible for grandchildren190 80.3% Not responsible for grandchildrenOther race 36 100.0% Not responsible for grandchildrenTwo or more races 78 100.0% Not responsible for grandchildrenWhite alone, not Hispanic / Latino 48 31.0% Responsible for grandchildren106 69.0% Not responsible for grandchildrenHispanic or Latino 41 31.1% Responsible for grandchildren91 68.9% Not responsible for grandchildren