Races in Maryland, New York (NY) Detailed Stats
Ancestries, Foreign-born residents, place of birth

Recent posts about races in Maryland, New York on our local forum with over 2,400,000 registered users:
 | smaller Upstate NY cities and towns/African American communities (6029 replies) |
| Upper Middle class african-american communities in ny (2066 replies) |
| do move to utica ny (570 replies) |
| For those interested in state political issues (429 replies) |
| $1.82 billion in development for Niagara Falls area in the works.... (345 replies) |
| Eric Adam’s Appreciation Thread (98 replies) |
Latest news about races in Maryland, NY collected exclusively by city-data.com from local newspapers, TV, and radio stations
2.7% of Maryland, NY residents are foreign-born (1.7% born in Europe, 0.6% born in North America, 0.3% born in Asia), which is 728.2% less than the foreign-born rate of 22.0% across the entire state of New York.
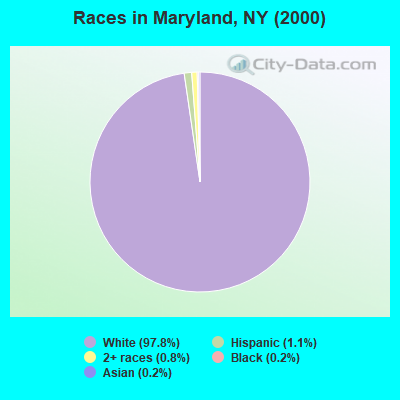
Race distribution in Maryland

- 1,87797.8%White alone
- 211.1%Hispanic
- 160.8%Two or more races
- 30.2%Black alone
- 30.2%Asian alone
2000
2022
-
- 11,760,98162.0%White alone
- 2,867,58315.1%Hispanic
- 2,812,62314.8%Black alone
- 1,035,9265.5%Asian alone
- 366,1161.9%Two or more races
- 75,4990.4%Other race alone
- 52,4990.3%American Indian alone
- 5,2300.03%Native Hawaiian and Other
Pacific Islander alone

-
- 10,408,93352.9%White alone
- 3,867,29919.7%Hispanic
- 2,633,84013.4%Black alone
- 1,776,2869.0%Asian alone
- 732,6703.7%Two or more races
- 216,1101.1%Other race alone
- 35,0820.2%American Indian alone
- 6,9310.04%Native Hawaiian and Other
Pacific Islander alone

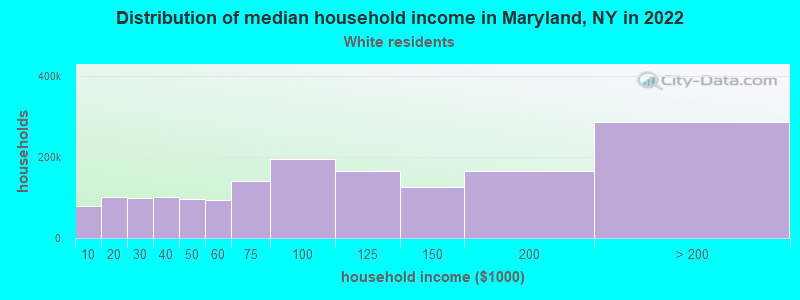
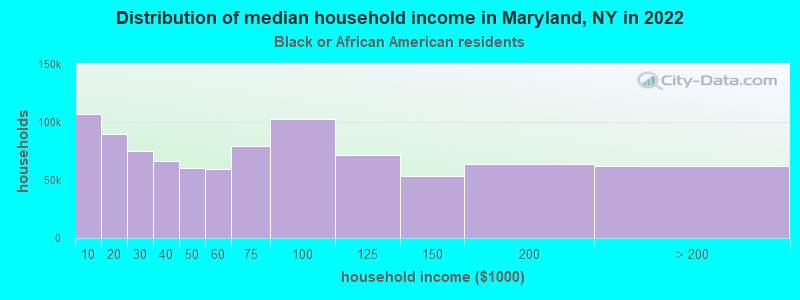
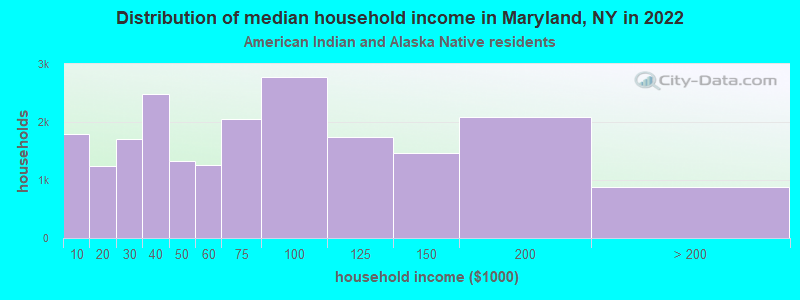
Income and house value in Maryland
- Median household income in 2022
- $60,566White non-Hispanic householders
- $112,634Black householders
- $49,223American Indian and Alaska Native householders
- $63,915Two or more races householders
- $63,621Hispanic or Latino race householders
- Median 2022 house value
- $153,036White Non-Hispanic householders
- $104,979Black or African American householders
- $198,294American Indian or Alaska Native householders
- $151,636Two or more races householders
- $174,965Hispanic or Latino householders
Household income for White non-Hispanic householders
Household income for Black householders
Household income for American Indian and Alaska Native householders
Household income for Two or more races householders
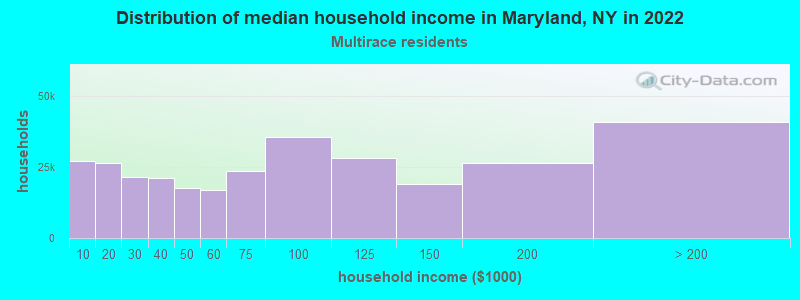
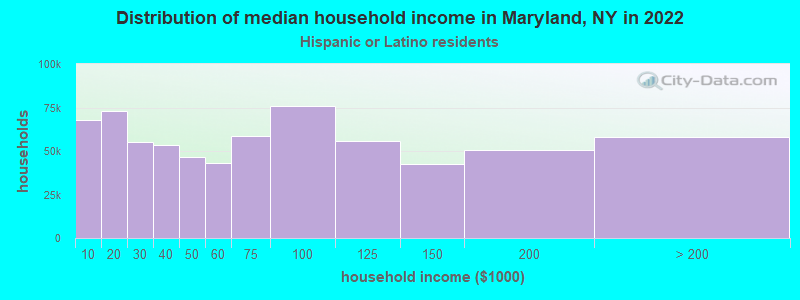
Household income for Hispanic or Latino race householders
Foreign-born residents in Maryland
51 residents are foreign born (1.7% Europe, 0.6% North America, 0.3% Asia).
| This city: | 2.7% |
| New York: | 20.4% |
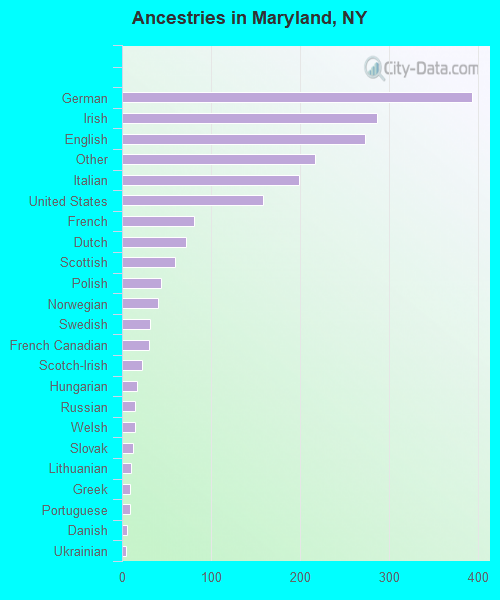
Ancestries in Maryland

- 39319.5%German
- 28714.3%Irish
- 27313.6%English
- 21710.8%Other
- 1999.9%Italian
- 1587.9%United States
- 814.0%French
- 723.6%Dutch
- 603.0%Scottish
- 442.2%Polish
- 412.0%Norwegian
- 321.6%Swedish
- 301.5%French Canadian
- 221.1%Scotch-Irish
- 170.8%Hungarian
- 150.7%Russian
- 150.7%Welsh
- 120.6%Slovak
- 100.5%Lithuanian
- 90.4%Greek
- 90.4%Portuguese
- 60.3%Danish
- 50.2%Ukrainian
- 20.10%Czech
- 20.10%Swiss
Zip codes: 12116.