Races in Maud-Elliot Creek, Texas (TX) Detailed Stats
Ancestries, Foreign-born residents, place of birth
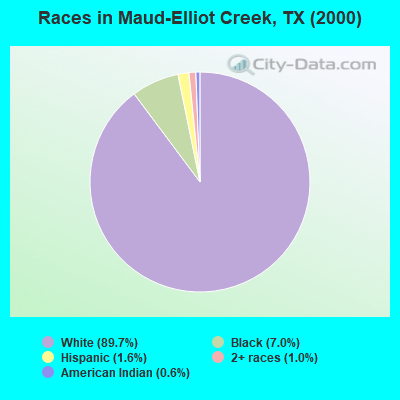
Race distribution in Maud-Elliot Creek

- 8,86889.7%White alone
- 6977.0%Black alone
- 1611.6%Hispanic
- 971.0%Two or more races
- 580.6%American Indian alone
- 70.07%Asian alone
- 30.03%Other race alone
2000
2022
-
- 10,933,31352.4%White alone
- 6,669,66632.0%Hispanic
- 2,364,25511.3%Black alone
- 554,4452.7%Asian alone
- 230,5671.1%Two or more races
- 68,8590.3%American Indian alone
- 19,9580.10%Other race alone
- 10,7570.05%Native Hawaiian and Other
Pacific Islander alone

-
- 12,070,64240.2%Hispanic
- 11,683,43038.9%White alone
- 3,508,70611.7%Black alone
- 1,608,1735.4%Asian alone
- 956,5603.2%Two or more races
- 125,7630.4%Other race alone
- 47,0230.2%American Indian alone
- 29,2750.10%Native Hawaiian and Other
Pacific Islander alone

Income and house value in Maud-Elliot Creek
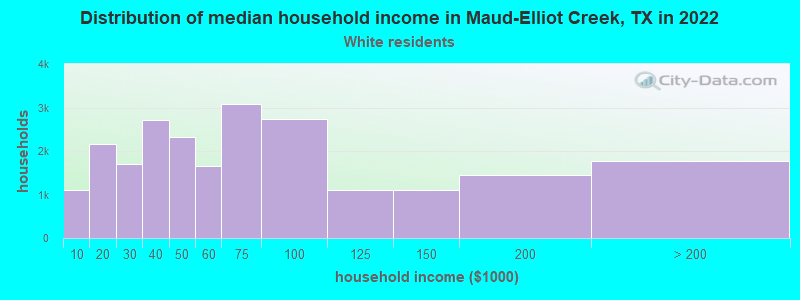
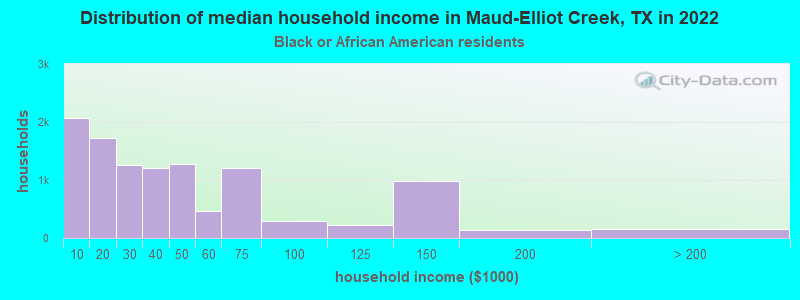
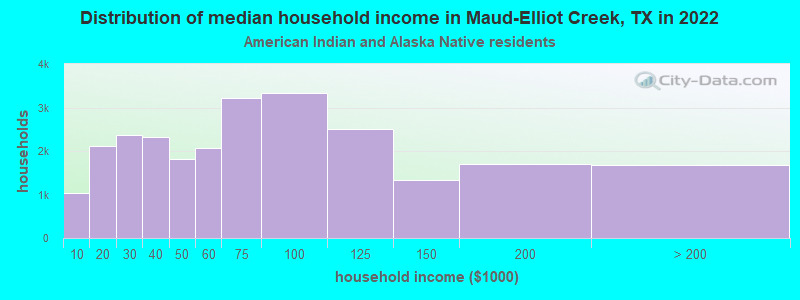
- Median household income in 2022
- $56,477White non-Hispanic householders
- $38,492Black householders
- $41,030American Indian and Alaska Native householders
- $13,804Some other race householders
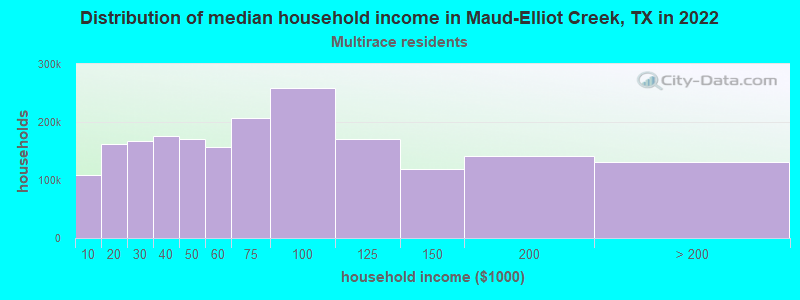
- $107,906Two or more races householders
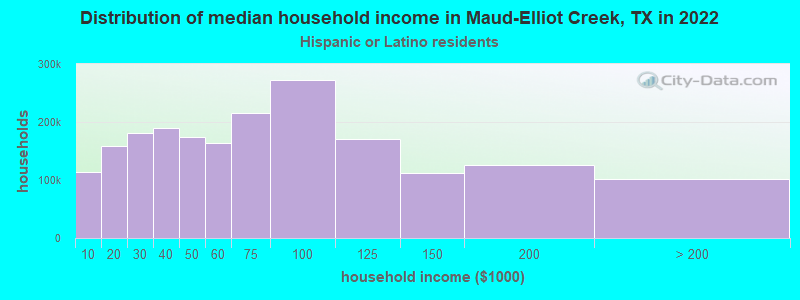
- $57,745Hispanic or Latino race householders
- Median 2022 house value
- $201,665White Non-Hispanic householders
- $100,269Black or African American householders
- $108,437American Indian or Alaska Native householders
- $84,496Some other race householders
- $230,676Two or more races householders
- $226,451Hispanic or Latino householders
Household income for White non-Hispanic householders
Household income for Black householders
Household income for American Indian and Alaska Native householders
Household income for Two or more races householders
Household income for Hispanic or Latino race householders
Zip code: 75573