Races in Medway, Massachusetts (MA) Detailed Stats
Ancestries, Foreign-born residents, place of birth

Recent posts about races in Medway, Massachusetts on our local forum with over 2,400,000 registered users:
 | 2023 Real Estate Observations (5278 replies) |
| towns that offer the most jobs per dollar of house (58 replies) |
| 2022 Real Estate Observations (1122 replies) |
| Opinions on this house - Milford (21 replies) |
| Resistance to multifamily housing law (67 replies) |
| Why is BPS so bad and what should be done to improve it? (589 replies) |
Latest news about races in Medway, MA collected exclusively by city-data.com from local newspapers, TV, and radio stations
4.7% of Medway, MA residents are foreign-born (1.8% born in Europe, 1.2% born in North America, 0.9% born in Asia), which is 280.4% less than the foreign-born rate of 18.0% across the entire state of Massachusetts.
Race distribution in Medway

- 12,05296.8%White alone
- 1180.9%Asian alone
- 1050.8%Hispanic
- 820.7%Two or more races
- 700.6%Black alone
- 120.10%American Indian alone
- 80.06%Other race alone
- 10.01%Native Hawaiian and Other
Pacific Islander alone

2000
2022
-
- 5,198,35981.9%White alone
- 428,7296.8%Hispanic
- 318,3295.0%Black alone
- 236,7863.7%Asian alone
- 110,3381.7%Two or more races
- 43,5860.7%Other race alone
- 11,2640.2%American Indian alone
- 1,7060.03%Native Hawaiian and Other
Pacific Islander alone

-
- 4,676,62767.0%White alone
- 911,03813.0%Hispanic
- 501,4637.2%Asian alone
- 459,7406.6%Black alone
- 341,8894.9%Two or more races
- 84,4031.2%Other race alone
- 5,8380.08%American Indian alone
- 9760.01%Native Hawaiian and Other
Pacific Islander alone

Income and house value in Medway
- Median household income in 2022
- $140,259White non-Hispanic householders
- $57,471Black householders
- over $200,000American Indian and Alaska Native householders
- over $200,000Asian householders
- $51,646Some other race householders
- over $200,000Two or more races householders
- $83,149Hispanic or Latino race householders
- Median 2022 house value
- $671,962White Non-Hispanic householders
- $394,850Black or African American householders
- $394,850American Indian or Alaska Native householders
- $538,431Asian householders
- $664,209Two or more races householders
Household income for White non-Hispanic householders

Household income for Black householders

Household income for American Indian and Alaska Native householders

Household income for Asian householders

Household income for Native Hawaiian and other Pacific Islander householders

Household income for Two or more races householders

Household income for Hispanic or Latino race householders

Foreign-born residents in Medway
589 residents are foreign born (1.8% Europe, 1.2% North America, 0.9% Asia).
| This city: | 4.7% |
| Massachusetts: | 12.2% |
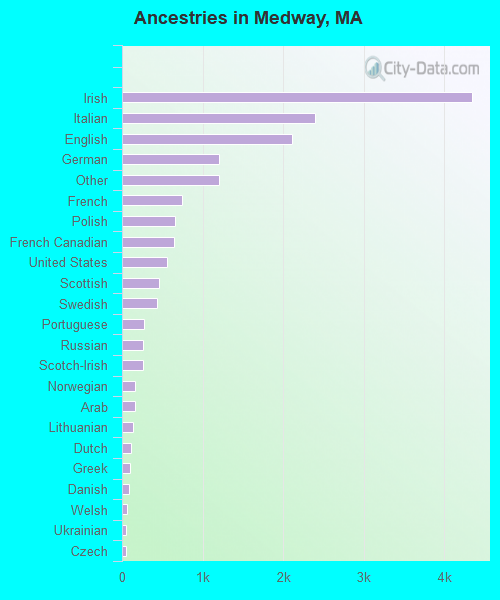
Ancestries in Medway

- 4,34126.3%Irish
- 2,40114.5%Italian
- 2,10812.7%English
- 1,2087.3%German
- 1,2027.3%Other
- 7464.5%French
- 6624.0%Polish
- 6523.9%French Canadian
- 5573.4%United States
- 4652.8%Scottish
- 4292.6%Swedish
- 2741.7%Portuguese
- 2601.6%Russian
- 2601.6%Scotch-Irish
- 1570.9%Norwegian
- 1560.9%Arab
- 1380.8%Lithuanian
- 1110.7%Dutch
- 1010.6%Greek
- 880.5%Danish
- 680.4%Welsh
- 470.3%Ukrainian
- 440.3%Czech
- 300.2%Hungarian
- 150.09%West Indian
- 80.05%Swiss
- 70.04%Slovak
Zip codes: 02053.