Races in Millcreek, Utah (UT) Detailed Stats
Data:
Races - White alone (%)
Races - White alone (% change since 2000)
Races - Black alone (%)
Races - Black alone (% change since 2000)
Races - American Indian alone (%)
Races - American Indian alone (% change since 2000)
Races - Asian alone (%)
Races - Asian alone (% change since 2000)
Races - Hispanic (%)
Races - Hispanic (% change since 2000)
Races - Native Hawaiian and Other Pacific Islander alone (%)
Races - Native Hawaiian and Other Pacific Islander alone (% change since 2000)
Races - Two or more races(%)
Races - Two or more races(% change since 2000)
Races - Other race alone (%)
Races - Other race alone (% change since 2000)
Racial diversity
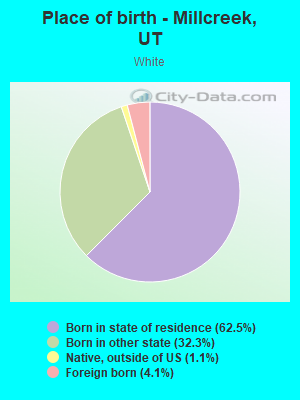
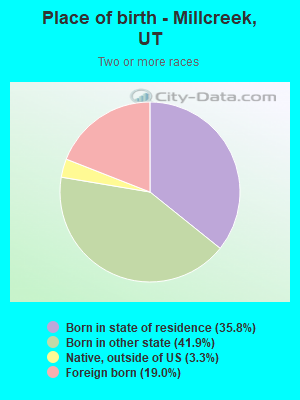
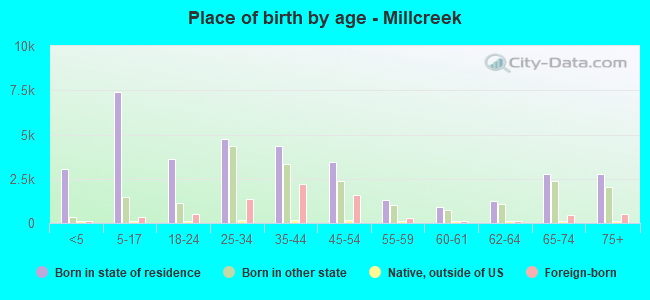
Place of birth - Born in state of residence (%)
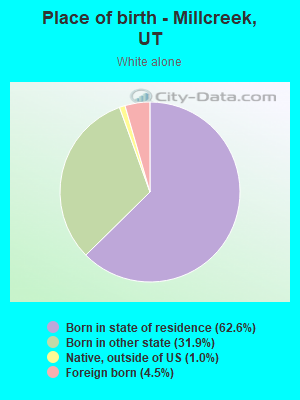
Place of birth - Born in state of residence (%) - White
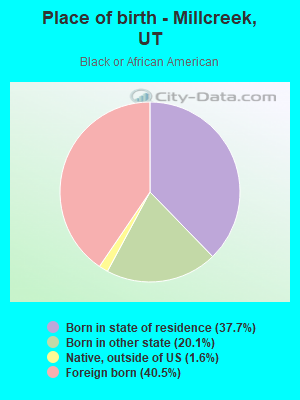
Place of birth - Born in state of residence (%) - Black or African American
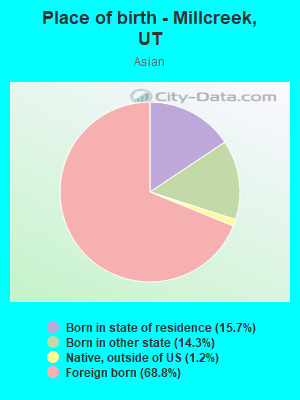
Place of birth - Born in state of residence (%) - Asian
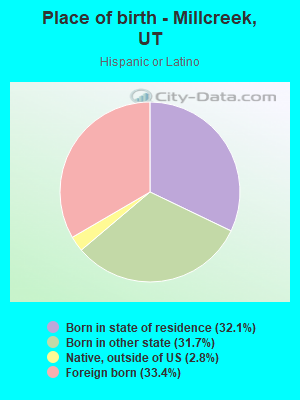
Place of birth - Born in state of residence (%) - Hispanic or Latino
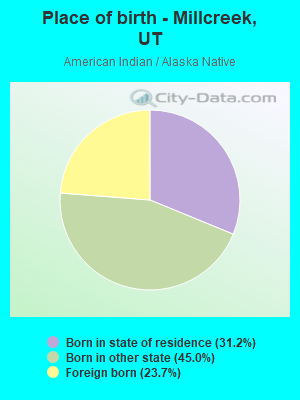
Place of birth - Born in state of residence (%) - American Indian and Alaska Native
Place of birth - Born in state of residence (%) - Multirace
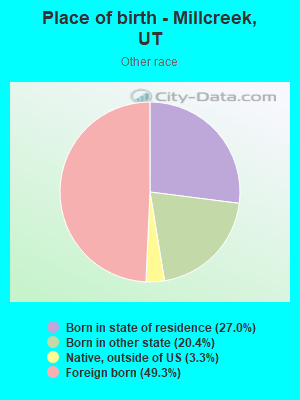
Place of birth - Born in state of residence (%) - Other Race
Place of birth - Born in other state (%)
Place of birth - Born in other state (%) - White
Place of birth - Born in other state (%) - Black or African American
Place of birth - Born in other state (%) - Asian
Place of birth - Born in other state (%) - Hispanic or Latino
Place of birth - Born in other state (%) - American Indian and Alaska Native
Place of birth - Born in other state (%) - Multirace
Place of birth - Born in other state (%) - Other Race
Place of birth - Native, outside of US (%)
Place of birth - Native, outside of US (%) - White
Place of birth - Native, outside of US (%) - Black or African American
Place of birth - Native, outside of US (%) - Asian
Place of birth - Native, outside of US (%) - Hispanic or Latino
Place of birth - Native, outside of US (%) - American Indian and Alaska Native
Place of birth - Native, outside of US (%) - Multirace
Place of birth - Native, outside of US (%) - Other Race
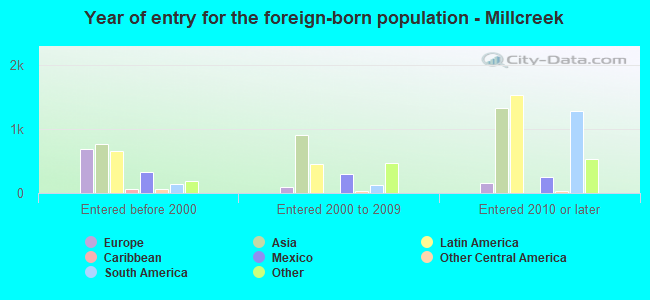
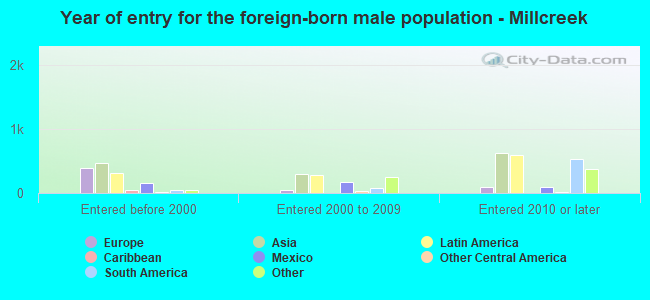
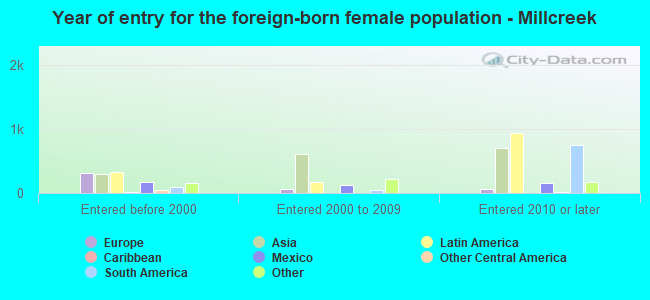
Place of birth - Foreign born (%)
Place of birth - Foreign born (%) - White
Place of birth - Foreign born (%) - Black or African American
Place of birth - Foreign born (%) - Asian
Place of birth - Foreign born (%) - Hispanic or Latino
Place of birth - Foreign born (%) - American Indian and Alaska Native
Place of birth - Foreign born (%) - Multirace
Place of birth - Foreign born (%) - Other Race
Residents speaking English at home (%)
Residents speaking English at home - Born in the United States (%)
Residents speaking English at home - Native, born elsewhere (%)
Residents speaking English at home - Foreign born (%)
Residents speaking Spanish at home (%)
Residents speaking Spanish at home - Born in the United States (%)
Residents speaking Spanish at home - Native, born elsewhere (%)
Residents speaking Spanish at home - Foreign born (%)
Residents speaking other language at home (%)
Residents speaking other language at home - Born in the United States (%)
Residents speaking other language at home - Native, born elsewhere (%)
Residents speaking other language at home - Foreign born (%)
Marital status - Never married (%)
Marital status - Now married (%)
Marital status - Separated (%)
Marital status - Widowed (%)
Marital status - Divorced (%)
Ancestries Reported - Arab (%)
Ancestries Reported - Czech (%)
Ancestries Reported - Danish (%)
Ancestries Reported - Dutch (%)
Ancestries Reported - English (%)
Ancestries Reported - French (%)
Ancestries Reported - French Canadian (%)
Ancestries Reported - German (%)
Ancestries Reported - Greek (%)
Ancestries Reported - Hungarian (%)
Ancestries Reported - Irish (%)
Ancestries Reported - Italian (%)
Ancestries Reported - Lithuanian (%)
Ancestries Reported - Norwegian (%)
Ancestries Reported - Polish (%)
Ancestries Reported - Portuguese (%)
Ancestries Reported - Russian (%)
Ancestries Reported - Scotch-Irish (%)
Ancestries Reported - Scottish (%)
Ancestries Reported - Slovak (%)
Ancestries Reported - Subsaharan African (%)
Ancestries Reported - Swedish (%)
Ancestries Reported - Swiss (%)
Ancestries Reported - Ukrainian (%)
Ancestries Reported - United States (%)
Ancestries Reported - Welsh (%)
Ancestries Reported - West Indian (%)
Ancestries Reported - Other (%)
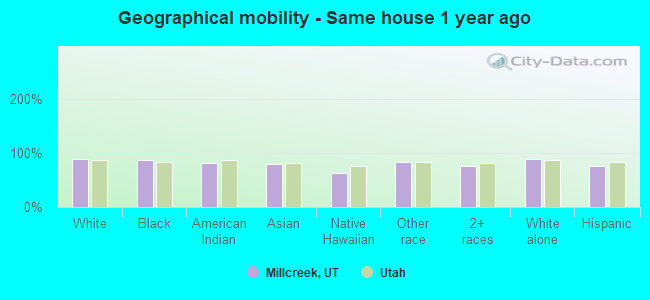
Geographical mobility - Same house 1 year ago (%)
Geographical mobility - Same house 1 year ago (%) - White
Geographical mobility - Same house 1 year ago (%) - Black or African American
Geographical mobility - Same house 1 year ago (%) - Asian
Geographical mobility - Same house 1 year ago (%) - Hispanic or Latino
Geographical mobility - Same house 1 year ago (%) - American Indian and Alaska Native
Geographical mobility - Same house 1 year ago (%) - Multirace
Geographical mobility - Same house 1 year ago (%) - Other Race
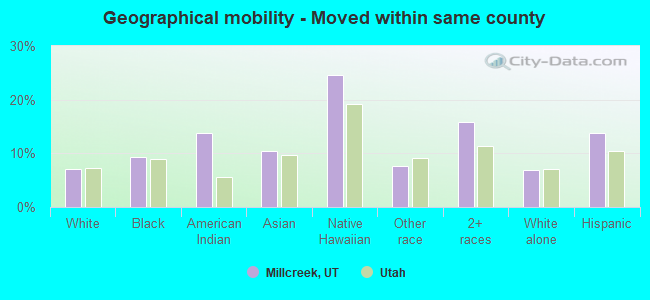
Geographical mobility - Moved within same county (%)
Geographical mobility - Moved within same county (%) - White
Geographical mobility - Moved within same county (%) - Black or African American
Geographical mobility - Moved within same county (%) - Asian
Geographical mobility - Moved within same county (%) - Hispanic or Latino
Geographical mobility - Moved within same county (%) - American Indian and Alaska Native
Geographical mobility - Moved within same county (%) - Multirace
Geographical mobility - Moved within same county (%) - Other Race
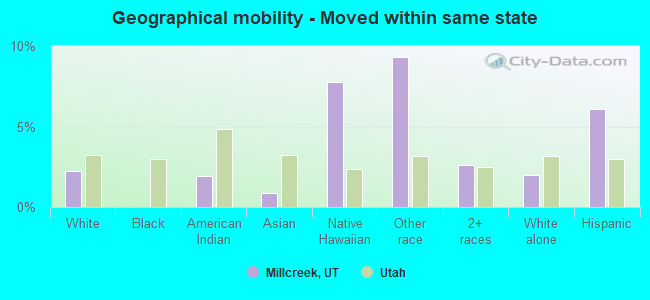
Geographical mobility - Moved from different county within same state (%)
Geographical mobility - Moved from different county within same state (%) - White
Geographical mobility - Moved from different county within same state (%) - Black or African American
Geographical mobility - Moved from different county within same state (%) - Asian
Geographical mobility - Moved from different county within same state (%) - Hispanic or Latino
Geographical mobility - Moved from different county within same state (%) - American Indian and Alaska Native
Geographical mobility - Moved from different county within same state (%) - Multirace
Geographical mobility - Moved from different county within same state (%) - Other Race
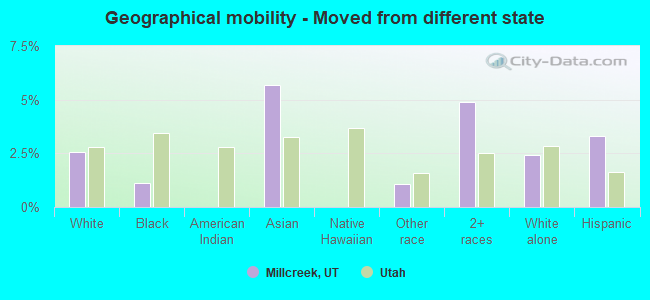
Geographical mobility - Moved from different state (%)
Geographical mobility - Moved from different state (%) - White
Geographical mobility - Moved from different state (%) - Black or African American
Geographical mobility - Moved from different state (%) - Asian
Geographical mobility - Moved from different state (%) - Hispanic or Latino
Geographical mobility - Moved from different state (%) - American Indian and Alaska Native
Geographical mobility - Moved from different state (%) - Multirace
Geographical mobility - Moved from different state (%) - Other Race
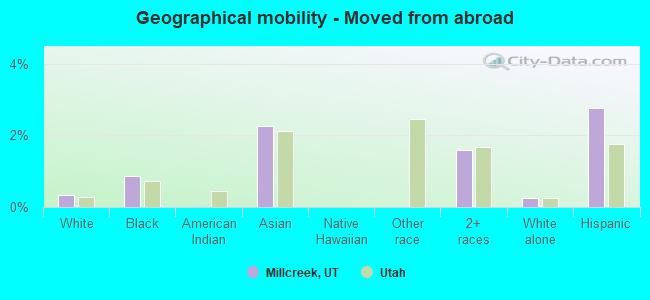
Geographical mobility - Moved from abroad (%)
Geographical mobility - Moved from abroad (%) - White
Geographical mobility - Moved from abroad (%) - Black or African American
Geographical mobility - Moved from abroad (%) - Asian
Geographical mobility - Moved from abroad (%) - Hispanic or Latino
Geographical mobility - Moved from abroad (%) - American Indian and Alaska Native
Geographical mobility - Moved from abroad (%) - Multirace
Geographical mobility - Moved from abroad (%) - Other Race
Place of birth for the foreign-born population - Ireland (%)
Place of birth for the foreign-born population - Denmark (%)
Place of birth for the foreign-born population - Norway (%)
Place of birth for the foreign-born population - Sweden (%)
Place of birth for the foreign-born population - United Kingdom (%)
Place of birth for the foreign-born population - England (%)
Place of birth for the foreign-born population - Scotland (%)
Place of birth for the foreign-born population - Other Northern Europe (%)
Place of birth for the foreign-born population - Austria (%)
Place of birth for the foreign-born population - Belgium (%)
Place of birth for the foreign-born population - France (%)
Place of birth for the foreign-born population - Germany (%)
Place of birth for the foreign-born population - Netherlands (%)
Place of birth for the foreign-born population - Switzerland (%)
Place of birth for the foreign-born population - Other Western Europe (%)
Place of birth for the foreign-born population - Greece (%)
Place of birth for the foreign-born population - Italy (%)
Place of birth for the foreign-born population - Portugal (%)
Place of birth for the foreign-born population - Spain (%)
Place of birth for the foreign-born population - Other Southern Europe (%)
Place of birth for the foreign-born population - Albania (%)
Place of birth for the foreign-born population - Belarus (%)
Place of birth for the foreign-born population - Bosnia and Herzegovina (%)
Place of birth for the foreign-born population - Bulgaria (%)
Place of birth for the foreign-born population - Croatia (%)
Place of birth for the foreign-born population - Czechoslovakia (%)
Place of birth for the foreign-born population - Hungary (%)
Place of birth for the foreign-born population - Latvia (%)
Place of birth for the foreign-born population - Lithuania (%)
Place of birth for the foreign-born population - North Macedonia (Macedonia) (%)
Place of birth for the foreign-born population - Moldova (%)
Place of birth for the foreign-born population - Poland (%)
Place of birth for the foreign-born population - Romania (%)
Place of birth for the foreign-born population - Russia (%)
Place of birth for the foreign-born population - Serbia (%)
Place of birth for the foreign-born population - Ukraine (%)
Place of birth for the foreign-born population - Other Eastern Europe (%)
Place of birth for the foreign-born population - China (%)
Place of birth for the foreign-born population - Hong Kong (%)
Place of birth for the foreign-born population - Taiwan (%)
Place of birth for the foreign-born population - Japan (%)
Place of birth for the foreign-born population - Korea (%)
Place of birth for the foreign-born population - Other Eastern Asia (%)
Place of birth for the foreign-born population - Afghanistan (%)
Place of birth for the foreign-born population - Bangladesh (%)
Place of birth for the foreign-born population - India (%)
Place of birth for the foreign-born population - Iran (%)
Place of birth for the foreign-born population - Kazakhstan (%)
Place of birth for the foreign-born population - Nepal (%)
Place of birth for the foreign-born population - Pakistan (%)
Place of birth for the foreign-born population - Sri Lanka (%)
Place of birth for the foreign-born population - Uzbekistan (%)
Place of birth for the foreign-born population - Other South Central Asia (%)
Place of birth for the foreign-born population - Burma (%)
Place of birth for the foreign-born population - Cambodia (%)
Place of birth for the foreign-born population - Indonesia (%)
Place of birth for the foreign-born population - Laos (%)
Place of birth for the foreign-born population - Malaysia (%)
Place of birth for the foreign-born population - Philippines (%)
Place of birth for the foreign-born population - Singapore (%)
Place of birth for the foreign-born population - Thailand (%)
Place of birth for the foreign-born population - Vietnam (%)
Place of birth for the foreign-born population - Other South Eastern Asia (%)
Place of birth for the foreign-born population - Armenia (%)
Place of birth for the foreign-born population - Iraq (%)
Place of birth for the foreign-born population - Israel (%)
Place of birth for the foreign-born population - Jordan (%)
Place of birth for the foreign-born population - Kuwait (%)
Place of birth for the foreign-born population - Lebanon (%)
Place of birth for the foreign-born population - Saudi Arabia (%)
Place of birth for the foreign-born population - Syria (%)
Place of birth for the foreign-born population - Turkey (%)
Place of birth for the foreign-born population - Yemen (%)
Place of birth for the foreign-born population - Other Western Asia (%)
Place of birth for the foreign-born population - Eritrea (%)
Place of birth for the foreign-born population - Ethiopia (%)
Place of birth for the foreign-born population - Kenya (%)
Place of birth for the foreign-born population - Somalia (%)
Place of birth for the foreign-born population - Uganda (%)
Place of birth for the foreign-born population - Zimbabwe (%)
Place of birth for the foreign-born population - Other Eastern Africa (%)
Place of birth for the foreign-born population - Cameroon (%)
Place of birth for the foreign-born population - Congo (%)
Place of birth for the foreign-born population - Democratic Republic of Congo (Zaire) (%)
Place of birth for the foreign-born population - Other Middle Africa (%)
Place of birth for the foreign-born population - Egypt (%)
Place of birth for the foreign-born population - Morocco (%)
Place of birth for the foreign-born population - Sudan (%)
Place of birth for the foreign-born population - Other Northern Africa (%)
Place of birth for the foreign-born population - South Africa (%)
Place of birth for the foreign-born population - Other Southern Africa (%)
Place of birth for the foreign-born population - Cabo Verde (%)
Place of birth for the foreign-born population - Ghana (%)
Place of birth for the foreign-born population - Liberia (%)
Place of birth for the foreign-born population - Nigeria (%)
Place of birth for the foreign-born population - Senegal (%)
Place of birth for the foreign-born population - Sierra Leone (%)
Place of birth for the foreign-born population - Other Western Africa (%)
Place of birth for the foreign-born population - Australia (%)
Place of birth for the foreign-born population - New Zealand (%)
Place of birth for the foreign-born population - Fiji (%)
Place of birth for the foreign-born population - Micronesia (%)
Place of birth for the foreign-born population - Bahamas (%)
Place of birth for the foreign-born population - Barbados (%)
Place of birth for the foreign-born population - Cuba (%)
Place of birth for the foreign-born population - Dominica (%)
Place of birth for the foreign-born population - Dominican Republic (%)
Place of birth for the foreign-born population - Grenada (%)
Place of birth for the foreign-born population - Haiti (%)
Place of birth for the foreign-born population - Jamaica (%)
Place of birth for the foreign-born population - St. Vincent and the Grenadines (%)
Place of birth for the foreign-born population - Trinidad and Tobago (%)
Place of birth for the foreign-born population - West Indies (%)
Place of birth for the foreign-born population - Other Caribbean (%)
Place of birth for the foreign-born population - Belize (%)
Place of birth for the foreign-born population - Costa Rica (%)
Place of birth for the foreign-born population - El Salvador (%)
Place of birth for the foreign-born population - Guatemala (%)
Place of birth for the foreign-born population - Honduras (%)
Place of birth for the foreign-born population - Mexico (%)
Place of birth for the foreign-born population - Nicaragua (%)
Place of birth for the foreign-born population - Panama (%)
Place of birth for the foreign-born population - Other Central America (%)
Place of birth for the foreign-born population - Argentina (%)
Place of birth for the foreign-born population - Bolivia (%)
Place of birth for the foreign-born population - Brazil (%)
Place of birth for the foreign-born population - Chile (%)
Place of birth for the foreign-born population - Colombia (%)
Place of birth for the foreign-born population - Ecuador (%)
Place of birth for the foreign-born population - Guyana (%)
Place of birth for the foreign-born population - Peru (%)
Place of birth for the foreign-born population - Uruguay (%)
Place of birth for the foreign-born population - Venezuela (%)
Place of birth for the foreign-born population - Other South America (%)
Place of birth for the foreign-born population - Canada (%)
Place of birth for the foreign-born population - Other Northern America (%)
Place of birth for the foreign-born population - Other (%)
Latest news about races in Millcreek, UT collected exclusively by city-data.com from local newspapers, TV, and radio stations
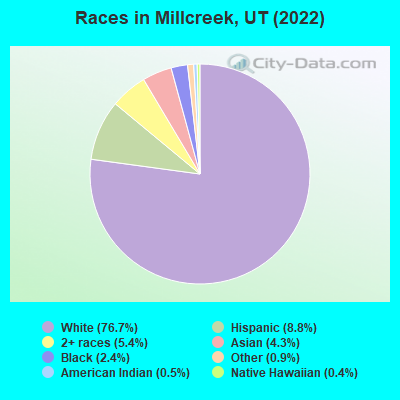
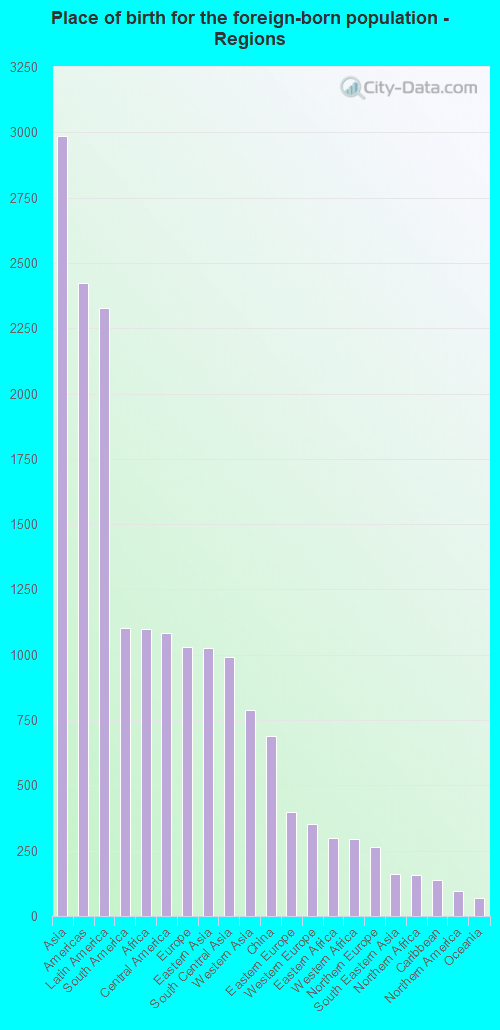
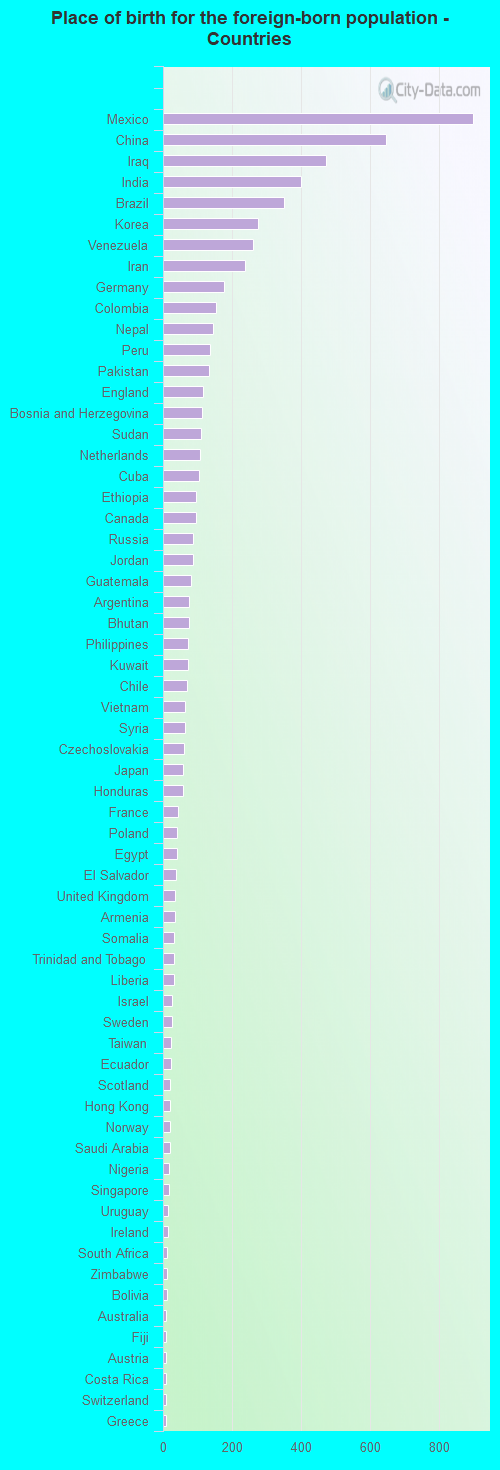
According to 2022 data, the most numerous races in Millcreek, UT are White alone (48,933 residents), Hispanic (5,640 residents), and Two or more races (3,439 residents). 82.4% of Millcreek residents speak English at home. 11.9% of Millcreek, UT residents are foreign-born (4.4% born in Asia, 3.5% born in Latin America, 1.6% born in Africa, 1.5% born in Europe), which is 32.9% greater than the foreign-born rate of 8.0% across the entire state of Utah.
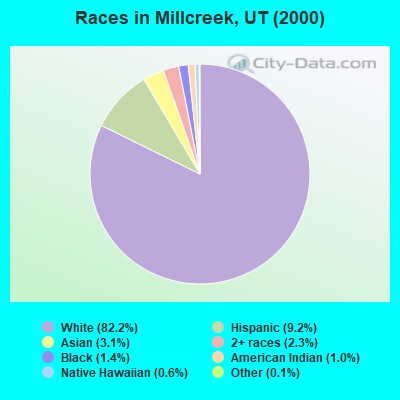
Race distribution in Millcreek
2000 2022
1,904,265 85.3% White alone 201,559 9.0% Hispanic 36,483 1.6% Asian alone 31,308 1.4% Two or more races 26,663 1.2% American Indian alone 14,806 0.7% Native Hawaiian and Other 16,137 0.7% Black alone 1,948 0.09% Other race alone
2,557,466 75.6% White alone 512,086 15.1% Hispanic 119,308 3.5% Two or more races 82,388 2.4% Asian alone 36,978 1.1% Native Hawaiian and Other 34,873 1.0% Black alone 22,803 0.7% American Indian alone 14,898 0.4% Other race alone
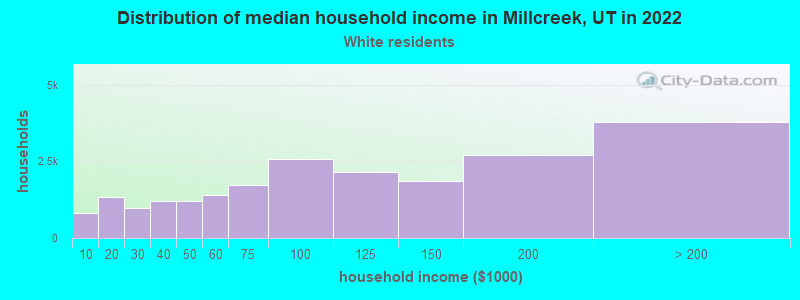
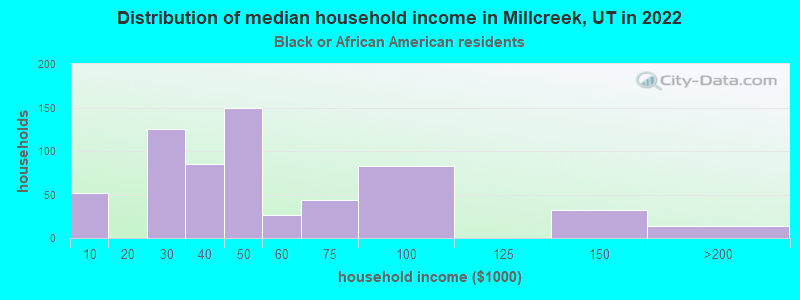
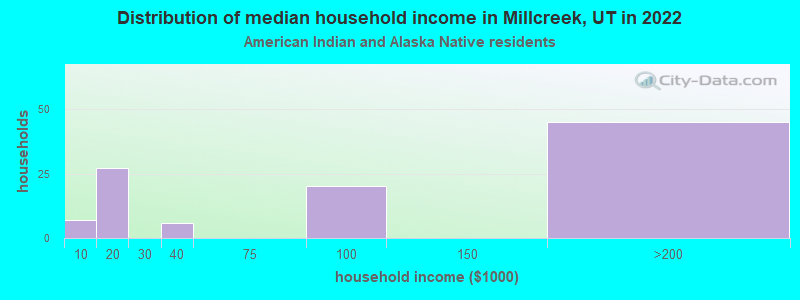
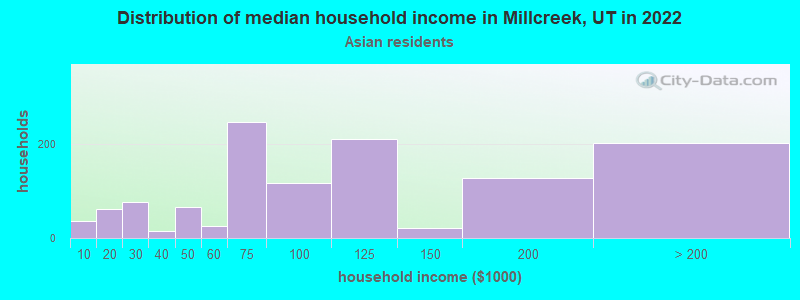
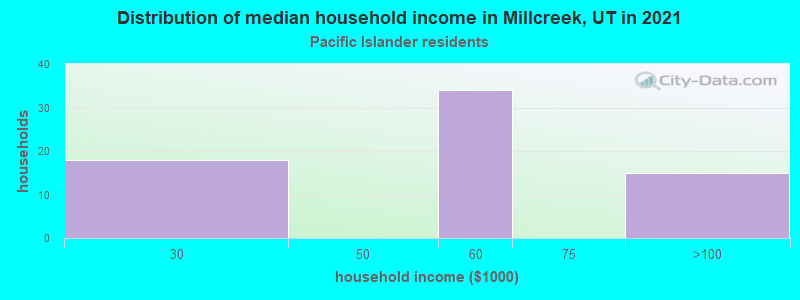
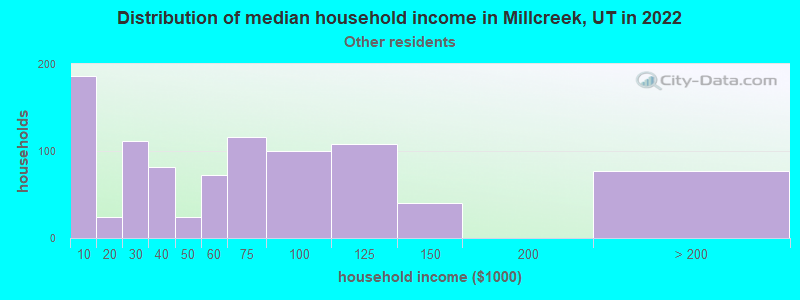
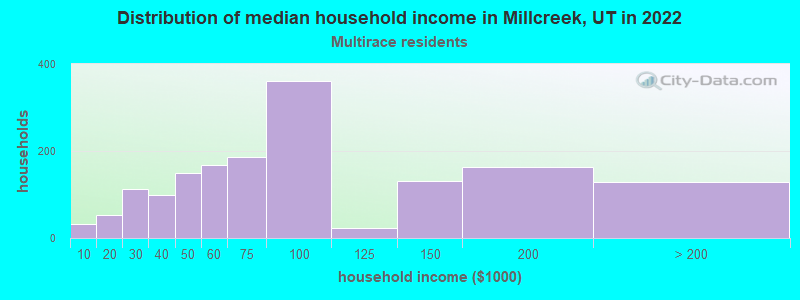
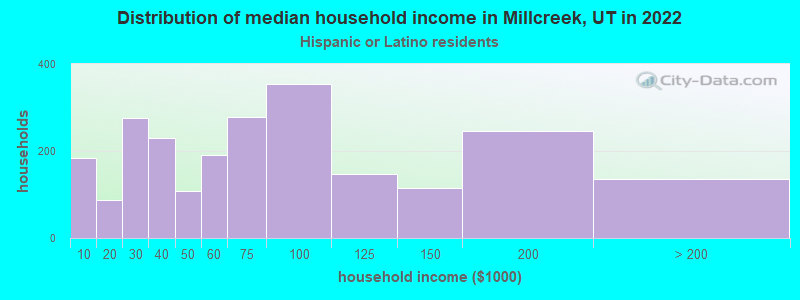
Income and house value in Millcreek Median household income in 2022 $94,848 White non-Hispanic householders$56,264 Black householders$92,336 Asian householders$98,525 Native Hawaiian and other Pacific Islander householders$63,577 Some other race householders$72,932 Two or more races householders$62,644 Hispanic or Latino race householdersMedian 2022 house value $653,402 White Non-Hispanic householders$338,860 American Indian or Alaska Native householders $637,456 Asian householders$548,156 Native Hawaiian and other Pacific Islander householders$809,677 Some other race householders$682,903 Two or more races householders$597,988 Hispanic or Latino householders
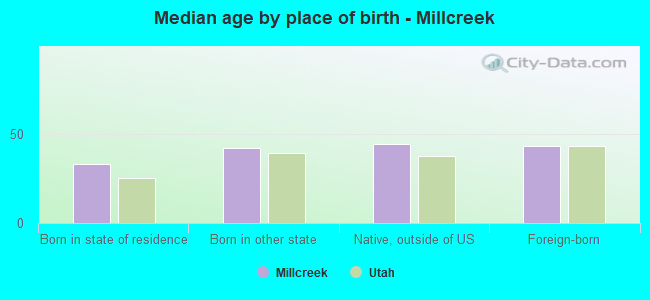
Median age by race in Millcreek
40.4 Median age for White residents39.2 41.7 24.2 Median age for Black or African American residents21.9 27.9 37.7 Median age for American Indian / Alaska Native residents38.8 35.0 41.1 Median age for Asian residents37.0 45.1 49.6 Median age for Native Hawaiian / Pacific Islander residents17.8 60.8 29.8 Median age for Other race residents31.6 27.5 29.0 Median age for Two or more races residents31.0 28.4 40.8 Median age for White alone residents39.4 42.3 31.8 Median age for Hispanic or Latino residents31.3 33.9
Owner/renter occupied households by race in Millcreek
House owners and renters - White residents 14,601 67.2% Owner occupied7,131 32.8% Renter occupiedHouse owners and renters - Black or African American residents 27 4.7% Owner occupied553 95.3% Renter occupiedHouse owners and renters - American Indian / Alaska Native residents 34 29.2% Owner occupied83 70.8% Renter occupiedHouse owners and renters - Asian residents 710 60.0% Owner occupied473 40.0% Renter occupiedHouse owners and renters - Native Hawaiian / Pacific Islander residents 70 100.0% Owner occupiedHouse owners and renters - Other race residents 252 28.0% Owner occupied648 72.0% Renter occupiedHouse owners and renters - Two or more races residents 609 36.9% Owner occupied1,040 63.1% Renter occupiedHouse owners and renters - White alone residents 14,386 67.6% Owner occupied6,890 32.4% Renter occupiedHouse owners and renters - Hispanic or Latino residents 725 30.9% Owner occupied1,625 69.1% Renter occupied
Language usage in Millcreek
English speakers - Total 82.4% of residents of Millcreek speak English at home.
6.1% of residents speak Spanish at home 2,453 66.7% Speak English very well1,223 33.3% Speak English less than very well11.5% of residents speak other language at home 4,938 71.0% Speak English very well2,019 29.0% Speak English less than very well
English speakers - Born in the United States 93.1% of residents of Millcreek speak English at home.
4.6% of residents speak Spanish at home 833 92.7% Speak English very well66 7.3% Speak English less than very well2.1% of residents speak other language at home 371 90.9% Speak English very well37 9.1% Speak English less than very well
English speakers - Native, born elsewhere 42.1% of residents of Millcreek speak English at home.
19.4% of residents speak Spanish at home 134 73.2% Speak English very well49 26.8% Speak English less than very well46.9% of residents speak other language at home 427 96.6% Speak English very well15 3.4% Speak English less than very well
English speakers - Foreign-born 16.1% of residents of Millcreek speak English at home.
23.5% of residents speak Spanish at home 783 44.7% Speak English very well969 55.3% Speak English less than very well60.3% of residents speak other language at home 2,708 60.2% Speak English very well1,789 39.8% Speak English less than very well
White (Caucasian) - Speak only English Native:
96.1% (43,334)Foreign-born:
27.7% (555)
White (Caucasian) - Speak another language Native:
4.0% (1,801)Foreign-born:
70.9% (1,422)
Black or African American - Speak only English Native:
72.4% (437)Foreign-born:
6.1% (36)
Black or African American - Speak another language Native:
24.0% (145)Foreign-born:
88.5% (529)
American Indian / Alaska Native - Speak another language Native:
41.8% (158)Foreign-born:
94.0% (110)
Asian - Speak only English Native:
51.2% (458)Foreign-born:
15.4% (293)
Asian - Speak another language Native:
49.0% (439)Foreign-born:
84.7% (1,617)
Native Hawaiian / Pacific Islander - Speak only English Native:
75.8% (171)Foreign-born:
59.1% (30)
Native Hawaiian / Pacific Islander - Speak another language Native:
16.4% (37)Foreign-born:
16.0% (8)
Other race - Speak only English Native:
33.8% (390)Foreign-born:
8.7% (102)
Other race - Speak another language Native:
64.7% (746)Foreign-born:
91.3% (1,073)
Two or more races - Speak only English Native:
83.4% (3,545)Foreign-born:
10.4% (123)
Two or more races - Speak another language Native:
16.6% (706)Foreign-born:
88.4% (1,050)
White alone - Speak only English Native:
96.0% (42,779)Foreign-born:
23.7% (521)
White alone - Speak another language Native:
4.0% (1,764)Foreign-born:
78.2% (1,720)
Hispanic or Latino - Speak only English Native:
59.9% (2,036)Foreign-born:
9.4% (176)
Hispanic or Latino - Speak another language Native:
40.6% (1,379)Foreign-born:
90.9% (1,695)
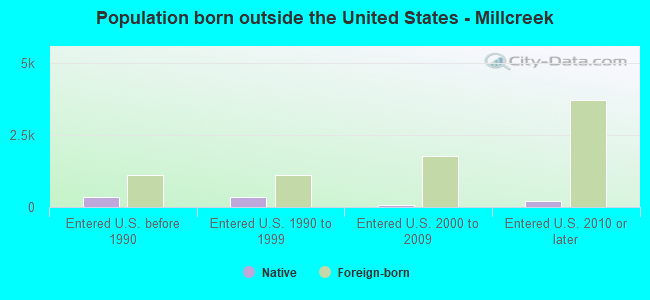
Foreign-born residents in Millcreek 7,609 residents are foreign born (4.4% Asia , 3.5% Latin America , 1.6% Africa , 1.5% Europe ).
Marital status for residents in Millcreek Marital status - White (Caucasian) population 15 years and over
Males 34.8% Never married51.8% Now married1.1% Separated2.6% Widowed9.7% DivorcedFemales 26.7% Never married48.3% Now married2.0% Separated8.5% Widowed14.5% DivorcedWomen who gave birth in the past 12 months Now married:
91.5% (534)Unmarried:
8.5% (49)
Women who did not give birth in the past 12 months Now married:
45.3% (5,017)Unmarried:
54.7% (6,065)
Marital status - Black or African American population 15 years and over
Males 38.7% Never married58.3% Now married0.0% Separated0.0% Widowed2.9% DivorcedFemales 50.5% Never married43.6% Now married3.7% Separated2.2% Widowed0.0% DivorcedWomen who gave birth in the past 12 months Now married:
61.5% (76)Unmarried:
38.5% (47)
Women who did not give birth in the past 12 months Now married:
42.5% (118)Unmarried:
57.5% (160)
Marital status - American Indian / Alaska Native population 15 years and over
Males 34.1% Never married43.8% Now married14.6% Separated0.0% Widowed7.6% DivorcedFemales 17.3% Never married68.3% Now married1.0% Separated0.5% Widowed13.0% DivorcedWomen who did not give birth in the past 12 months Now married:
73.5% (134)Unmarried:
26.5% (48)
Marital status - Asian population 15 years and over
Males 37.1% Never married54.7% Now married4.1% Separated1.8% Widowed2.3% DivorcedFemales 26.8% Never married61.3% Now married0.8% Separated2.8% Widowed8.5% DivorcedWomen who did not give birth in the past 12 months Now married:
55.3% (450)Unmarried:
44.7% (364)
Marital status - Native Hawaiian / Pacific Islander population 15 years and over
Males 63.2% Never married36.8% Now married0.0% Separated0.0% Widowed0.0% DivorcedFemales 41.5% Never married40.8% Now married0.0% Separated10.2% Widowed7.5% DivorcedWomen who gave birth in the past 12 months Now married:
100.0% (8)Unmarried:
0.0% (0)
Women who did not give birth in the past 12 months Now married:
0.0% (0)Unmarried:
100.0% (70)
Marital status - Other race population 15 years and over
Males 32.3% Never married50.6% Now married0.5% Separated0.0% Widowed16.6% DivorcedFemales 43.5% Never married37.8% Now married4.5% Separated0.0% Widowed14.2% DivorcedWomen who did not give birth in the past 12 months Now married:
40.0% (392)Unmarried:
60.0% (588)
Marital status - Two or more races population 15 years and over
Males 43.1% Never married50.4% Now married0.0% Separated1.3% Widowed5.2% DivorcedFemales 41.9% Never married45.9% Now married2.6% Separated3.2% Widowed6.4% DivorcedWomen who gave birth in the past 12 months Now married:
87.7% (75)Unmarried:
12.3% (11)
Women who did not give birth in the past 12 months Now married:
43.2% (691)Unmarried:
56.8% (908)
Marital status - White alone, not Hispanic / Latino population 15 years and over
Males 34.8% Never married52.3% Now married1.0% Separated2.7% Widowed9.3% DivorcedFemales 26.8% Never married48.2% Now married1.7% Separated8.8% Widowed14.6% DivorcedWomen who gave birth in the past 12 months Now married:
90.8% (502)Unmarried:
9.2% (51)
Women who did not give birth in the past 12 months Now married:
44.5% (4,784)Unmarried:
55.5% (5,959)
Marital status - Hispanic or Latino population 15 years and over
Males 33.1% Never married46.4% Now married1.5% Separated1.2% Widowed17.7% DivorcedFemales 31.2% Never married45.9% Now married7.3% Separated1.8% Widowed13.8% DivorcedWomen who gave birth in the past 12 months Now married:
89.9% (74)Unmarried:
10.1% (8)
Women who did not give birth in the past 12 months Now married:
49.0% (933)Unmarried:
51.0% (973)
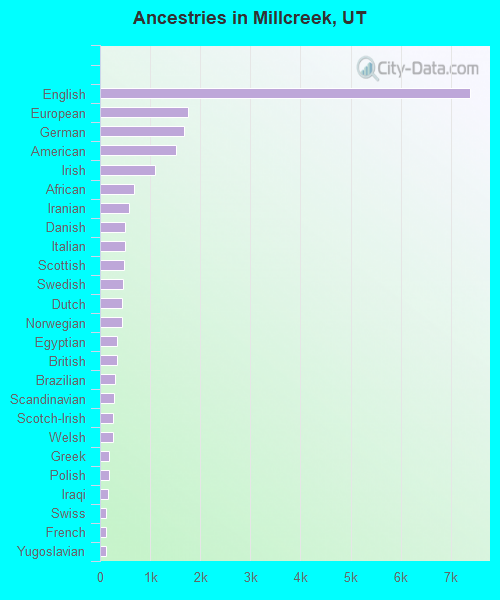
Ancestries in Millcreek
7,393 23.3% English1,752 5.5% European1,667 5.2% German1,516 4.8% American1,092 3.4% Irish671 2.1% African585 1.8% Iranian507 1.6% Danish500 1.6% Italian480 1.5% Scottish454 1.4% Swedish447 1.4% Dutch443 1.4% Norwegian348 1.1% Egyptian339 1.1% British304 1.0% Brazilian275 0.9% Scandinavian269 0.8% Scotch-Irish263 0.8% Welsh182 0.6% Greek173 0.5% Polish153 0.5% Iraqi127 0.4% Swiss124 0.4% French119 0.4% Yugoslavian116 0.4% Northern European107 0.3% Icelander94 0.3% Armenian72 0.2% Jordanian71 0.2% Portuguese71 0.2% Eastern European64 0.2% Syrian60 0.2% Finnish56 0.2% Ethiopian54 0.2% Ukrainian50 0.2% Russian46 0.1% Hungarian46 0.1% Sudanese44 0.1% Haitian43 0.1% Czech38 0.1% Lebanese38 0.1% Cajun33 0.1% Kenyan28 0.09% Liberian27 0.08% Slavic25 0.08% Nigerian24 0.08% French Canadian23 0.07% Cypriot20 0.06% Palestinian17 0.05% Albanian17 0.05% Austrian11 0.03% Latvian9 0.03% Celtic9 0.03% Arab8 0.03% New Zealander8 0.03% Lithuanian7 0.02% Slovak7 0.02% Czechoslovakian6 0.02% Croatian4 0.01% Canadian4 0.01% Turkish2 0.01% Basque
Geographical mobility in Millcreek Same house 1 year ago 43,033 87.9% White (Caucasian)1,295 86.5% Black or African American339 80.3% American Indian / Alaska Native2,235 79.8% Asian165 62.8% Native Hawaiian / Pacific Islander2,010 83.2% Other race4,608 75.2% Two or more races42,921 88.5% White alone, not Hispanic / Latino4,184 75.3% Hispanic or LatinoMoved within same county 3,437 7.0% White / Caucasian140 9.3% Black or African American58 13.8% American Indian / Alaska Native291 10.4% Asian65 24.5% Native Hawaiian / Pacific Islander184 7.6% Other race976 15.9% Two or more races3,363 6.9% White alone, not Hispanic / Latino766 13.8% Hispanic or LatinoMoved within same state 1,106 2.3% White / Caucasian8 1.9% American Indian / Alaska Native25 0.9% Asian21 7.8% Native Hawaiian / Pacific Islander225 9.3% Other race158 2.6% Two or more races976 2.0% White alone, not Hispanic / Latino340 6.1% Hispanic or LatinoMoved from different state 1,265 2.6% White / Caucasian17 1.1% Black or African American159 5.7% Asian26 1.1% Other race299 4.9% Two or more races1,168 2.4% White alone, not Hispanic / Latino185 3.3% Hispanic or LatinoMoved from abroad 159 0.3% White13 0.9% Black or African American63 2.3% Asian97 1.6% Two or more races123 0.3% White alone, not Hispanic / Latino154 2.8% Hispanic or Latino
Children Nativity (place of birth) in Millcreek
Children under 6 years - Living with two parents Both parents native 2,452 100.0% NativeBoth parents foreign-born 278 72.8% Native104 27.2% Foreign-bornOne native, one foreign-born parent 279 100.0% NativeChildren under 6 years - Living with one parent Native parent 706 100.0% NativeForeign-born parent 218 89.3% Native26 10.7% Foreign-bornChildren 6 to 17 years - Living with two parents Both parents native 5,023 100.0% NativeBoth parents foreign-born 677 75.9% Native215 24.1% Foreign-bornOne native, one foreign-born parent 401 94.4% Native24 5.6% Foreign-bornChildren 6 to 17 years - Living with one parent Native parent 1,939 100.0% NativeForeign-born parent 117 51.5% Native110 48.5% Foreign-born
Grandparents responsible for own grandchildren in Millcreek
Grandparents (30 to 59 years) White / Caucasian 24 14.1% Responsible for grandchildren144 85.9% Not responsible for grandchildrenOther race 12 100.0% Not responsible for grandchildrenTwo or more races 7 100.0% Responsible for grandchildrenWhite alone, not Hispanic / Latino 29 18.5% Responsible for grandchildren127 81.5% Not responsible for grandchildrenHispanic or Latino 33 100.0% Not responsible for grandchildrenGrandparents (60 years and over) White / Caucasian 80 23.7% Responsible for grandchildren257 76.3% Not responsible for grandchildrenTwo or more races 9 100.0% Responsible for grandchildrenWhite alone, not Hispanic / Latino 80 22.8% Responsible for grandchildren273 77.2% Not responsible for grandchildren