Races in Milpitas, California (CA) Detailed Stats
Data:
Races - White alone (%)
Races - White alone (% change since 2000)
Races - Black alone (%)
Races - Black alone (% change since 2000)
Races - American Indian alone (%)
Races - American Indian alone (% change since 2000)
Races - Asian alone (%)
Races - Asian alone (% change since 2000)
Races - Hispanic (%)
Races - Hispanic (% change since 2000)
Races - Native Hawaiian and Other Pacific Islander alone (%)
Races - Native Hawaiian and Other Pacific Islander alone (% change since 2000)
Races - Two or more races(%)
Races - Two or more races(% change since 2000)
Races - Other race alone (%)
Races - Other race alone (% change since 2000)
Racial diversity
Place of birth - Born in state of residence (%)
Place of birth - Born in state of residence (%) - White
Place of birth - Born in state of residence (%) - Black or African American
Place of birth - Born in state of residence (%) - Asian
Place of birth - Born in state of residence (%) - Hispanic or Latino
Place of birth - Born in state of residence (%) - American Indian and Alaska Native
Place of birth - Born in state of residence (%) - Multirace
Place of birth - Born in state of residence (%) - Other Race
Place of birth - Born in other state (%)
Place of birth - Born in other state (%) - White
Place of birth - Born in other state (%) - Black or African American
Place of birth - Born in other state (%) - Asian
Place of birth - Born in other state (%) - Hispanic or Latino
Place of birth - Born in other state (%) - American Indian and Alaska Native
Place of birth - Born in other state (%) - Multirace
Place of birth - Born in other state (%) - Other Race
Place of birth - Native, outside of US (%)
Place of birth - Native, outside of US (%) - White
Place of birth - Native, outside of US (%) - Black or African American
Place of birth - Native, outside of US (%) - Asian
Place of birth - Native, outside of US (%) - Hispanic or Latino
Place of birth - Native, outside of US (%) - American Indian and Alaska Native
Place of birth - Native, outside of US (%) - Multirace
Place of birth - Native, outside of US (%) - Other Race
Place of birth - Foreign born (%)
Place of birth - Foreign born (%) - White
Place of birth - Foreign born (%) - Black or African American
Place of birth - Foreign born (%) - Asian
Place of birth - Foreign born (%) - Hispanic or Latino
Place of birth - Foreign born (%) - American Indian and Alaska Native
Place of birth - Foreign born (%) - Multirace
Place of birth - Foreign born (%) - Other Race
Residents speaking English at home (%)
Residents speaking English at home - Born in the United States (%)
Residents speaking English at home - Native, born elsewhere (%)
Residents speaking English at home - Foreign born (%)
Residents speaking Spanish at home (%)
Residents speaking Spanish at home - Born in the United States (%)
Residents speaking Spanish at home - Native, born elsewhere (%)
Residents speaking Spanish at home - Foreign born (%)
Residents speaking other language at home (%)
Residents speaking other language at home - Born in the United States (%)
Residents speaking other language at home - Native, born elsewhere (%)
Residents speaking other language at home - Foreign born (%)
Marital status - Never married (%)
Marital status - Now married (%)
Marital status - Separated (%)
Marital status - Widowed (%)
Marital status - Divorced (%)
Ancestries Reported - Arab (%)
Ancestries Reported - Czech (%)
Ancestries Reported - Danish (%)
Ancestries Reported - Dutch (%)
Ancestries Reported - English (%)
Ancestries Reported - French (%)
Ancestries Reported - French Canadian (%)
Ancestries Reported - German (%)
Ancestries Reported - Greek (%)
Ancestries Reported - Hungarian (%)
Ancestries Reported - Irish (%)
Ancestries Reported - Italian (%)
Ancestries Reported - Lithuanian (%)
Ancestries Reported - Norwegian (%)
Ancestries Reported - Polish (%)
Ancestries Reported - Portuguese (%)
Ancestries Reported - Russian (%)
Ancestries Reported - Scotch-Irish (%)
Ancestries Reported - Scottish (%)
Ancestries Reported - Slovak (%)
Ancestries Reported - Subsaharan African (%)
Ancestries Reported - Swedish (%)
Ancestries Reported - Swiss (%)
Ancestries Reported - Ukrainian (%)
Ancestries Reported - United States (%)
Ancestries Reported - Welsh (%)
Ancestries Reported - West Indian (%)
Ancestries Reported - Other (%)
Geographical mobility - Same house 1 year ago (%)
Geographical mobility - Same house 1 year ago (%) - White
Geographical mobility - Same house 1 year ago (%) - Black or African American
Geographical mobility - Same house 1 year ago (%) - Asian
Geographical mobility - Same house 1 year ago (%) - Hispanic or Latino
Geographical mobility - Same house 1 year ago (%) - American Indian and Alaska Native
Geographical mobility - Same house 1 year ago (%) - Multirace
Geographical mobility - Same house 1 year ago (%) - Other Race
Geographical mobility - Moved within same county (%)
Geographical mobility - Moved within same county (%) - White
Geographical mobility - Moved within same county (%) - Black or African American
Geographical mobility - Moved within same county (%) - Asian
Geographical mobility - Moved within same county (%) - Hispanic or Latino
Geographical mobility - Moved within same county (%) - American Indian and Alaska Native
Geographical mobility - Moved within same county (%) - Multirace
Geographical mobility - Moved within same county (%) - Other Race
Geographical mobility - Moved from different county within same state (%)
Geographical mobility - Moved from different county within same state (%) - White
Geographical mobility - Moved from different county within same state (%) - Black or African American
Geographical mobility - Moved from different county within same state (%) - Asian
Geographical mobility - Moved from different county within same state (%) - Hispanic or Latino
Geographical mobility - Moved from different county within same state (%) - American Indian and Alaska Native
Geographical mobility - Moved from different county within same state (%) - Multirace
Geographical mobility - Moved from different county within same state (%) - Other Race
Geographical mobility - Moved from different state (%)
Geographical mobility - Moved from different state (%) - White
Geographical mobility - Moved from different state (%) - Black or African American
Geographical mobility - Moved from different state (%) - Asian
Geographical mobility - Moved from different state (%) - Hispanic or Latino
Geographical mobility - Moved from different state (%) - American Indian and Alaska Native
Geographical mobility - Moved from different state (%) - Multirace
Geographical mobility - Moved from different state (%) - Other Race
Geographical mobility - Moved from abroad (%)
Geographical mobility - Moved from abroad (%) - White
Geographical mobility - Moved from abroad (%) - Black or African American
Geographical mobility - Moved from abroad (%) - Asian
Geographical mobility - Moved from abroad (%) - Hispanic or Latino
Geographical mobility - Moved from abroad (%) - American Indian and Alaska Native
Geographical mobility - Moved from abroad (%) - Multirace
Geographical mobility - Moved from abroad (%) - Other Race
Place of birth for the foreign-born population - Ireland (%)
Place of birth for the foreign-born population - Denmark (%)
Place of birth for the foreign-born population - Norway (%)
Place of birth for the foreign-born population - Sweden (%)
Place of birth for the foreign-born population - United Kingdom (%)
Place of birth for the foreign-born population - England (%)
Place of birth for the foreign-born population - Scotland (%)
Place of birth for the foreign-born population - Other Northern Europe (%)
Place of birth for the foreign-born population - Austria (%)
Place of birth for the foreign-born population - Belgium (%)
Place of birth for the foreign-born population - France (%)
Place of birth for the foreign-born population - Germany (%)
Place of birth for the foreign-born population - Netherlands (%)
Place of birth for the foreign-born population - Switzerland (%)
Place of birth for the foreign-born population - Other Western Europe (%)
Place of birth for the foreign-born population - Greece (%)
Place of birth for the foreign-born population - Italy (%)
Place of birth for the foreign-born population - Portugal (%)
Place of birth for the foreign-born population - Spain (%)
Place of birth for the foreign-born population - Other Southern Europe (%)
Place of birth for the foreign-born population - Albania (%)
Place of birth for the foreign-born population - Belarus (%)
Place of birth for the foreign-born population - Bosnia and Herzegovina (%)
Place of birth for the foreign-born population - Bulgaria (%)
Place of birth for the foreign-born population - Croatia (%)
Place of birth for the foreign-born population - Czechoslovakia (%)
Place of birth for the foreign-born population - Hungary (%)
Place of birth for the foreign-born population - Latvia (%)
Place of birth for the foreign-born population - Lithuania (%)
Place of birth for the foreign-born population - North Macedonia (Macedonia) (%)
Place of birth for the foreign-born population - Moldova (%)
Place of birth for the foreign-born population - Poland (%)
Place of birth for the foreign-born population - Romania (%)
Place of birth for the foreign-born population - Russia (%)
Place of birth for the foreign-born population - Serbia (%)
Place of birth for the foreign-born population - Ukraine (%)
Place of birth for the foreign-born population - Other Eastern Europe (%)
Place of birth for the foreign-born population - China (%)
Place of birth for the foreign-born population - Hong Kong (%)
Place of birth for the foreign-born population - Taiwan (%)
Place of birth for the foreign-born population - Japan (%)
Place of birth for the foreign-born population - Korea (%)
Place of birth for the foreign-born population - Other Eastern Asia (%)
Place of birth for the foreign-born population - Afghanistan (%)
Place of birth for the foreign-born population - Bangladesh (%)
Place of birth for the foreign-born population - India (%)
Place of birth for the foreign-born population - Iran (%)
Place of birth for the foreign-born population - Kazakhstan (%)
Place of birth for the foreign-born population - Nepal (%)
Place of birth for the foreign-born population - Pakistan (%)
Place of birth for the foreign-born population - Sri Lanka (%)
Place of birth for the foreign-born population - Uzbekistan (%)
Place of birth for the foreign-born population - Other South Central Asia (%)
Place of birth for the foreign-born population - Burma (%)
Place of birth for the foreign-born population - Cambodia (%)
Place of birth for the foreign-born population - Indonesia (%)
Place of birth for the foreign-born population - Laos (%)
Place of birth for the foreign-born population - Malaysia (%)
Place of birth for the foreign-born population - Philippines (%)
Place of birth for the foreign-born population - Singapore (%)
Place of birth for the foreign-born population - Thailand (%)
Place of birth for the foreign-born population - Vietnam (%)
Place of birth for the foreign-born population - Other South Eastern Asia (%)
Place of birth for the foreign-born population - Armenia (%)
Place of birth for the foreign-born population - Iraq (%)
Place of birth for the foreign-born population - Israel (%)
Place of birth for the foreign-born population - Jordan (%)
Place of birth for the foreign-born population - Kuwait (%)
Place of birth for the foreign-born population - Lebanon (%)
Place of birth for the foreign-born population - Saudi Arabia (%)
Place of birth for the foreign-born population - Syria (%)
Place of birth for the foreign-born population - Turkey (%)
Place of birth for the foreign-born population - Yemen (%)
Place of birth for the foreign-born population - Other Western Asia (%)
Place of birth for the foreign-born population - Eritrea (%)
Place of birth for the foreign-born population - Ethiopia (%)
Place of birth for the foreign-born population - Kenya (%)
Place of birth for the foreign-born population - Somalia (%)
Place of birth for the foreign-born population - Uganda (%)
Place of birth for the foreign-born population - Zimbabwe (%)
Place of birth for the foreign-born population - Other Eastern Africa (%)
Place of birth for the foreign-born population - Cameroon (%)
Place of birth for the foreign-born population - Congo (%)
Place of birth for the foreign-born population - Democratic Republic of Congo (Zaire) (%)
Place of birth for the foreign-born population - Other Middle Africa (%)
Place of birth for the foreign-born population - Egypt (%)
Place of birth for the foreign-born population - Morocco (%)
Place of birth for the foreign-born population - Sudan (%)
Place of birth for the foreign-born population - Other Northern Africa (%)
Place of birth for the foreign-born population - South Africa (%)
Place of birth for the foreign-born population - Other Southern Africa (%)
Place of birth for the foreign-born population - Cabo Verde (%)
Place of birth for the foreign-born population - Ghana (%)
Place of birth for the foreign-born population - Liberia (%)
Place of birth for the foreign-born population - Nigeria (%)
Place of birth for the foreign-born population - Senegal (%)
Place of birth for the foreign-born population - Sierra Leone (%)
Place of birth for the foreign-born population - Other Western Africa (%)
Place of birth for the foreign-born population - Australia (%)
Place of birth for the foreign-born population - New Zealand (%)
Place of birth for the foreign-born population - Fiji (%)
Place of birth for the foreign-born population - Micronesia (%)
Place of birth for the foreign-born population - Bahamas (%)
Place of birth for the foreign-born population - Barbados (%)
Place of birth for the foreign-born population - Cuba (%)
Place of birth for the foreign-born population - Dominica (%)
Place of birth for the foreign-born population - Dominican Republic (%)
Place of birth for the foreign-born population - Grenada (%)
Place of birth for the foreign-born population - Haiti (%)
Place of birth for the foreign-born population - Jamaica (%)
Place of birth for the foreign-born population - St. Vincent and the Grenadines (%)
Place of birth for the foreign-born population - Trinidad and Tobago (%)
Place of birth for the foreign-born population - West Indies (%)
Place of birth for the foreign-born population - Other Caribbean (%)
Place of birth for the foreign-born population - Belize (%)
Place of birth for the foreign-born population - Costa Rica (%)
Place of birth for the foreign-born population - El Salvador (%)
Place of birth for the foreign-born population - Guatemala (%)
Place of birth for the foreign-born population - Honduras (%)
Place of birth for the foreign-born population - Mexico (%)
Place of birth for the foreign-born population - Nicaragua (%)
Place of birth for the foreign-born population - Panama (%)
Place of birth for the foreign-born population - Other Central America (%)
Place of birth for the foreign-born population - Argentina (%)
Place of birth for the foreign-born population - Bolivia (%)
Place of birth for the foreign-born population - Brazil (%)
Place of birth for the foreign-born population - Chile (%)
Place of birth for the foreign-born population - Colombia (%)
Place of birth for the foreign-born population - Ecuador (%)
Place of birth for the foreign-born population - Guyana (%)
Place of birth for the foreign-born population - Peru (%)
Place of birth for the foreign-born population - Uruguay (%)
Place of birth for the foreign-born population - Venezuela (%)
Place of birth for the foreign-born population - Other South America (%)
Place of birth for the foreign-born population - Canada (%)
Place of birth for the foreign-born population - Other Northern America (%)
Place of birth for the foreign-born population - Other (%)
Latest news about races in Milpitas, CA collected exclusively by city-data.com from local newspapers, TV, and radio stations
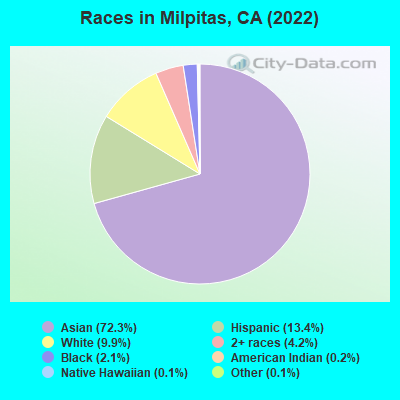
According to 2022 data, the most numerous races in Milpitas, CA are Hispanic (11,070 residents), White alone (10,029 residents), and Asian alone (57,737 residents). 33.0% of Milpitas residents speak English at home. 52.9% of Milpitas, CA residents are foreign-born (46.8% born in Asia), which is 50.8% greater than the foreign-born rate of 26.0% across the entire state of California.
Race distribution in Milpitas
2000 2022
32,281 51.5% Asian alone 14,917 23.8% White alone 10,417 16.6% Hispanic 2,187 3.5% Black alone 2,178 3.5% Two or more races 347 0.6% Native Hawaiian and Other 240 0.4% American Indian alone 131 0.2% Other race alone
57,737 68.5% Asian alone 11,070 13.1% Hispanic 10,029 11.9% White alone 4,992 5.9% Two or more races 2,782 3.3% Black alone 522 0.6% American Indian alone
2000 2022
15,816,790 46.7% White alone 10,966,556 32.4% Hispanic 3,648,860 10.8% Asian alone 2,181,926 6.4% Black alone 903,115 2.7% Two or more races 178,984 0.5% American Indian alone 103,736 0.3% Native Hawaiian and Other 71,681 0.2% Other race alone
15,732,184 40.3% Hispanic 13,160,426 33.7% White alone 5,957,867 15.3% Asian alone 2,025,218 5.2% Black alone 1,663,222 4.3% Two or more races 251,618 0.6% Other race alone 135,777 0.3% Native Hawaiian and Other 103,030 0.3% American Indian alone
Income and house value in Milpitas Median household income in 2022 $134,366 White non-Hispanic householdersover $200,000 Black householders$81,020 American Indian and Alaska Native householders$187,020 Asian householders$188,802 Native Hawaiian and other Pacific Islander householders$162,909 Some other race householders$172,952 Two or more races householders$162,804 Hispanic or Latino race householdersMedian 2022 house value over $1,000,000 White Non-Hispanic householdersover $1,000,000 Black or African American householdersover $1,000,000 American Indian or Alaska Native householders over $1,000,000 Asian householdersover $1,000,000 Native Hawaiian and other Pacific Islander householdersover $1,000,000 Some other race householdersover $1,000,000 Two or more races householdersover $1,000,000 Hispanic or Latino householders
Median age by race in Milpitas
48.7 Median age for White residents42.9 55.0 34.3 Median age for Black or African American residents33.8 38.1 52.6 Median age for American Indian / Alaska Native residents39.1 56.3 38.7 Median age for Asian residents36.7 40.4 61.3 Median age for Native Hawaiian / Pacific Islander residents32.3 70.0 40.4 Median age for Other race residents32.5 50.4 36.3 Median age for Two or more races residents39.5 18.5 51.0 Median age for White alone residents47.0 54.9 37.1 Median age for Hispanic or Latino residents33.8 42.4
Owner/renter occupied households by race in Milpitas
House owners and renters - White residents 2,509 65.7% Owner occupied1,312 34.3% Renter occupiedHouse owners and renters - Black or African American residents 272 30.5% Owner occupied621 69.5% Renter occupiedHouse owners and renters - American Indian / Alaska Native residents 67 64.1% Owner occupied38 35.9% Renter occupiedHouse owners and renters - Asian residents 13,614 70.9% Owner occupied5,600 29.1% Renter occupiedHouse owners and renters - Native Hawaiian / Pacific Islander residents 45 39.0% Owner occupied70 61.0% Renter occupiedHouse owners and renters - Other race residents 651 33.2% Owner occupied1,307 66.8% Renter occupiedHouse owners and renters - Two or more races residents 2,688 63.5% Owner occupied1,542 36.5% Renter occupiedHouse owners and renters - White alone residents 2,544 66.0% Owner occupied1,311 34.0% Renter occupiedHouse owners and renters - Hispanic or Latino residents 849 35.1% Owner occupied1,569 64.9% Renter occupied
Language usage in Milpitas
English speakers - Total 33.0% of residents of Milpitas speak English at home.
8.6% of residents speak Spanish at home 4,650 72.4% Speak English very well1,770 27.6% Speak English less than very well59.1% of residents speak other language at home 27,002 61.2% Speak English very well17,101 38.8% Speak English less than very well
English speakers - Born in the United States 86.8% of residents of Milpitas speak English at home.
4.2% of residents speak Spanish at home 190 94.5% Speak English very well11 5.5% Speak English less than very well9.4% of residents speak other language at home 332 74.3% Speak English very well115 25.7% Speak English less than very well
English speakers - Native, born elsewhere 47.3% of residents of Milpitas speak English at home.
8.9% of residents speak Spanish at home 83 74.1% Speak English very well29 25.9% Speak English less than very well42.4% of residents speak other language at home 298 55.7% Speak English very well237 44.3% Speak English less than very well
English speakers - Foreign-born 7.7% of residents of Milpitas speak English at home.
6.4% of residents speak Spanish at home 1,085 41.3% Speak English very well1,545 58.7% Speak English less than very well87.9% of residents speak other language at home 20,206 56.4% Speak English very well15,651 43.6% Speak English less than very well
White (Caucasian) - Speak only English Native:
94.8% (8,499)Foreign-born:
15.2% (219)
White (Caucasian) - Speak another language Native:
8.2% (731)Foreign-born:
83.9% (1,211)
Black or African American - Speak only English Native:
97.5% (2,340)Foreign-born:
85.6% (112)
Black or African American - Speak another language Native:
1.0% (24)Foreign-born:
13.2% (17)
Asian - Speak only English Native:
56.0% (8,838)Foreign-born:
8.1% (3,055)
Asian - Speak another language Native:
43.9% (6,930)Foreign-born:
91.6% (34,494)
Native Hawaiian / Pacific Islander - Speak only English Native:
42.9% (80)Foreign-born:
4.4% (3)
Native Hawaiian / Pacific Islander - Speak another language Native:
49.5% (92)Foreign-born:
93.0% (66)
Other race - Speak only English Native:
14.0% (694)Foreign-born:
5.4% (144)
Other race - Speak another language Native:
83.6% (4,140)Foreign-born:
94.6% (2,523)
Two or more races - Speak another language Native:
24.1% (2,390)Foreign-born:
100.0% (3,782)
White alone - Speak only English Native:
91.5% (7,403)Foreign-born:
13.4% (238)
White alone - Speak another language Native:
8.7% (704)Foreign-born:
86.9% (1,541)
Hispanic or Latino - Speak only English Native:
43.8% (3,368)Foreign-born:
4.0% (118)
Hispanic or Latino - Speak another language Native:
56.4% (4,336)Foreign-born:
95.6% (2,785)
Foreign-born residents in Milpitas 42,130 residents are foreign born (46.8% Asia ).
This city:
52.9%California:
100.0%
Marital status for residents in Milpitas Marital status - White (Caucasian) population 15 years and over
Males 44.2% Never married40.3% Now married0.0% Separated1.6% Widowed13.9% DivorcedFemales 24.2% Never married41.3% Now married1.8% Separated14.4% Widowed18.2% DivorcedWomen who gave birth in the past 12 months Now married:
80.5% (52)Unmarried:
19.5% (13)
Women who did not give birth in the past 12 months Now married:
43.2% (758)Unmarried:
56.8% (996)
Marital status - Black or African American population 15 years and over
Males 48.4% Never married39.1% Now married1.1% Separated2.8% Widowed8.6% DivorcedFemales 52.5% Never married31.7% Now married0.0% Separated3.8% Widowed12.0% DivorcedWomen who did not give birth in the past 12 months Now married:
29.0% (151)Unmarried:
71.0% (371)
Marital status - American Indian / Alaska Native population 15 years and over
Males 25.7% Never married59.6% Now married0.0% Separated14.8% Widowed0.0% DivorcedFemales 35.7% Never married28.6% Now married0.0% Separated14.3% Widowed21.4% DivorcedWomen who gave birth in the past 12 months Now married:
82.4% (20)Unmarried:
17.6% (4)
Women who did not give birth in the past 12 months Now married:
0.0% (0)Unmarried:
100.0% (39)
Marital status - Asian population 15 years and over
Males 31.2% Never married61.6% Now married1.3% Separated1.8% Widowed4.1% DivorcedFemales 25.0% Never married59.0% Now married1.2% Separated8.2% Widowed6.6% DivorcedWomen who gave birth in the past 12 months Now married:
86.0% (916)Unmarried:
14.0% (149)
Women who did not give birth in the past 12 months Now married:
55.3% (6,977)Unmarried:
44.7% (5,645)
Marital status - Native Hawaiian / Pacific Islander population 15 years and over
Males 11.2% Never married88.8% Now married0.0% Separated0.0% Widowed0.0% DivorcedFemales 31.2% Never married68.8% Now married0.0% Separated0.0% Widowed0.0% DivorcedWomen who did not give birth in the past 12 months Now married:
0.0% (0)Unmarried:
100.0% (26)
Marital status - Other race population 15 years and over
Males 55.6% Never married33.3% Now married3.5% Separated0.5% Widowed7.1% DivorcedFemales 38.8% Never married41.1% Now married9.6% Separated6.2% Widowed4.2% DivorcedWomen who gave birth in the past 12 months Now married:
80.6% (51)Unmarried:
19.4% (12)
Women who did not give birth in the past 12 months Now married:
44.7% (585)Unmarried:
55.3% (725)
Marital status - Two or more races population 15 years and over
Males 61.1% Never married30.4% Now married4.3% Separated0.6% Widowed3.6% DivorcedFemales 48.1% Never married35.2% Now married6.2% Separated2.6% Widowed7.9% DivorcedWomen who gave birth in the past 12 months Now married:
0.0% (0)Unmarried:
100.0% (89)
Women who did not give birth in the past 12 months Now married:
32.1% (697)Unmarried:
67.9% (1,470)
Marital status - White alone, not Hispanic / Latino population 15 years and over
Males 41.1% Never married43.0% Now married0.0% Separated0.6% Widowed15.4% DivorcedFemales 19.1% Never married42.1% Now married2.2% Separated16.7% Widowed20.0% DivorcedWomen who gave birth in the past 12 months Now married:
75.0% (29)Unmarried:
25.0% (10)
Women who did not give birth in the past 12 months Now married:
48.4% (608)Unmarried:
51.6% (648)
Marital status - Hispanic or Latino population 15 years and over
Males 54.5% Never married34.1% Now married5.2% Separated1.3% Widowed4.9% DivorcedFemales 40.4% Never married51.9% Now married0.0% Separated0.9% Widowed6.8% DivorcedWomen who gave birth in the past 12 months Now married:
73.7% (100)Unmarried:
26.3% (35)
Women who did not give birth in the past 12 months Now married:
41.5% (1,016)Unmarried:
58.5% (1,433)
Ancestries in Milpitas
456 0.8% German438 0.8% European356 0.6% American351 0.6% Italian332 0.6% Irish306 0.5% English258 0.5% Iraqi163 0.3% Portuguese123 0.2% Lebanese114 0.2% Russian106 0.2% Polish98 0.2% French97 0.2% Afghan86 0.2% British85 0.1% Iranian82 0.1% Dutch64 0.1% Assyrian64 0.1% Hungarian55 0.10% Swedish50 0.09% African47 0.08% Romanian40 0.07% Nigerian36 0.06% Scotch-Irish34 0.06% Armenian33 0.06% Scandinavian32 0.06% Scottish29 0.05% Ukrainian27 0.05% French Canadian27 0.05% Finnish19 0.03% Jordanian16 0.03% Canadian15 0.03% Austrian15 0.03% Lithuanian15 0.03% Norwegian14 0.02% Bulgarian14 0.02% Slavic13 0.02% Croatian12 0.02% Basque11 0.02% Estonian11 0.02% Israeli10 0.02% Eastern European10 0.02% Danish9 0.02% Swiss9 0.02% Welsh7 0.01% Northern European5 0.01% Palestinian5 0.01% Ethiopian5 0.01% West Indian
Geographical mobility in Milpitas Same house 1 year ago 8,812 86.3% White (Caucasian)1,944 72.7% Black or African American517 90.8% American Indian / Alaska Native49,424 86.3% Asian191 71.5% Native Hawaiian / Pacific Islander4,466 78.8% Other race10,775 91.5% Two or more races7,145 85.4% White alone, not Hispanic / Latino9,235 81.6% Hispanic or LatinoMoved within same county 1,017 10.0% White / Caucasian327 12.2% Black or African American54 9.4% American Indian / Alaska Native5,459 9.5% Asian70 26.1% Native Hawaiian / Pacific Islander883 15.6% Other race666 5.7% Two or more races815 9.7% White alone, not Hispanic / Latino1,522 13.5% Hispanic or LatinoMoved within same state 225 2.2% White / Caucasian118 4.4% Black or African American1,624 2.8% Asian128 2.3% Other race368 3.1% Two or more races221 2.6% White alone, not Hispanic / Latino259 2.3% Hispanic or LatinoMoved from different state 96 0.9% White / Caucasian173 6.5% Black or African American115 0.2% Asian41 0.7% Other race58 0.5% Two or more races95 1.1% White alone, not Hispanic / Latino90 0.8% Hispanic or LatinoMoved from abroad 42 0.4% White10 0.4% Black or African American649 1.1% Asian30 0.5% Other race16 0.1% Two or more races58 0.7% White alone, not Hispanic / Latino36 0.3% Hispanic or Latino
Children Nativity (place of birth) in Milpitas
Children under 6 years - Living with two parents Both parents native 857 100.0% NativeBoth parents foreign-born 3,385 95.6% Native154 4.4% Foreign-bornOne native, one foreign-born parent 676 100.0% NativeChildren under 6 years - Living with one parent Native parent 672 100.0% NativeForeign-born parent 59 100.0% NativeChildren 6 to 17 years - Living with two parents Both parents native 1,477 100.0% NativeBoth parents foreign-born 3,605 92.3% Native302 7.7% Foreign-bornOne native, one foreign-born parent 768 100.0% NativeChildren 6 to 17 years - Living with one parent Native parent 678 100.0% NativeForeign-born parent 575 52.1% Native529 47.9% Foreign-born
Place of birth for residents in Milpitas 37,732 Asia17,188 South Eastern Asia11,465 South Central Asia8,509 Eastern Asia7,395 China3,286 Americas3,174 Latin America2,794 Central America826 Europe564 Western Asia291 Western Europe281 Eastern Europe244 South America186 Northern Europe149 Africa135 Caribbean134 Oceania112 Northern America66 Southern Europe52 Eastern Africa48 Northern Africa47 Australia and New Zealand Subregion42 Western Africa6 Southern Africa11,051 India8,117 Vietnam7,591 Philippines4,598 China2,314 Mexico1,579 Taiwan1,218 Hong Kong989 Korea543 Malaysia334 Burma204 Iraq193 Pakistan170 Cambodia168 Germany146 Thailand128 El Salvador127 Indonesia123 Japan112 Canada111 Nicaragua108 Iran96 Laos80 Kuwait79 France72 Russia71 Jamaica71 Argentina69 Guatemala66 United Kingdom64 Honduras62 Brazil61 Romania60 Singapore53 Panama52 Afghanistan51 Costa Rica49 Nepal48 Peru47 Australia46 Poland44 Italy42 Nigeria42 Trinidad and Tobago39 Netherlands36 Sweden34 Belarus34 Colombia32 England31 Israel25 Armenia24 Kenya22 Lebanon22 Saudi Arabia22 Portugal22 Ireland21 Dominican Republic20 Venezuela20 Ukraine18 Turkey16 Bulgaria13 Fiji13 Moldova10 Bangladesh7 Scotland6 South Africa6 Guyana5 Egypt5 Austria2 Ethiopia
Grandparents responsible for own grandchildren in Milpitas
Grandparents (30 to 59 years) White / Caucasian 10 26.5% Responsible for grandchildren29 73.5% Not responsible for grandchildrenAsian 31 18.4% Responsible for grandchildren136 81.6% Not responsible for grandchildrenOther race 22 38.8% Responsible for grandchildren35 61.2% Not responsible for grandchildrenTwo or more races 41 100.0% Responsible for grandchildrenWhite alone, not Hispanic / Latino 14 100.0% Not responsible for grandchildrenHispanic or Latino 53 46.7% Responsible for grandchildren60 53.3% Not responsible for grandchildrenGrandparents (60 years and over) White / Caucasian 20 12.9% Responsible for grandchildren135 87.1% Not responsible for grandchildrenAsian 225 13.9% Responsible for grandchildren1,394 86.1% Not responsible for grandchildrenTwo or more races 63 43.0% Responsible for grandchildren84 57.0% Not responsible for grandchildrenWhite alone, not Hispanic / Latino 23 31.1% Responsible for grandchildren50 68.9% Not responsible for grandchildrenHispanic or Latino 13 9.0% Responsible for grandchildren135 91.0% Not responsible for grandchildren