Races in Milton, Georgia (GA) Detailed Stats
Data:
Races - White alone (%)
Races - White alone (% change since 2000)
Races - Black alone (%)
Races - Black alone (% change since 2000)
Races - American Indian alone (%)
Races - American Indian alone (% change since 2000)
Races - Asian alone (%)
Races - Asian alone (% change since 2000)
Races - Hispanic (%)
Races - Hispanic (% change since 2000)
Races - Native Hawaiian and Other Pacific Islander alone (%)
Races - Native Hawaiian and Other Pacific Islander alone (% change since 2000)
Races - Two or more races(%)
Races - Two or more races(% change since 2000)
Races - Other race alone (%)
Races - Other race alone (% change since 2000)
Racial diversity
Place of birth - Born in state of residence (%)
Place of birth - Born in state of residence (%) - White
Place of birth - Born in state of residence (%) - Black or African American
Place of birth - Born in state of residence (%) - Asian
Place of birth - Born in state of residence (%) - Hispanic or Latino
Place of birth - Born in state of residence (%) - American Indian and Alaska Native
Place of birth - Born in state of residence (%) - Multirace
Place of birth - Born in state of residence (%) - Other Race
Place of birth - Born in other state (%)
Place of birth - Born in other state (%) - White
Place of birth - Born in other state (%) - Black or African American
Place of birth - Born in other state (%) - Asian
Place of birth - Born in other state (%) - Hispanic or Latino
Place of birth - Born in other state (%) - American Indian and Alaska Native
Place of birth - Born in other state (%) - Multirace
Place of birth - Born in other state (%) - Other Race
Place of birth - Native, outside of US (%)
Place of birth - Native, outside of US (%) - White
Place of birth - Native, outside of US (%) - Black or African American
Place of birth - Native, outside of US (%) - Asian
Place of birth - Native, outside of US (%) - Hispanic or Latino
Place of birth - Native, outside of US (%) - American Indian and Alaska Native
Place of birth - Native, outside of US (%) - Multirace
Place of birth - Native, outside of US (%) - Other Race
Place of birth - Foreign born (%)
Place of birth - Foreign born (%) - White
Place of birth - Foreign born (%) - Black or African American
Place of birth - Foreign born (%) - Asian
Place of birth - Foreign born (%) - Hispanic or Latino
Place of birth - Foreign born (%) - American Indian and Alaska Native
Place of birth - Foreign born (%) - Multirace
Place of birth - Foreign born (%) - Other Race
Residents speaking English at home (%)
Residents speaking English at home - Born in the United States (%)
Residents speaking English at home - Native, born elsewhere (%)
Residents speaking English at home - Foreign born (%)
Residents speaking Spanish at home (%)
Residents speaking Spanish at home - Born in the United States (%)
Residents speaking Spanish at home - Native, born elsewhere (%)
Residents speaking Spanish at home - Foreign born (%)
Residents speaking other language at home (%)
Residents speaking other language at home - Born in the United States (%)
Residents speaking other language at home - Native, born elsewhere (%)
Residents speaking other language at home - Foreign born (%)
Marital status - Never married (%)
Marital status - Now married (%)
Marital status - Separated (%)
Marital status - Widowed (%)
Marital status - Divorced (%)
Ancestries Reported - Arab (%)
Ancestries Reported - Czech (%)
Ancestries Reported - Danish (%)
Ancestries Reported - Dutch (%)
Ancestries Reported - English (%)
Ancestries Reported - French (%)
Ancestries Reported - French Canadian (%)
Ancestries Reported - German (%)
Ancestries Reported - Greek (%)
Ancestries Reported - Hungarian (%)
Ancestries Reported - Irish (%)
Ancestries Reported - Italian (%)
Ancestries Reported - Lithuanian (%)
Ancestries Reported - Norwegian (%)
Ancestries Reported - Polish (%)
Ancestries Reported - Portuguese (%)
Ancestries Reported - Russian (%)
Ancestries Reported - Scotch-Irish (%)
Ancestries Reported - Scottish (%)
Ancestries Reported - Slovak (%)
Ancestries Reported - Subsaharan African (%)
Ancestries Reported - Swedish (%)
Ancestries Reported - Swiss (%)
Ancestries Reported - Ukrainian (%)
Ancestries Reported - United States (%)
Ancestries Reported - Welsh (%)
Ancestries Reported - West Indian (%)
Ancestries Reported - Other (%)
Geographical mobility - Same house 1 year ago (%)
Geographical mobility - Same house 1 year ago (%) - White
Geographical mobility - Same house 1 year ago (%) - Black or African American
Geographical mobility - Same house 1 year ago (%) - Asian
Geographical mobility - Same house 1 year ago (%) - Hispanic or Latino
Geographical mobility - Same house 1 year ago (%) - American Indian and Alaska Native
Geographical mobility - Same house 1 year ago (%) - Multirace
Geographical mobility - Same house 1 year ago (%) - Other Race
Geographical mobility - Moved within same county (%)
Geographical mobility - Moved within same county (%) - White
Geographical mobility - Moved within same county (%) - Black or African American
Geographical mobility - Moved within same county (%) - Asian
Geographical mobility - Moved within same county (%) - Hispanic or Latino
Geographical mobility - Moved within same county (%) - American Indian and Alaska Native
Geographical mobility - Moved within same county (%) - Multirace
Geographical mobility - Moved within same county (%) - Other Race
Geographical mobility - Moved from different county within same state (%)
Geographical mobility - Moved from different county within same state (%) - White
Geographical mobility - Moved from different county within same state (%) - Black or African American
Geographical mobility - Moved from different county within same state (%) - Asian
Geographical mobility - Moved from different county within same state (%) - Hispanic or Latino
Geographical mobility - Moved from different county within same state (%) - American Indian and Alaska Native
Geographical mobility - Moved from different county within same state (%) - Multirace
Geographical mobility - Moved from different county within same state (%) - Other Race
Geographical mobility - Moved from different state (%)
Geographical mobility - Moved from different state (%) - White
Geographical mobility - Moved from different state (%) - Black or African American
Geographical mobility - Moved from different state (%) - Asian
Geographical mobility - Moved from different state (%) - Hispanic or Latino
Geographical mobility - Moved from different state (%) - American Indian and Alaska Native
Geographical mobility - Moved from different state (%) - Multirace
Geographical mobility - Moved from different state (%) - Other Race
Geographical mobility - Moved from abroad (%)
Geographical mobility - Moved from abroad (%) - White
Geographical mobility - Moved from abroad (%) - Black or African American
Geographical mobility - Moved from abroad (%) - Asian
Geographical mobility - Moved from abroad (%) - Hispanic or Latino
Geographical mobility - Moved from abroad (%) - American Indian and Alaska Native
Geographical mobility - Moved from abroad (%) - Multirace
Geographical mobility - Moved from abroad (%) - Other Race
Place of birth for the foreign-born population - Ireland (%)
Place of birth for the foreign-born population - Denmark (%)
Place of birth for the foreign-born population - Norway (%)
Place of birth for the foreign-born population - Sweden (%)
Place of birth for the foreign-born population - United Kingdom (%)
Place of birth for the foreign-born population - England (%)
Place of birth for the foreign-born population - Scotland (%)
Place of birth for the foreign-born population - Other Northern Europe (%)
Place of birth for the foreign-born population - Austria (%)
Place of birth for the foreign-born population - Belgium (%)
Place of birth for the foreign-born population - France (%)
Place of birth for the foreign-born population - Germany (%)
Place of birth for the foreign-born population - Netherlands (%)
Place of birth for the foreign-born population - Switzerland (%)
Place of birth for the foreign-born population - Other Western Europe (%)
Place of birth for the foreign-born population - Greece (%)
Place of birth for the foreign-born population - Italy (%)
Place of birth for the foreign-born population - Portugal (%)
Place of birth for the foreign-born population - Spain (%)
Place of birth for the foreign-born population - Other Southern Europe (%)
Place of birth for the foreign-born population - Albania (%)
Place of birth for the foreign-born population - Belarus (%)
Place of birth for the foreign-born population - Bosnia and Herzegovina (%)
Place of birth for the foreign-born population - Bulgaria (%)
Place of birth for the foreign-born population - Croatia (%)
Place of birth for the foreign-born population - Czechoslovakia (%)
Place of birth for the foreign-born population - Hungary (%)
Place of birth for the foreign-born population - Latvia (%)
Place of birth for the foreign-born population - Lithuania (%)
Place of birth for the foreign-born population - North Macedonia (Macedonia) (%)
Place of birth for the foreign-born population - Moldova (%)
Place of birth for the foreign-born population - Poland (%)
Place of birth for the foreign-born population - Romania (%)
Place of birth for the foreign-born population - Russia (%)
Place of birth for the foreign-born population - Serbia (%)
Place of birth for the foreign-born population - Ukraine (%)
Place of birth for the foreign-born population - Other Eastern Europe (%)
Place of birth for the foreign-born population - China (%)
Place of birth for the foreign-born population - Hong Kong (%)
Place of birth for the foreign-born population - Taiwan (%)
Place of birth for the foreign-born population - Japan (%)
Place of birth for the foreign-born population - Korea (%)
Place of birth for the foreign-born population - Other Eastern Asia (%)
Place of birth for the foreign-born population - Afghanistan (%)
Place of birth for the foreign-born population - Bangladesh (%)
Place of birth for the foreign-born population - India (%)
Place of birth for the foreign-born population - Iran (%)
Place of birth for the foreign-born population - Kazakhstan (%)
Place of birth for the foreign-born population - Nepal (%)
Place of birth for the foreign-born population - Pakistan (%)
Place of birth for the foreign-born population - Sri Lanka (%)
Place of birth for the foreign-born population - Uzbekistan (%)
Place of birth for the foreign-born population - Other South Central Asia (%)
Place of birth for the foreign-born population - Burma (%)
Place of birth for the foreign-born population - Cambodia (%)
Place of birth for the foreign-born population - Indonesia (%)
Place of birth for the foreign-born population - Laos (%)
Place of birth for the foreign-born population - Malaysia (%)
Place of birth for the foreign-born population - Philippines (%)
Place of birth for the foreign-born population - Singapore (%)
Place of birth for the foreign-born population - Thailand (%)
Place of birth for the foreign-born population - Vietnam (%)
Place of birth for the foreign-born population - Other South Eastern Asia (%)
Place of birth for the foreign-born population - Armenia (%)
Place of birth for the foreign-born population - Iraq (%)
Place of birth for the foreign-born population - Israel (%)
Place of birth for the foreign-born population - Jordan (%)
Place of birth for the foreign-born population - Kuwait (%)
Place of birth for the foreign-born population - Lebanon (%)
Place of birth for the foreign-born population - Saudi Arabia (%)
Place of birth for the foreign-born population - Syria (%)
Place of birth for the foreign-born population - Turkey (%)
Place of birth for the foreign-born population - Yemen (%)
Place of birth for the foreign-born population - Other Western Asia (%)
Place of birth for the foreign-born population - Eritrea (%)
Place of birth for the foreign-born population - Ethiopia (%)
Place of birth for the foreign-born population - Kenya (%)
Place of birth for the foreign-born population - Somalia (%)
Place of birth for the foreign-born population - Uganda (%)
Place of birth for the foreign-born population - Zimbabwe (%)
Place of birth for the foreign-born population - Other Eastern Africa (%)
Place of birth for the foreign-born population - Cameroon (%)
Place of birth for the foreign-born population - Congo (%)
Place of birth for the foreign-born population - Democratic Republic of Congo (Zaire) (%)
Place of birth for the foreign-born population - Other Middle Africa (%)
Place of birth for the foreign-born population - Egypt (%)
Place of birth for the foreign-born population - Morocco (%)
Place of birth for the foreign-born population - Sudan (%)
Place of birth for the foreign-born population - Other Northern Africa (%)
Place of birth for the foreign-born population - South Africa (%)
Place of birth for the foreign-born population - Other Southern Africa (%)
Place of birth for the foreign-born population - Cabo Verde (%)
Place of birth for the foreign-born population - Ghana (%)
Place of birth for the foreign-born population - Liberia (%)
Place of birth for the foreign-born population - Nigeria (%)
Place of birth for the foreign-born population - Senegal (%)
Place of birth for the foreign-born population - Sierra Leone (%)
Place of birth for the foreign-born population - Other Western Africa (%)
Place of birth for the foreign-born population - Australia (%)
Place of birth for the foreign-born population - New Zealand (%)
Place of birth for the foreign-born population - Fiji (%)
Place of birth for the foreign-born population - Micronesia (%)
Place of birth for the foreign-born population - Bahamas (%)
Place of birth for the foreign-born population - Barbados (%)
Place of birth for the foreign-born population - Cuba (%)
Place of birth for the foreign-born population - Dominica (%)
Place of birth for the foreign-born population - Dominican Republic (%)
Place of birth for the foreign-born population - Grenada (%)
Place of birth for the foreign-born population - Haiti (%)
Place of birth for the foreign-born population - Jamaica (%)
Place of birth for the foreign-born population - St. Vincent and the Grenadines (%)
Place of birth for the foreign-born population - Trinidad and Tobago (%)
Place of birth for the foreign-born population - West Indies (%)
Place of birth for the foreign-born population - Other Caribbean (%)
Place of birth for the foreign-born population - Belize (%)
Place of birth for the foreign-born population - Costa Rica (%)
Place of birth for the foreign-born population - El Salvador (%)
Place of birth for the foreign-born population - Guatemala (%)
Place of birth for the foreign-born population - Honduras (%)
Place of birth for the foreign-born population - Mexico (%)
Place of birth for the foreign-born population - Nicaragua (%)
Place of birth for the foreign-born population - Panama (%)
Place of birth for the foreign-born population - Other Central America (%)
Place of birth for the foreign-born population - Argentina (%)
Place of birth for the foreign-born population - Bolivia (%)
Place of birth for the foreign-born population - Brazil (%)
Place of birth for the foreign-born population - Chile (%)
Place of birth for the foreign-born population - Colombia (%)
Place of birth for the foreign-born population - Ecuador (%)
Place of birth for the foreign-born population - Guyana (%)
Place of birth for the foreign-born population - Peru (%)
Place of birth for the foreign-born population - Uruguay (%)
Place of birth for the foreign-born population - Venezuela (%)
Place of birth for the foreign-born population - Other South America (%)
Place of birth for the foreign-born population - Canada (%)
Place of birth for the foreign-born population - Other Northern America (%)
Place of birth for the foreign-born population - Other (%)
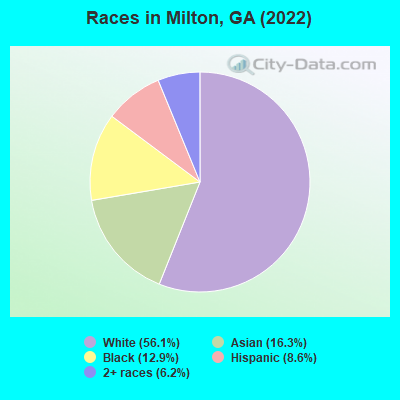
According to 2022 data, the most numerous races in Milton, GA are White alone (23,280 residents), Black alone (5,346 residents), and Hispanic (3,580 residents). 73.9% of Milton residents speak English at home.
Race distribution in Milton 23,280 56.1% White alone 6,785 16.3% Asian alone 5,346 12.9% Black alone 3,580 8.6% Hispanic 2,587 6.2% Two or more races
2000 2022
5,128,661 62.6% White alone 2,331,465 28.5% Black alone 435,227 5.3% Hispanic 171,513 2.1% Asian alone 87,364 1.1% Two or more races 17,670 0.2% American Indian alone 11,275 0.1% Other race alone 3,278 0.04% Native Hawaiian and Other
5,415,657 49.6% White alone 3,349,240 30.7% Black alone 1,132,604 10.4% Hispanic 479,156 4.4% Asian alone 462,923 4.2% Two or more races 54,416 0.5% Other race alone 11,923 0.1% American Indian alone 6,957 0.06% Native Hawaiian and Other
Income and house value in Milton Median household income in 2022 $185,674 White non-Hispanic householders$130,602 Black householders$131,344 Asian householders$66,091 Some other race householders$107,098 Two or more races householders$92,451 Hispanic or Latino race householders
Median age by race in Milton
45.5 Median age for White residents45.6 45.5 38.2 Median age for Black or African American residents18.3 41.2 -764,932,561.9 Median age for American Indian / Alaska Native residents-507,017,543.4 -1,009,920,633.9 37.2 Median age for Asian residents37.4 35.9 -866,062,436.2 Median age for Native Hawaiian / Pacific Islander residents-658,602,149.9 -776,776,776.0 18.9 Median age for Other race residents23.7 16.0 30.8 Median age for Two or more races residents26.8 37.6 46.0 Median age for White alone residents46.1 45.6 32.7 Median age for Hispanic or Latino residents31.3 33.2
Owner/renter occupied households by race in Milton
House owners and renters - White residents 8,261 86.0% Owner occupied1,348 14.0% Renter occupiedHouse owners and renters - Black or African American residents 1,167 58.4% Owner occupied831 41.6% Renter occupiedHouse owners and renters - Asian residents 1,563 59.5% Owner occupied1,062 40.5% Renter occupiedHouse owners and renters - Other race residents 17 13.3% Owner occupied111 86.7% Renter occupiedHouse owners and renters - Two or more races residents 720 52.6% Owner occupied650 47.4% Renter occupiedHouse owners and renters - White alone residents 8,226 86.5% Owner occupied1,288 13.5% Renter occupiedHouse owners and renters - Hispanic or Latino residents 563 48.5% Owner occupied599 51.5% Renter occupied
Language usage in Milton
English speakers - Total 73.9% of residents of Milton speak English at home.
6.7% of residents speak Spanish at home 2,028 77.3% Speak English very well596 22.7% Speak English less than very well19.2% of residents speak other language at home 6,082 81.2% Speak English very well1,404 18.8% Speak English less than very well
English speakers - Born in the United States 94.9% of residents of Milton speak English at home.
3.7% of residents speak Spanish at home 722 93.3% Speak English very well52 6.7% Speak English less than very well1.5% of residents speak other language at home 289 92.6% Speak English very well23 7.4% Speak English less than very well
English speakers - Native, born elsewhere 43.3% of residents of Milton speak English at home.
23.3% of residents speak Spanish at home 57 100.0% Speak English very well25.3% of residents speak other language at home 62 100.0% Speak English very well
English speakers - Foreign-born 16.5% of residents of Milton speak English at home.
12.8% of residents speak Spanish at home 753 63.4% Speak English very well435 36.6% Speak English less than very well69.0% of residents speak other language at home 5,035 78.9% Speak English very well1,347 21.1% Speak English less than very well
White (Caucasian) - Speak only English Native:
97.7% (20,476)Foreign-born:
34.4% (494)
White (Caucasian) - Speak another language Native:
2.6% (549)Foreign-born:
65.6% (943)
Black or African American - Speak only English Native:
100.0% (4,628)Foreign-born:
28.2% (145)
Black or African American - Speak another language Native:
0.2% (9)Foreign-born:
71.0% (365)
Asian - Speak only English Native:
64.8% (788)Foreign-born:
12.2% (634)
Asian - Speak another language Native:
35.4% (430)Foreign-born:
87.8% (4,553)
Other race - Speak another language Native:
100.0% (230)Foreign-born:
84.8% (148)
Two or more races - Speak only English Native:
49.0% (1,457)Foreign-born:
2.6% (41)
Two or more races - Speak another language Native:
51.9% (1,543)Foreign-born:
98.4% (1,556)
White alone - Speak only English Native:
97.3% (20,102)Foreign-born:
34.5% (524)
White alone - Speak another language Native:
2.6% (536)Foreign-born:
65.3% (991)
Hispanic or Latino - Speak only English Native:
48.8% (1,161)Foreign-born:
1.6% (18)
Hispanic or Latino - Speak another language Native:
51.3% (1,220)Foreign-born:
99.8% (1,124)
Foreign-born residents in Milton
Marital status for residents in Milton Marital status - White (Caucasian) population 15 years and over
Males 19.4% Never married72.8% Now married0.0% Separated1.5% Widowed6.3% DivorcedFemales 22.4% Never married64.9% Now married0.1% Separated4.2% Widowed8.3% DivorcedWomen who gave birth in the past 12 months Now married:
90.5% (88)Unmarried:
9.5% (9)
Women who did not give birth in the past 12 months Now married:
56.5% (2,898)Unmarried:
43.5% (2,230)
Marital status - Black or African American population 15 years and over
Males 27.7% Never married72.3% Now married0.0% Separated0.0% Widowed0.0% DivorcedFemales 34.6% Never married54.2% Now married0.0% Separated0.0% Widowed11.2% DivorcedWomen who gave birth in the past 12 months Now married:
100.0% (235)Unmarried:
0.0% (0)
Women who did not give birth in the past 12 months Now married:
41.9% (644)Unmarried:
58.1% (895)
Marital status - Asian population 15 years and over
Males 22.0% Never married71.3% Now married0.0% Separated0.3% Widowed6.4% DivorcedFemales 11.9% Never married86.9% Now married0.0% Separated0.7% Widowed0.5% DivorcedWomen who gave birth in the past 12 months Now married:
100.0% (76)Unmarried:
0.0% (0)
Women who did not give birth in the past 12 months Now married:
82.8% (1,451)Unmarried:
17.2% (303)
Marital status - Other race population 15 years and over
Males 47.1% Never married52.9% Now married0.0% Separated0.0% Widowed0.0% DivorcedFemales 42.7% Never married57.3% Now married0.0% Separated0.0% Widowed0.0% DivorcedWomen who did not give birth in the past 12 months Now married:
53.4% (103)Unmarried:
46.6% (90)
Marital status - Two or more races population 15 years and over
Males 22.0% Never married64.9% Now married1.9% Separated0.3% Widowed10.9% DivorcedFemales 22.6% Never married67.6% Now married0.0% Separated1.4% Widowed8.4% DivorcedWomen who gave birth in the past 12 months Now married:
100.0% (233)Unmarried:
0.0% (0)
Women who did not give birth in the past 12 months Now married:
57.7% (775)Unmarried:
42.3% (568)
Marital status - White alone, not Hispanic / Latino population 15 years and over
Males 18.9% Never married73.4% Now married0.0% Separated1.2% Widowed6.5% DivorcedFemales 22.4% Never married64.7% Now married0.1% Separated4.1% Widowed8.7% DivorcedWomen who gave birth in the past 12 months Now married:
90.5% (91)Unmarried:
9.5% (10)
Women who did not give birth in the past 12 months Now married:
55.4% (2,727)Unmarried:
44.6% (2,192)
Marital status - Hispanic or Latino population 15 years and over
Males 27.3% Never married64.1% Now married0.0% Separated2.7% Widowed5.8% DivorcedFemales 33.0% Never married60.8% Now married0.0% Separated2.7% Widowed3.5% DivorcedWomen who did not give birth in the past 12 months Now married:
56.3% (725)Unmarried:
43.7% (563)
Ancestries in Milton
3,138 14.6% English1,432 6.7% American774 3.6% Brazilian745 3.5% German583 2.7% Irish423 2.0% Scottish376 1.7% Iranian361 1.7% European320 1.5% Italian238 1.1% African196 0.9% Lebanese174 0.8% Nigerian155 0.7% Polish152 0.7% Scandinavian136 0.6% Sudanese119 0.6% Scotch-Irish113 0.5% Hungarian112 0.5% Russian74 0.3% Dutch64 0.3% Romanian62 0.3% British61 0.3% Welsh59 0.3% French Canadian56 0.3% Haitian45 0.2% Jamaican41 0.2% Portuguese36 0.2% Palestinian34 0.2% Swedish32 0.1% Slovak31 0.1% Canadian29 0.1% Czech28 0.1% Danish27 0.1% Trinidadian and Tobagonian21 0.10% French18 0.08% Greek18 0.08% Northern European13 0.06% Moroccan12 0.06% Czechoslovakian
Geographical mobility in Milton Same house 1 year ago 21,175 90.8% White (Caucasian)4,539 82.9% Black or African American5,199 76.6% Asian274 56.0% Other race4,919 95.1% Two or more races20,969 90.5% White alone, not Hispanic / Latino3,235 90.1% Hispanic or LatinoMoved within same county 1,360 5.8% White / Caucasian84 1.2% Asian215 43.9% Other race16 0.3% Two or more races1,432 6.2% White alone, not Hispanic / Latino138 3.8% Hispanic or LatinoMoved within same state 437 1.9% White / Caucasian373 6.8% Black or African American300 4.4% Asian301 5.8% Two or more races420 1.8% White alone, not Hispanic / Latino51 1.4% Hispanic or LatinoMoved from different state 346 1.5% White / Caucasian780 14.2% Black or African American287 4.2% Asian55 1.1% Two or more races296 1.3% White alone, not Hispanic / Latino175 4.9% Hispanic or LatinoMoved from abroad 9 0.0% White1,162 17.1% Asian21 0.4% Two or more races12 0.0% White alone, not Hispanic / Latino
Children Nativity (place of birth) in Milton
Children under 6 years - Living with two parents Both parents native 1,848 100.0% NativeBoth parents foreign-born 312 61.3% Native197 38.7% Foreign-bornOne native, one foreign-born parent 259 100.0% NativeChildren under 6 years - Living with one parent Native parent 89 100.0% NativeForeign-born parent 125 100.0% NativeChildren 6 to 17 years - Living with two parents Both parents native 4,061 98.4% Native65 1.6% Foreign-bornBoth parents foreign-born 1,073 75.4% Native349 24.6% Foreign-bornOne native, one foreign-born parent 717 99.1% Native7 0.9% Foreign-bornChildren 6 to 17 years - Living with one parent Native parent 876 100.0% NativeForeign-born parent 407 53.0% Native362 47.0% Foreign-born
Grandparents responsible for own grandchildren in Milton
Grandparents (30 to 59 years) White / Caucasian 44 100.0% Not responsible for grandchildrenWhite alone, not Hispanic / Latino 24 100.0% Not responsible for grandchildren
Grandparents (60 years and over) White / Caucasian 55 100.0% Not responsible for grandchildrenWhite alone, not Hispanic / Latino 40 100.0% Not responsible for grandchildren